


This report describes what we learned from analyzing 9,616,211 comments people posted to The New York Times website between October 30, 2007 – the date on which The New York Times began allowing users to post comments to news stories – and August 13, 2013.1
The New York Times comment section dataset is unique in both its scope and its content. First, The New York Times gave us access to every comment posted to its site. Most commenting analyses examine only a subset of comments. Second, because the dataset includes comments posted over the course of multiple years, we can see how a technical redesign of the comment section affected behaviors within the commenting section. Finally, unlike many comment sections, The New York Times has an active community editing team, led by Bassey Etim, that moderates the comment section. The team engages both in pre-moderation, meaning that comments are screened by moderators before they are posted online, as well as in selecting representative comments to feature as NYT Picks. The dataset also included comments that were rejected from the site by the moderators. This allowed us to see how the moderating team interacted with comments.
The Problem
Ever since The New York Times and other news organizations began allowing comments on their sites, journalists have been concerned about the level of discourse that appears in comment sections. Clark Hoyt, the public editor of The New York Times when the paper launched comments on news stories, summed up this concern well:
How does the august Times, which has long stood for dignified authority, come to terms with the fractious, democratic culture of the Internet, where readers expect to participate but sometimes do so in coarse, bullying and misinformed ways?2
In this report, we consider Hoyt’s question by examining both the participation in the comment section on The New York Times site and the content of the comments on the site. The Center for Media Engagement has investigated comment sections before, asking whether journalist engagement in comment sections,3 changing the structure of the comment section,4 or including summary information about an issue prior to a comment section5 influences commenting activity. Yet there is much researchers and journalists do not yet understand about the commenting process and the tensions between participation and ideal content.
Here, we return to a few of these topics and raise new questions by turning to observational, rather than experimental, data. How important is the technical design of a comment section to the way news users engage with comments? What prompts commenters to post more comments? How does the comment content affect how journalists and news users respond? We answered each of these questions by examining comments posted to one of the largest, most active news organization commenting spaces: The New York Times comment section.
Key Findings
The following results emerged from our analysis:
- The number of comments increased after The New York Times redesign in November 2011.
- Use of abuse flags declined following the redesign.
- The redesign had little effect on the number of recommendations per comment.
- The use of uncivil terms declined slightly after the redesign.
- Receiving a recommendation or being selected as a “NYT Pick” relates to a boost in how many times a commenter posts.
- The New York Times receives more comments on weekdays than on weekends.
- Rejection rates and the use of uncivil terms in the comments are higher on weekends than on weekdays.
- Comments containing profanity and using fewer words are more likely to be rejected.
- Comments containing profanity and using fewer words are less likely to be selected as NYT Picks.
- Using partisan and uncivil terms in a comment corresponds with a greater number of user recommendations.
Implications for Newsrooms
The New York Times comment section provides a treasure trove of information about the commenting behaviors of individuals and newsroom staff. Thoughtful redesigns can promote more commenting without significantly threatening the discourse within the comment section. Opinionated news may prompt more uncivil comments that are likely to be rejected. When moderators select comments to post prominently on a site, those commenters who receive the honor appear to comment more after the engagement. Moderators reject comments with profanity, while site visitors recommend comments that include partisanship and incivility. Understanding how real-life commenting works can help journalists as they grapple with the best ways to design and interact with comments on their own sites.
The Study
The Effects of Comment Section Redesign
In November 2011, The New York Times redesigned its comment section. Before the change, commenters were only able to make comments on news stories by clicking on a “comments” link, which opened the comment section on a new webpage. After the redesign, the comment section was placed directly below the article text, allowing commenters to more easily make comments without leaving the article page.6 As a number of news organizations, including The Washington Post,7 The New York Times,8 and others,9are considering making more changes to their comment sections, we wanted to know, how did The New York Times redesign influence commenting behaviors?
One caveat is in order. The discussion below compares the 12 months prior to the redesign to the 12 months following the redesign. We cannot rule out the possibility that something else occurred during the same month as the redesign that could be responsible for the changes we document below. We are unaware of a change other than the redesign, however, that could account for the observed patterns.
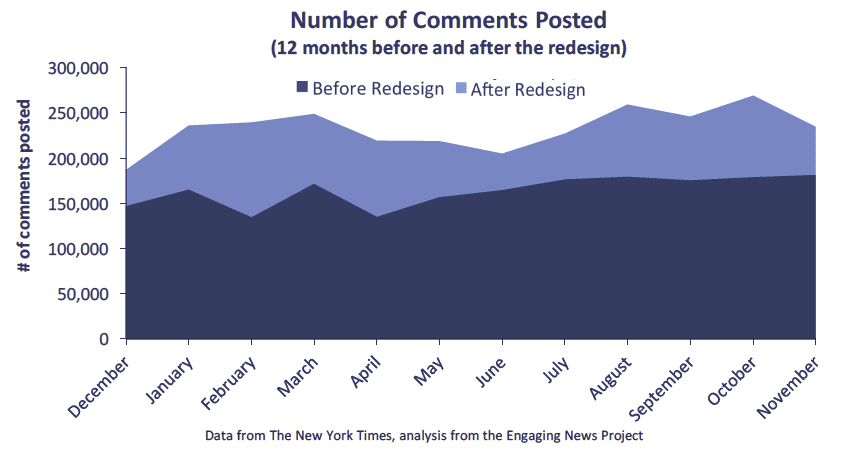
Commenting Increased After the New York Times Redesign
After the redesign, the number of comments posted to The New York Times website spiked. We compared the comment totals from 12 months before the comment section redesign to the comment totals from the 12 months after the redesign. In every one of the 12 months after the redesign, there were more comments posted to the site than in the same month before the redesign.10
This difference was largest when comparing February 2011, in which users posted 134,229 comments, and February 2012, in which users posted 239,512 comments – an increase of 78.4 percent. Even during the month with the smallest difference – December – commenters posted 39,969 more comments in 2011 as they did in 2010. In all, it appears that making the comment section more easily accessible to news users increased the number of comments people posted to the site.
Use of Abuse Flags Declined After the New York Times Redesign
Abuse flag use decreased after the redesign. Since the number of comments increased after the redesign, we examined the percentage of the comments that were flagged as abusive by users of The New York Times website. We again compared the 12 months prior to the redesign to the 12 months after the redesign.
Throughout the entire time period, few comments were flagged as abusive. In no month were more than 7 percent of comments flagged as abusive.
Even with this low percentage of flagged comments, we can see a difference before and after the redesign. Each of the 12 months before the redesign had a higher percentage of comments with abuse flags than the 12 months after the redesign. In fact, before the redesign, 4.6 percent of comments in a given month were likely to be flagged as abusive. After the redesign, the monthly percentage of comments flagged as abusive dropped to 1.2 percent.
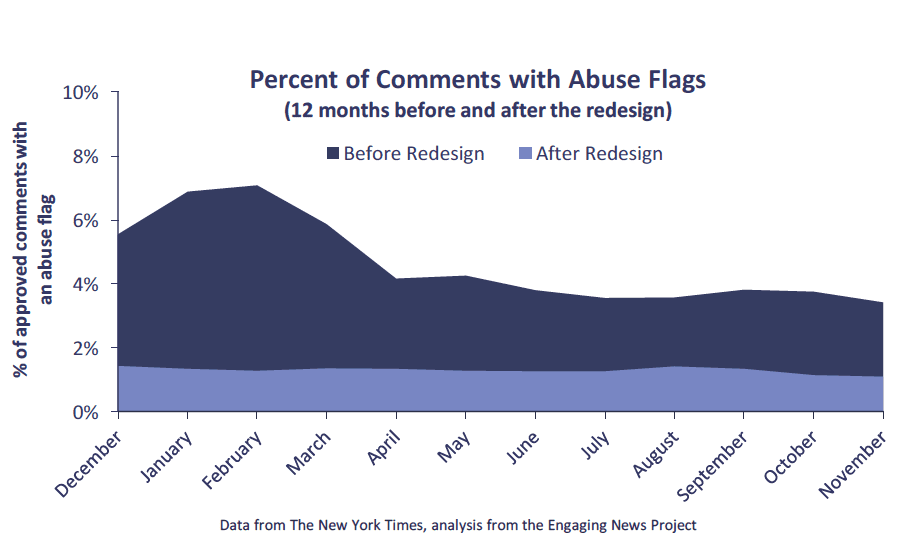
Although this result could suggest that the comment content became more respectful and civil after the comment section redesign, this likely isn’t the case. Part of the redesign altered the visibility of the abuse flag. Prior to the redesign, the abuse flag was visible for each comment. After the redesign, users had to hover over the comment before the flag button would appear. Again, the visibility of a tool – or, in this case, the lack of visibility – appears to change users’ behaviors in a comment section.
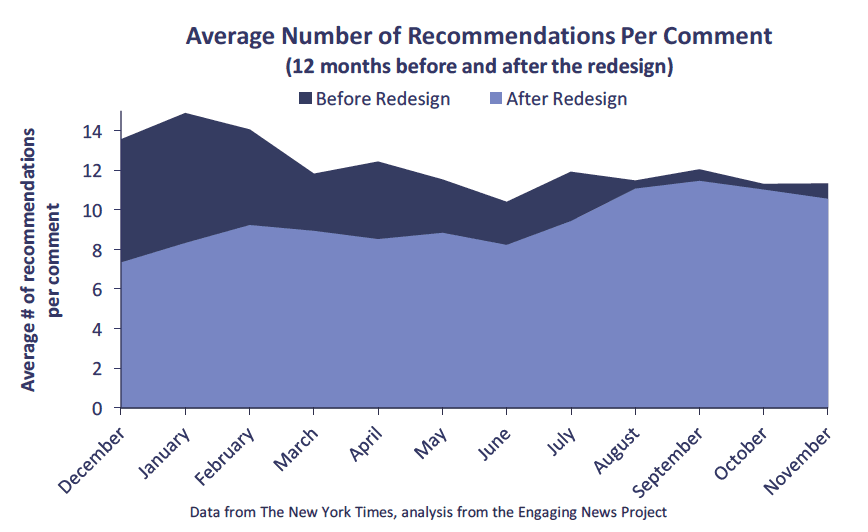
The New York Times Redesign Didn’t Have a Clear Effect on Recommendations
The effect of the redesign on number of recommendations per comment was less clear.
Immediately after the redesign, the average number of recommendations per comment each month was lower than the average number of recommendations per comment prior to the redesign. In January 2011, for instance, comments on average received 14.9 recommendations, whereas comments posted in January 2012 received only 8.3 recommendations on average.
However, as the end of 2012 approached, the monthly average number of recommendations per comment increased so that there was virtually no difference between the months prior to the redesign and the months after the redesign. In August 2011, for example, the average number of recommendations per comment was 11.5 and, in August 2012, the average number of recommendations per comment was 11.1. The redesign may have initially decreased comment recommendations, but the difference eventually went away.11
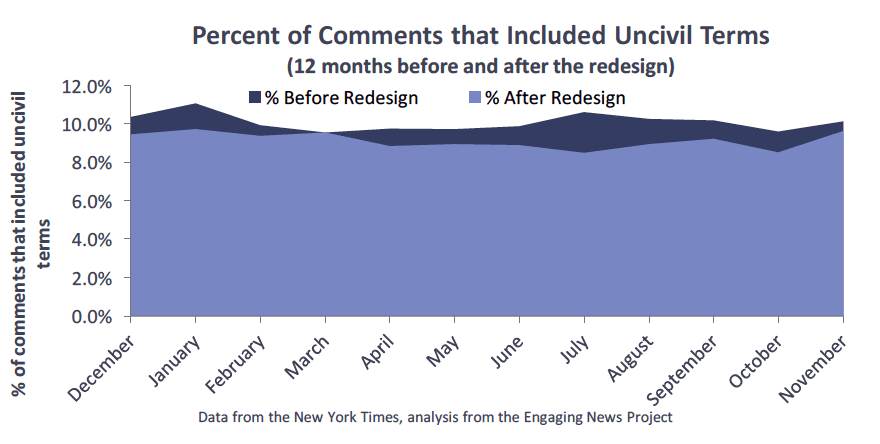
Use of Uncivil Terms Declined Slightly Following the New York Times Redesign
To analyze the use of uncivil language in the comments, we created a computer code that would search the text of the comments for words commonly considered uncivil, such as dumb, bigot, liar, and similar words that connote disrespect for a person or group. Any comment that included at least one of these terms was considered “uncivil” for the purposes of this analysis.12,13
Overall, less than 12 percent of comments in the 12 months before and 12 months after the redesign included terms from the incivility dictionary.
As the month-to-month comparison below shows, however, the percentage of comments that contained incivility was slightly less after the redesign than before – but only by an average of 1.0 percent. Thus, the redesign seems to have decreased the percentage of uncivil comments on the site but only slightly.
The Effects of Recommendations and Editor’s Picks on Commenting Behavior
Does having a comment “recommended” by another site visitor affect behavior? Alternatively, does having a comment selected as a “NYT Pick” influence a commenter’s likelihood of leaving future comments? Increasing commenting behavior can be a desirable goal for newsrooms, both in terms of creating a vibrant commenting community and increasing users’ time on site.
Interaction with a piece of technology on a webpage is one way to accomplish this goal.14 For instance, when a site user clicks a recommendation button to praise a comment or when a moderator selects a comment to feature as a NYT Pick for a news article, those individuals are indirectly interacting with the people who post the comments by using the technology available on The New York Times website. We were interested in whether commenters reacted to receiving a recommendation or being a NYT Pick by posting more comments.
Note that the analysis below compares commenter behavior in the 30 days prior to receiving a recommendation, or being selected as a NYT Pick, to the 30 subsequent days.15 It is possible that the differences we detect are due to something other than receiving a recommendation or being selected by The New York Times moderators. Given the large sample size and persistence of the effects across a series of tests, however, we do not have a plausible alternative explanation for the findings.
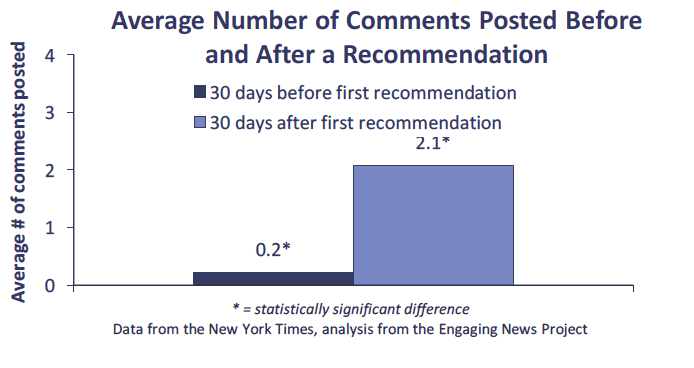
Recommendations Relate to a Boost in Subsequent Commenting
Recommendations occurred when visitors to The New York Times site clicked on a “recommend” button on any comment posted to the site. Of the 968,430 commenters who had at least one approved comment in our dataset, 768,053 (79.3%) received at least one recommendation from a site visitor.
In our analysis, we wanted to see whether the first time a commenter posted a comment that received at least one recommendation prompted more commenting behavior. We found each person’s first comment that received a recommendation. Then we computed the number of comments the person posted in the 30 days before posting that comment and compared it to the number of comments the person posted in the 30 days after.
Recommendations seem to prompt commenters to post more comments. In the 30 days before a commenter first posted a comment that received a recommendation, that commenter made, on average, 0.2 comments. In the 30 days after that commenter posted a comment that received at least one recommendation, however, that commenter posted, on average, 2.1 comments.16,17
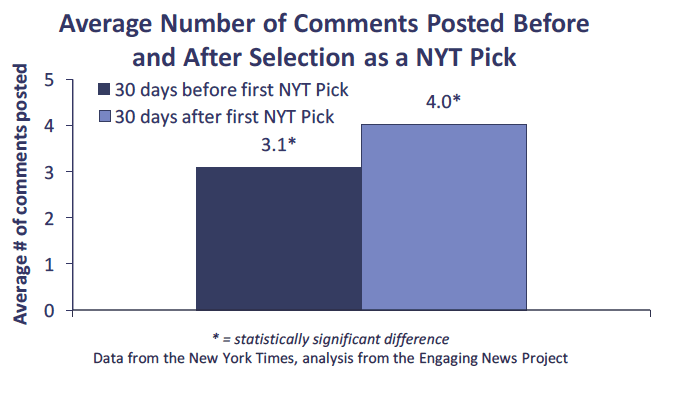
Being Selected as a “NYT Pick” Corresponds with an Increase in Commenting Behavior
NYT Picks occur when a member of “a staff of about 13 mostly part-time moderators, all of whom are journalists,” chooses a comment that is representative of the discussion in the comment section and features it prominently on the webpage.18 NYT Picks were less common than the user recommendations on the site, yet 89,031 commenters (9.2%) who had at least one comment approved also posted at least one comment that was selected as a NYT Pick.
In the 30 days before a commenter posted a comment that was selected by a moderator as a NYT Pick, that commenter posted 3.1 comments on average. In the 30 days after a commenter posted a comment that was selected as an NYT Pick, that commenter posted, on average, 4.0 comments.19,20
How Commenting Behavior Varies Across the Week
Next, we were interested in when news users posted the most comments. Perhaps the weekends, when they have more free time? Or the weekdays, when more people are near their work computers?
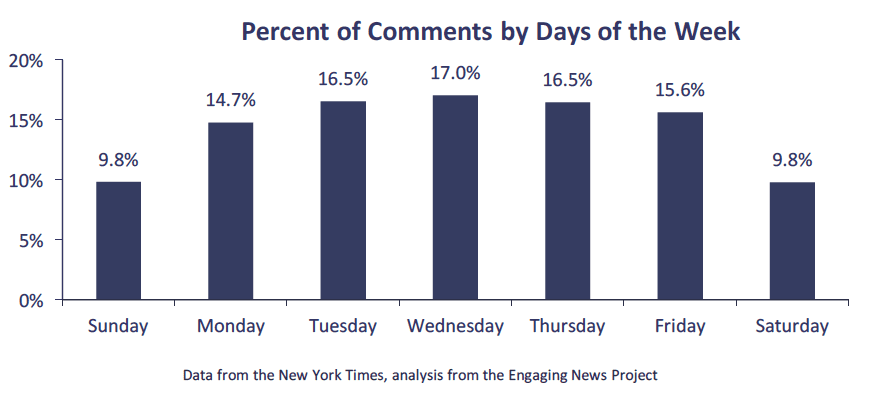
More Comments Posted During the Middle of the Week
In The New York Times dataset, we found that more comments were posted during the middle of the week – particularly Tuesdays, Wednesdays, and Thursdays. Saturdays and Sundays had many fewer comments, approximately 7 percent fewer than Wednesdays, the day that had the highest percentage of comments.
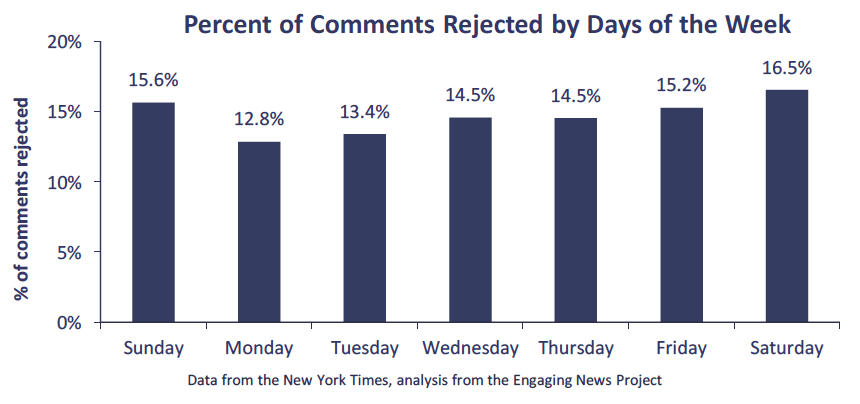
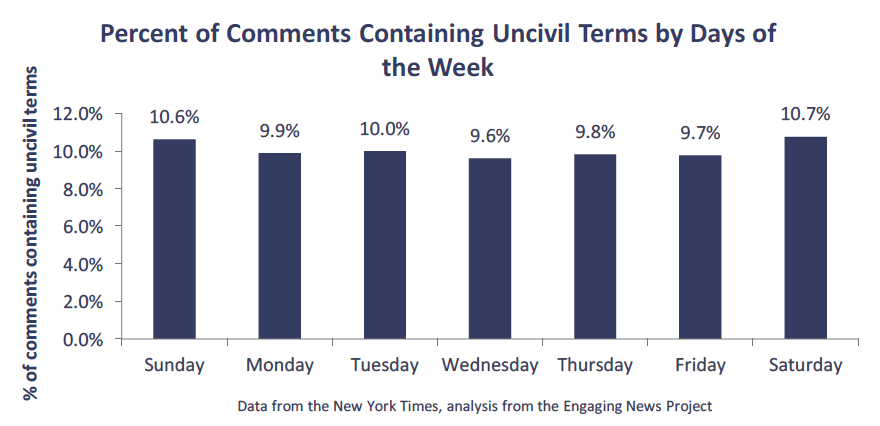
Comments More Likely to be Rejected, to Contain Incivility on the Weekends
The day of the week also influenced the rejection rate for the comments. The New York Times dataset included not only the comments that were approved by site moderators, it also included comments that were rejected and not posted on the site.
Overall, 1,393,882 comments (14.5% of all comments) were rejected. The lowest percentage of rejections occurred on Mondays (12.8%). The highest percentage of rejections occurred on Saturdays, with 16.5 percent of the comments being rejected. Friday and Sunday had similarly high rejection rates of 15.2 and 15.6 percent, respectively.
Two possibilities could explain this pattern. First, it may be that, since there were fewer comments posted during the weekend, moderators have more time to spend with each comment and, therefore, are able to reject more comments that are uncivil. Examining the percentage of comments that included incivility across the days of the week (see the next chart), however, demonstrates that this likely is not the case. Instead of the percentage of uncivil comments being consistent across each day of the week, incivility also increased slightly over the weekend.
Alternatively, The New York Times commenting team suggests that the content of the news differs between the week and the weekend. That difference in content might be driving the higher rejection rates. Specifically, nytimes.com Community Editor Bassey Etim explains, “During the weekend, more Opinion and magazine articles are posted. The comments on these and weekend feature stories might be substantially different than the comments posted on traditional news stories.”
Comment Section Moderators Make Decisions Based on Profanity and Length
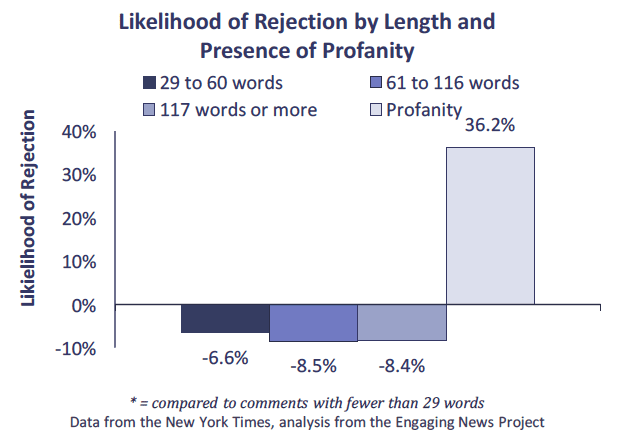
We also analyzed what attributes of a comment predicted interactions with the comment by site moderators. In particular, we examined whether the number of words in a comment, as well as whether the comment contained political, uncivil, or profane words,21 predicted whether that comment would be rejected from the comment section or selected as a NYT Pick. The two most consistently important elements of comments that predicted moderator decisions were comment length and profanity.
We first examined how journalists make decisions about which comments to reject from appearing on the site altogether. As the chart below shows, length mattered. Journalists were less likely to reject comments that were longer than 29 words. The longest comments were approximately 8 percent less likely to be rejected compared to the shortest comments.22,23
Far more important than length for determining whether a comment was rejected, however, was the use of profanity (e.g., BS, damn, hell).24 When a comment included at least one word from our profanity dictionary, it was much more likely to be rejected by a moderator. A comment with profanity was approximately 36.2% more likely to be rejected from the comment section.
Similarly, for NYT Picks, length influenced moderators’ decisions. Comments longer than 29 words were more likely to be selected as NYT Picks compared to shorter comments. The longest comments – those over 116 words – showed the greatest increase in probability of being selected (3.6%) compared to the shortest comments.
When a comment included profanity, it was about 1 percent less likely to be selected as a NYT Pick. This reduced chance of being a NYT Pick occurred even as most comments that include profanity were rejected from the online site already. Of the total 142,337 comments that included our profanity dictionary, 76,513 (53.7%) were filtered out by moderators before even appearing on the site. The remaining comments that included profanity were significantly less likely to be chosen as NYT Picks.

Comments Using Partisan and Uncivil Words Have More Recommendations
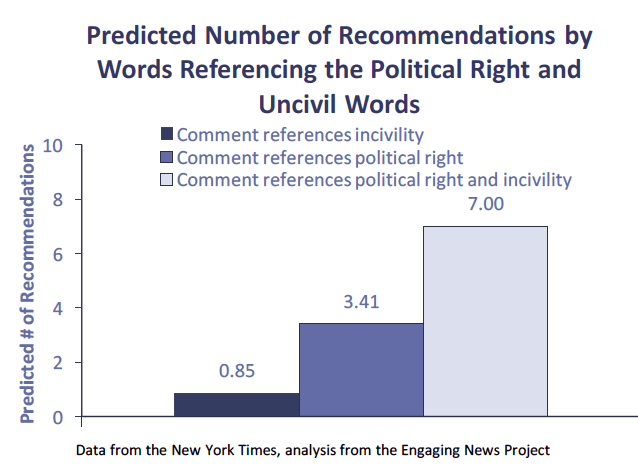
The New York Times data allowed us to see what attributes of comments increase the number of recommendations a comment receives. We examined whether the number of words in a comment, as well as whether the comment contained political, uncivil, or profane words,25 predicted the number of recommendations from site visitors. We found that recommendations increased when comments included partisan and uncivil words.
We examined the presence of partisan words, including references to the political left (e.g., Clinton, Biden, dems) and references to the political right (e.g., Bush, Rand, repubs).26 Incivility, as described earlier, meant that the comment used words like bigot, liar, dumb, or hypocrite.
Partisan content in a comment affected the number of recommendations that a comment received. When a comment included at least one reference to the political right, that comment had 3.4 more recommendations than a comment that did not reference the political right.27
Inclusion of references to the political right along with references to incivility – ‘dumb’ and ‘Repubs’ or ‘Bush’ and ‘hypocrite’ – prompted a larger increase in number of recommendations. When a comment included words related to the political right as well as words related to incivility, that comment was likely to have 7.0 more recommendations than a comment that included neither type of word.
SUGGESTED CITATION:
Muddiman, Ashley and Stroud, Natalie Jomini. (2016, June). 10 Things We Learned by Analyzing 9 Million Comments from The New York Times. Center for Media Engagement. https://mediaengagement.org/research/10-things-we-learned-by-analyzing-9-million-comments-from-the-new-york-times/
- Prior to October 2007, The New York Times allowed commenters to post on blogs but not on dedicated news stories. On October 30, 2007, an online Science Times article and an online editorial added comment sections, marking the first time users could comment on more traditional news stories. See Hoyt, C. (2007, November 4). Civil discourse, meet the internet. The New York Times. Retrieved from http://www.nytimes.com/2007/11/04/opinion/04pubed.html?pagewanted=all [↩]
- Hoyt. (2007). [↩]
- Stroud, N. J., Scacco, J. M., Muddiman, A., & Curry, A. (2013). Journalist involvement in comment sections. Center for Media Engagement. Retrieved from https://mediaengagement.org/research/journalist-involvement/ [↩]
- Stroud, N. J., & Scacco, J. M. (2014). Restructuring comment sections. Center for Media Engagement. Retrieved from https://mediaengagement.org/research/restructuring-comment-sections/ [↩]
- Peacock, C., Curry, A., Cardona, A., Stroud, N. J., Leavitt, P., & Goodrich, R. (2015). Displaying political facts and pro-con arguments before an online discussion forum. Center for Media Engagement and National Institute for Civil Discourse. Retrieved from https://mediaengagement.org/research/online-discourse/ [↩]
- There were other changes as well, including allowing certain commenters with a track record of approved comments to post without needing moderator approval. For more details, see Sonderman, J. (2011, November 30). New York Times overhauls comment system, grants privileges to trusted readers. [↩]
- See details at: https://www.washingtonpost.com/news/ask-the-post/wp/2014/10/27/updates-to-the-comments-section-a-pause-button-clean-design-and-more/ [↩]
- See details at: http://newoldage.blogs.nytimes.com/2014/01/16/reader-comments-in-the-new-design/ [↩]
- See details at: http://www.poynter.org/news/mediawire/218284/more-news-organizations-try-civilizing-online-comments-with-the-help-of-social-media/ [↩]
- It is important to note that 2012 was an election year, meaning that some of the increase between 2011 and 2012 might be due to the election. However, even December 2011, the month right after the redesign and a month that is less likely to have been influenced by election season, saw a nearly 40,000 comment increase. Additionally, when the same analysis was run comparing the monthly comment total in the months before the redesign to the same months between December 2012 and August 2013, there were still more monthly comments after the redesign than prior to the redesign. [↩]
- The lack of a difference in number of recommendations per comment before and after the redesign is reinforced when we examine the median instead of the mean recommendations per comment. When the median number of recommendations is used, there is no change at all. Instead, there is a median of 2 recommendations per comment per month for each month before and after the redesign. [↩]
- More specifically, we used an algorithm to pull the 5,000 most-used stemmed terms from all of the comment text in the dataset. We then pulled out all of the stemmed terms that seemed to the authors to be related to incivility. However, these terms were out of context, meaning that they might have been used as incivility or they might have been used in another way. For instance, the word “farce” could be used to disrespect an opponent or to describe a movie. Thus for each word in the incivility dictionary, we randomly selected 25 comments that included the stemmed term and had two ENP members code whether that comment referenced the stemmed term in an uncivil way. Anytime 80 percent or more of the randomly selected comments contained that stemmed term in a way that the coder considered uncivil, the term was coded as a “1,” meaning that it should be included in the incivility dictionary. If fewer than 80 percent of the comments referenced the stemmed term in an uncivil way, the term was coded as a “0,” meaning that it should not be included in the incivility dictionary. We then ran an inter-coder reliability test on the coders’ decisions to include or not include the terms in the incivility dictionary. Reliability was strong. The dictionary included 59 stemmed terms. Contact the authors for the full dictionary. [↩]
- We also examined the percentage of comments that included profanity (e.g., hell, BS). Similarly to the analysis presented in the text, there was a consistent, but small, decrease in the use of profanity in each month after the redesign compared to the same month before the redesign. [↩]
- Stromer-Galley, J. (2004). Interactivity-as-product and interactivity-as-process. The Information Society, 20(5), 391–394. http://doi.org/10.1080/01972240490508081 [↩]
- To test the robustness of the results, we also ran the analyses for the 7 days before and after a person’s first comment with a recommendation or selection as a NYT Pick. The results remained significant and in the same direction as the results presented in this report. [↩]
- This difference was significant, as demonstrated by a paired-sample t-test (t(146,507) = -154.58, p < .001). [↩]
- Recommendations were so prevalent that 644,105 commenters received at least one recommendation on the first comment that they posted to the site. To ensure that this trend was not amplifying the effect of the interaction, we re-ran the analysis without the commenters who received at least one recommendation on the first comment they posted to the site. The results were the same: there were 2.15 comments, on average, posted in the 30 days after the first recommended comment compared to 0.34 comments, on average, posted in the 30 days prior to posting the comment that received the first recommendation (t(173,626) = -144.14, p < .001). [↩]
- Sullivan, M. (2013, August 2). Perfectly reasonable question no. 5: On comment ‘Picks.’ The New York Times. Retrieved from http://publiceditor.blogs.nytimes.com/2013/08/02/perfectly-reasonable-question-no-5-on- comment-picks/ [↩]
- This difference was significant, as demonstrated by a paired-sample t-test (t(48,710) = -30.32, p < .001). [↩]
- There were 40,320 commenters who only made one comment within the 30 days before and the 30 days after time frame that we examined here. These commenters were not included in the analysis. However, when these commenters were added to the analysis, the results demonstrated the same pattern: the number of comments posted after the first comment that received a NYT Pick was, on average, higher than the number of comments posted before the first comment that received a NYT Pick. The difference was significant, as shown by a paired- sample t-test (t(89,030) = -30.19, p < .001). However, the size of the difference was smaller, with commenters, on average, posting 1.69 comments in the 30 days before receiving a NYT Pick and 2.02 comments in the 30 days after receiving a NYT Pick. [↩]
- Specifically, we included dictionaries for general political words (e.g., mayor, veto), partisan words that are not related to the political left or political right (e.g., partisan, extremist), citizenship words (e.g., citizen, voter), political extremes (e.g., Stalin, Hitler), references to the political left (e.g., Obama, Clinton), references to the political right (e.g., Bush, repubs), incivility (e.g., dumb, hypocrite), and profanity (e.g., damn, BS). To determine whether a comment included any of the dictionaries, we followed the steps outlined in Footnote 12 for each of the dictionaries. Inter-coder reliability was high for each of the dictionaries. [↩]
- We use percentages loosely in our discussion of these findings. The outcome variables “reject” and “NYT Pick” are dichotomous, meaning that a logistic regression model is best suited for the outcomes. Since the data were grouped by both the article on which the comment was posted and the commenter who posted the comment, the best model to run would be a logistic conditional fixed effect model using article and commenter as the fixed effects. Unfortunately, we could not run logistic conditional fixed effect models while controlling for both fixed effects at the same time with available programming. Thus, our second best option was to run linear fixed effect models that could handle two fixed effects at once. Therefore, the “percentages” described here are actually coefficients from a linear fixed effects model. However, all results were replicated across a number of statistical models, including logistic regression models, and the substantive results were the same. [↩]
- The analyses written up in this report included dummy variables for number of words based on the quartiles of that variable. The first quartile, used as a reference group in this section, included comments with 28 words or fewer. The second quartile included comments with 29 to 60 words. The third quartile included comments with 61 to 116 words. The fourth quartile included comments with more than 116 words. When number of words was included as a continuous count variable, rather than a series of dummy variables, the results for the number of words generally held for each variable (e.g., as number of words increased, the likelihood that a comment was selected by an editor also increased). The dummy variables were included here for two reasons. First, we predicted that different comment lengths might have effects that were not directly linear. For instance, perhaps very small comments were more likely to be rejected compared to very large comments but not to comments in the second quartile, or perhaps very long comments were not selected by moderators for NYT Picks because commenters were more likely to ramble off-topic. Second, when we included the word count variables as dichotomous dummy variables, all of our predictor variables were dichotomous. This allowed us to compare the coefficients, and the strength of effects, across variables easily. [↩]
- The profanity dictionary was created using the steps outlined in Footnote 12. The dictionary had strong reliability. The profanity dictionary included 5 stemmed terms. [↩]
- The same variables related to comment content listed in Footnote 21 were included in these models. [↩]
- The partisan dictionaries were created using the steps outlined in Footnote 12. The political left dictionary included 20 stemmed terms. The political right dictionary included 31 stemmed terms. Both dictionaries were highly reliable. [↩]
- Comments that referenced the political left included significantly fewer recommendations than comments that did not reference the political left. However, the coefficient was small – only 0.37 – demonstrating that referencing the political left did not have as strong an effect as most other variables included in the model. [↩]