


![]()

This research project was led by the News Co/Lab at Arizona State University in collaboration with the Center for Media Engagement at The University of Texas at Austin. Together, we designed and tested an online survey that three news organizations used to examine transparency, engagement, and mutual understanding with the communities they serve. In total, 4,854 people participated in this survey from three communities – Macon, Georgia; Fresno, California; and Kansas City, Missouri. Our partner newsrooms in those communities also surveyed 88 journalists and 51 news sources. This report provides insight into what we learned across these surveys.
The Problem
In today’s complicated media landscape, many people have trouble distinguishing between news and disinformation, advertising, and opinion. As newsrooms look to reach audiences with diverse understandings of the news, they face numerous challenges. There are disconnects in how the public, journalists, and news sources think about the media. The public is also divided in its views of the media along demographic and political lines. People with different levels of education approach news differently.
Key Findings
- College Graduates Spot Fake Headlines More Successfully
Survey participants were given two real headlines and one fake headline. Fifty-seven percent of those with less than a college degree were able to identify the fake news headline, compared to 68 percent of those with a college degree or more.
- People with Negative Attitudes about News Are Less Likely to Spot Fake News
Participants who associated negative words with the word “news” were less able to spot fake headlines and less able to distinguish news from opinion, analysis, or advertising.
- Major Differences in What Republicans, Democrats Think of News
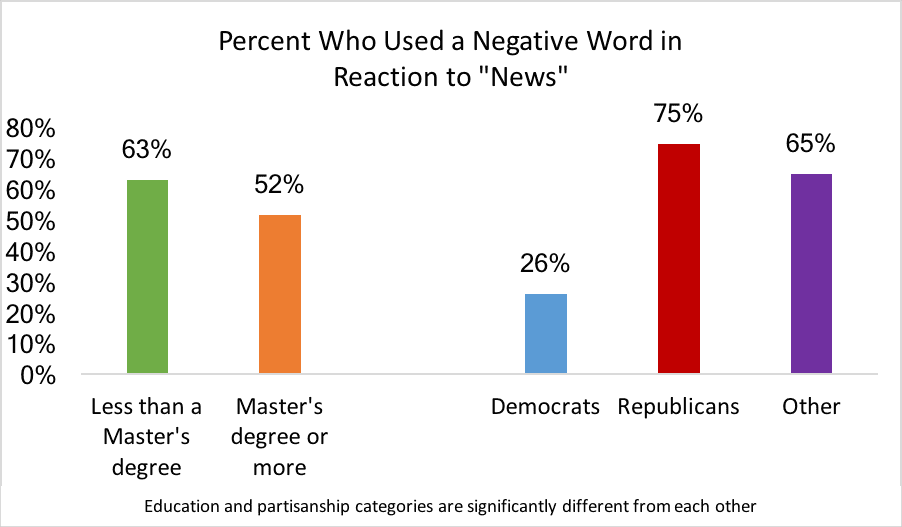
When asked what the first word that came to mind was when respondents heard the word “news,” 74 percent of those identifying as Republicans used a negative word, such as “fake” or “biased.” Only 26 percent of those identifying as Democrats used negative words.
- Local News Staff Rate Themselves Higher than News Sources, the Public
We asked journalists, news sources (those who are quoted in the newspaper), and members of the public in the three communities to indicate how well a series of adjectives applied to the local news organization. Journalists gave themselves higher ratings than did news sources and members of the public.
- Most Local Journalists See Explaining How News Works as Part of their Jobs
On average, journalists agree that explaining how news works is part of their jobs and their news organization’s mission. Journalists also express confidence in their ability to explain effectively how the news works to members of their community.
The Study
This report examines the attitudes and abilities of the public, news sources, and journalists in three communities. This is part of an on-going effort among three newsrooms: The Fresno Bee, The Kansas City Star, and The Telegraph. Working with the News Co/Lab at the Walter Cronkite School of Journalism and Mass Communication at Arizona State University, these newsrooms are pioneering efforts to engage their communities to better explain what they do.
As part of this effort, the News Co/Lab and the Center for Media Engagement in The University of Texas at Austin’s Moody College of Communication worked with the newsrooms to analyze the news ecosystem in the communities they serve: Macon, Georgia; Fresno, California; and Kansas City, Missouri. In each community, we sent out a survey to members of the public via Facebook. In total, 4,854 participated in the survey.1 The newspapers also surveyed journalists from their newsrooms and people who had been sources for the newspaper. Across all three newsrooms, 88 journalists and 51 news sources completed the survey. This report provides insight into what we learned across these surveys.
College Graduates Spot Fake Headlines More Successfully
In the survey, we gave people three headlines – two were real and a third was fake.
In Macon, Georgia, the two true headlines were “Hothead jailed over lack of BBQ sauce at Waffle House” and “Bizarre: Man says cops ordered him to cut off his dog’s head.” The fake headline read “Macon gang initiation: Shoot white women at mall.”
In Kansas City, the two true headlines were “Man freed from jail after 17 years when ‘lookalike’ is found” and “Bizarre: Dead body in truck in airport parking lot – for eight months.” The fake headline read “New study: Nearly half the nation’s scientists now reject evolution.”
In Fresno, California, the two true headlines were “Judge’s son sends lewd email and obscene photos” and “Bizarre: Sushi fan pulls five-foot tapeworm from his body.” The fake headline was “By population, Fresno is now the 10th largest city in the U.S.”2
The survey asked respondents in each community to identify the fake headline. Across the three communities, most people (61.6%) were able to identify the fake headline correctly, while the remaining 38.4 percent could not.
Those with a college degree or more education were better able to identify the fake news headline than those without a college degree. In particular, 56.7 percent of those with less than a college degree were able to identify the fake news headline, compared to 67.7 percent of those with a college degree or more.3 Although those with more education were more likely to answer the question correctly, education was not a panacea, as nearly a third (32.3%) of those with a college degree or more still were unable to identify the false headline.
There were differences across the three communities in how partisanship related to identifying a fake news headline. For two of the communities (Macon and Kansas City), Democrats were more likely than Republicans to identify the fake news headline correctly. In Kansas City, 86.3 percent of Democrats correctly identified the false headline, compared to 74.2 percent of those not identifying with one of the two major parties and 64.1 percent of Republicans.4 In Macon, 65.7 percent of Democrats answered the question correctly compared to 47.4 percent of those not identifying with a party and Republicans.5 In Fresno, however, 59.6 percent correctly identified the false headline, and there were no statistically significant differences by partisanship.6 What we learn overall is that partisanship can matter for whether people accurately detect a false news headline.
There were modest differences based on age and income. Younger people and those with higher incomes were better able to detect false news headlines. Nearly two-thirds (65.9%) of those aged 18 to 64 were able to identify the fake news headline, compared to 59.5 percent of those aged 65 and older.7 Further, there was evidence that as income increased, so did the percentage of people correctly identifying the false headline. While 53.7 percent of those making less than $30,000 a year correctly identified the false headline, 71.1 percent of those with incomes exceeding $150,000 a year did so.
People with Negative Attitudes about News Are Less Likely to Identify News Correctly or Ask for Help
Survey participants who associated negative words with “news” were less likely to identify fake headlines or to label different types of news accurately. They also were less likely to say that they needed help finding information online compared to those who associated positive or neutral words with “news.”
Participants were asked to identify the first word that came to mind when they saw the word “news.” Of those who answered the question, 61.9 percent of participants said a negative word, such as “fake, “lies,” untrustworthy,” or “BS.” Just over a third (38.1%) of respondents provided a positive or neutral word, such as “information” or “factual.”8
In Kansas City and Macon, those thinking that the news is negative were less able to identify a false news headline.9 In Kansas City, 68.6 percent of those who nominated a negative word when seeing the word “news” were also able to identify the fake news headline correctly. In Macon, 40.9 percent were able to do so. This is in contrast to the 81.8 percent in Kansas City and 59.3 percent in Macon using a positive word to describe the news who were able to identify false and true headlines. In Fresno, however, people were equally likely to identify the fake news headline regardless of their opinion of the media.
In another part of the survey, we showed people one of four headlines and ledes of stories at random and asked them to identify whether the story was news, opinion, analysis, or sponsored content. The four examples were designed to convey the categories of news, opinion, analysis, or sponsored content clearly. Overall, 75.6 percent of the survey participants could correctly identify the appropriate label.
There was a relationship between correctly identifying the news label and whether people said a negative word or a positive/neutral word to describe the news. As before, those using a negative word to describe news were less likely to identify the news label correctly (73.8%) versus those who used a positive or neutral word to describe news (79.5%). The difference is modest, and is statistically significant for Macon and Fresno, but not for Kansas City.10 (We also analyzed whether a person’s ability to identify whether content was news, analysis, opinion, or sponsored content varied by demographic characteristics and political affiliation. It did not. People from different demographic groups were equally able to identify the correct label.)
In another part of the survey, respondents were asked which of the following comes closest to describing them: 1) I do not need help finding the information I need online; 2) I could occasionally use some help in finding the information I need online; or 3) I frequently need help finding the information I need online.
Overall, few respondents said that they frequently needed help. So we compared those in the first category, who said that they do not need help (62.3%), to those in the second and third categories, who reported that they occasionally or frequently need help (37.7%).
Those using a negative word to describe the news were less likely to say that they needed help (33.7%) compared to those using a positive or neutral word to describe the news (41.4%).11
Major Differences in What Republicans, Democrats Think of News
When asked about the first word that came to mind when seeing the word “news,” 74 percent of Republicans responded with a negative word, such as “fake” or “biased.” Twenty-six percent of those identifying as Democrats associated the word “news” with a negative word. Respondents who said they were neither Democrats nor Republicans used negative words 64.7 percent of the time.12
There also were differences by education. People with a master’s degree or higher were less likely to use a negative word than those with lower levels of education. Just over half of those with an M.A. degree or higher (51.5%) used a negative word to describe news compared to 62.9 percent of those with less than an M.A. degree.13
Some Say They Need More Help Finding Information Online
Those with a high school education or less were more likely to say that they need help in finding information online compared to those with a bachelor’s degree or more. Specifically, 44.4 percent of those with a high school degree or less reported that they occasionally or frequently need help finding the information they need online, compared to 38.4 percent of those with an associate degree and 34.1 percent of those with a bachelor’s degree or more.14 Note that there is a statistically significant difference between those with a high school degree or less and those with a B.A. degree or more. Those with an associate degree are not significantly different from the other categories in their reported need for help finding information online.
Women were more likely than men to say that they occasionally or frequently need help; 40.8 percent of women identified needing help compared to 34.5 percent of men.15 Older respondents (>65 years of age) were more likely to say that they occasionally or frequently need help than younger respondents (18-64 years of age). Forty-one percent (41.1%) of older respondents identified needing help, compared to 33.9 percent of younger respondents.16
Local News Staff Rate Themselves Higher than News Sources, the Public
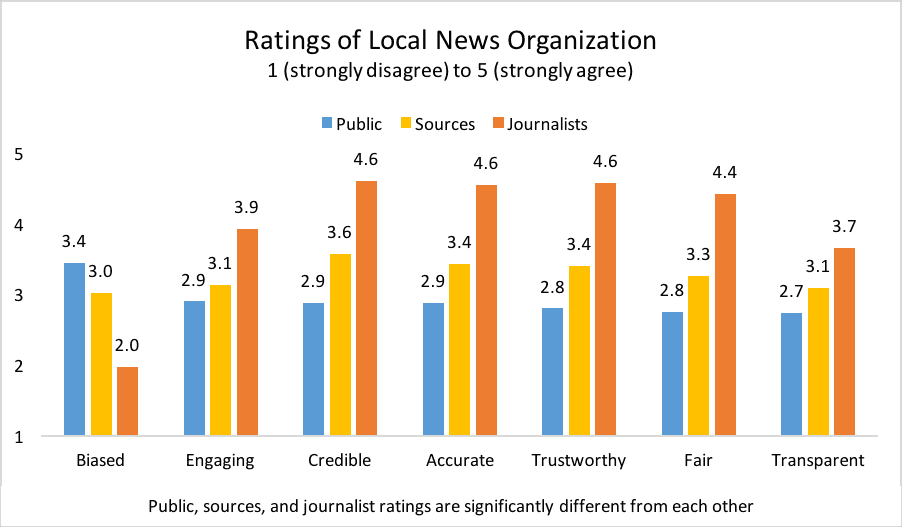
We asked journalists, news sources, and members of the public in the three communities to indicate how well a series of adjectives applied to the local news organization on a 1 (strongly disagree) to 5 (strongly agree) scale.
Across the categories, the journalists surveyed gave themselves higher ratings than did news sources and members of the public.17 News sources, people who are regularly interviewed by journalists, also rated local news organizations more positively than did the general public, but the differences were not large.18
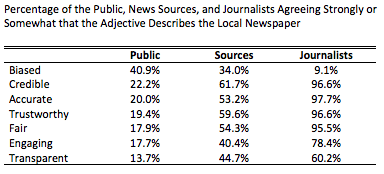
We can also break these numbers down based on the percentage of each group saying that they “agree” or “strongly agree” that the adjective applies to the local newspaper. Results are shown in the table below.
In addition to the overarching pattern of journalists rating the news organization more highly than the public and news sources, another pattern is clear. Journalists rate their local newsroom more highly on credibility, accuracy, and related concepts than they do on being engaging and transparent. The public and news sources follow suit, but the differences are less pronounced.
Journalists Rate Themselves High on Accuracy Practices, Lower on Engagement and Transparency Practices
We also asked all three groups to rate the news organization’s performance with respect to specific reporting, transparency, and engagement practices. In general, across these categories, journalists rated the newsroom more highly than did news sources or members of the public. However, they were in much closer alignment with the public when it came to improvement needed in transparency and engagement practices.
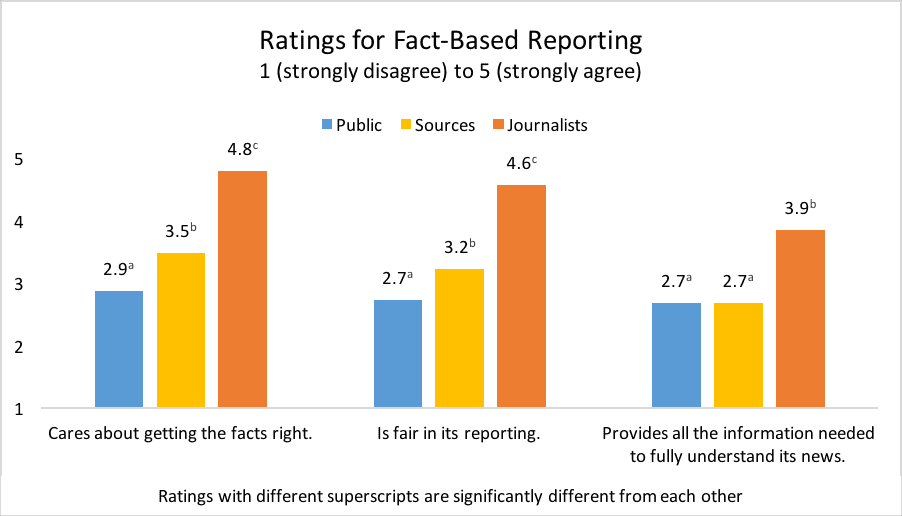
Fact-based reporting practices
On fact-based reporting practices, journalists were more enthusiastic about their local newsrooms than were news sources and the public. When asked how much they agreed that the local news organization “cares about getting the facts right,” journalists gave their local newsroom much higher marks than did news sources, who gave the newsroom higher marks than did the public. Nearly universally (98.9%), journalists agreed or strongly agreed with this statement, compared to 50.0 percent of news sources and 22.8 percent of the public.19
When asked how much they agreed that the local news organization “is fair in its reporting,” 94.3 percent of journalists agreed or strongly agreed, compared to 50 percent of news sources, and 17.8 percent of the public.20
Finally, when asked about the newsroom providing “all the information needed to fully understand the news,” journalists rated the newsroom higher than did the public or news sources. Three-fourths of journalists (76.1%) agreed or strongly agreed, compared to 31.3 percent of news sources and 12.7 percent of the public.21
Transparency
With respect to transparency, the public, journalists, and news sources were aligned in their assessment that their local newsroom “explains how and why it decides what stories to cover.” On average, the public rated the newsroom a 2.57, news sources a 2.60, and journalists a 2.70 (from 1, strongly disagree, to 5, strongly agree). These averages are not significantly different. Seventeen percent of journalists, 18.8 percent of news sources, and 6.7 percent of the public agreed or strongly agreed.22 In other words, no group overwhelmingly agreed that the newsrooms explain how and why it covers specific stories.
The three groups did differ from each other in how much they agreed that their local news organization “tells me who its journalists are and what they do.” In particular, news sources rated the news organization more positively than did the public, and the public rated the news organization more positively than did local journalists. On average, journalists rated the newsroom a 2.88 (28.4% agreeing or strongly agreeing), the public rated it a 3.11 (27.2% agreeing or strongly agreeing), and news sources rated it 3.52 on average (64.6% agreeing or strongly agreeing).23
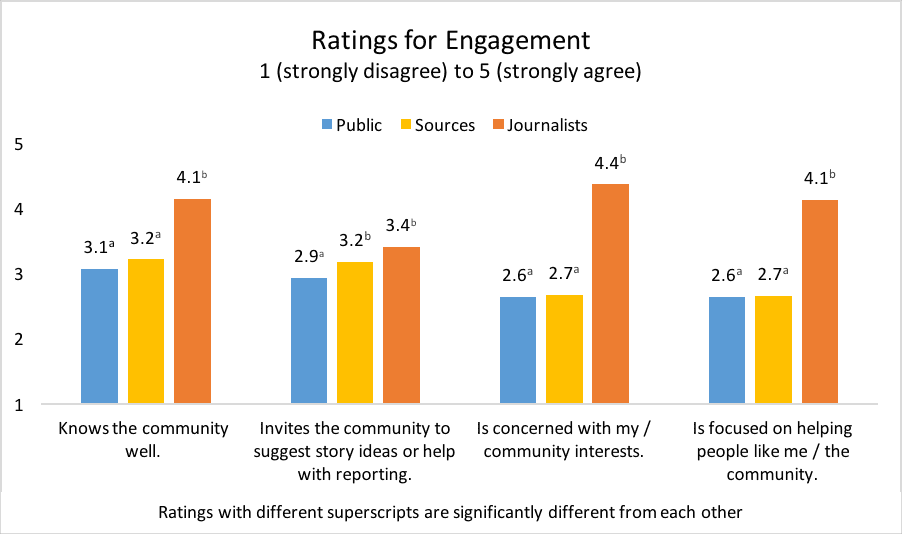
Engagement
When asked how much they agreed that their local news organization “invites the community to suggest story ideas or help with reporting,” the public gave the newsroom lower scores (average of 2.93, with response options from 1, strongly disagree, to 5, strongly agree) than did the news sources and journalists (average of 3.17 and 3.40, respectively).24
The disparity between the responses from journalists and the general public was more pronounced for three other engagement categories. When asked if their local news organization “is focused on helping the community,” 83 percent of journalists agreed or strongly agreed. In contrast, only 18.8 percent of news sources and 9.1 percent of the public agreed.25 The corresponding averages are shown in the chart below.
Similarly, when asked if the newsroom “knows the community well,” 85.2 percent of journalists agreed or strongly agreed, compared to 45.8 percent of news sources and 28.6 percent of the public.26
Finally, journalists overwhelmingly agreed that their newsroom was “concerned with the community’s interests” (93.2%). However, only 10.3 percent of the public and 29.2 percent of news sources agreed.27
Most Journalists See Explaining How News Works as Part of their Job
On average, journalists agree that explaining how news works is part of their jobs and their news organization’s mission. Journalists were asked to rate from 1 (strongly disagree) to 5 (strongly agree) how much they agreed that “part of my job is to help people understand how the news works.” Overall, 69.4 percent of journalists either agreed or strongly agreed that it was a part of their job, with an average rating of 3.93. When asked to agree or disagree with the statement, “Part of [my local newsroom’s] mission is to help people understand how the news works,” 75.3 percent of journalists either agreed or strongly agreed, with an average response of 4.05.
Journalists express confidence in their ability to explain effectively how the news works to members of their community. Half (54.9%) said they were somewhat effective and another quarter (25.6%) said they were very effective at this task.
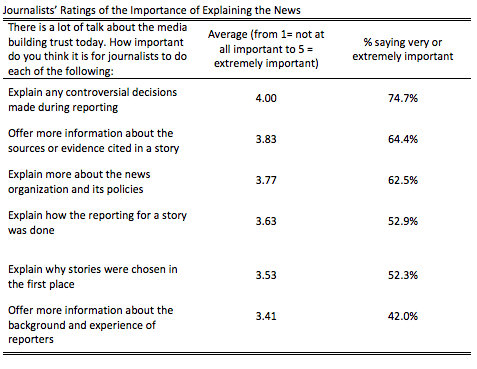
Journalists were also asked about different strategies they use to build trust with their community and rated each on a scale of 1 (not at all important) to 5 (extremely important). Some techniques, like to “explain any controversial decisions made during reporting,” were of high importance, with about three quarters (74.7%) of journalists saying it was very or extremely important. More than 60 percent of journalists also said strategies like offering “more information about the sources or evidence cited in a story” and explaining “more about the news organization and its policies” were important.
Journalists were somewhat less likely to say that offering “more information about the background and experience of reporters” was very important, although almost half (42%) still rated it as very or extremely important.
Journalists were divided about how well they help their communities understand online news. About a third (33.7%) said that their newsroom does “not well at all” or “slightly well” at helping the community know how they can share online news and information. In contrast, another third (31.3%) reported that the newsroom performs very or extremely well at this task.
Nearly half (50%) said that they do well at helping their community understand factual information online, but about a quarter (24.4%) disagreed, saying their newsroom performs “not at all well” or only “slightly well” in this area.
 Despite Flaws, Most News Sources Would Do It Again
Eighty-six percent of the news sources said they would be sources again for the same publication. The majority (72.1%) said that they would agree to be quoted by the same reporter. The news sources also remain loyal readers, reporting that they consume news from their local newspaper about once a day on average.28
A quarter (25.5%) of the news sources identified as being frequent or recurring sources; 57.4 percent said they had been cited more than once, but that it wasn’t a regular occurrence, and 17 percent said they had been cited only once.
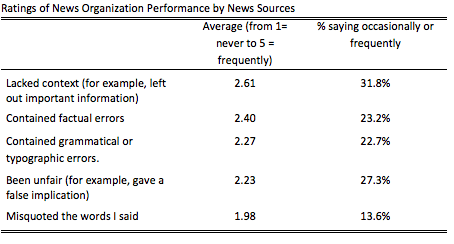
During their time as a news source, respondents generally said their local news organizations rarely made serious mistakes. They were asked to rate how often the newsroom made mistakes such as factual or grammatical errors, misrepresenting information, misquoting sources, or leaving out context on a 1 (never) to 5 (frequently) scale. No average score surpassed a 3 (rarely). The highest score was a 2.61 for leaving out important contextual information and the lowest score was 1.98 for misquoting the news sources’ words.
Nearly three in ten (29.5%) news sources reported asking for a correction in the past, and 27.3 percent said they felt a correction was warranted but did not ask for one. Most often, this was because they considered the mistake too minor. The remaining 43.2 percent said their local news organization had never been wrong in quoting or citing them.
Out of the 25 news sources who noticed an error, 13 asked for a correction. Of the 13 news sources who asked for a correction, half said their local newsroom was not very responsive to their request. The most common response from newsrooms was journalists explaining to the source personally why the mistake happened, although this was reported by only 38.5 percent of the 13 news sources who asked for a correction. None of the 13 news sources who asked for a correction said that the newsroom had explained in public why the mistake occurred.
Methodology
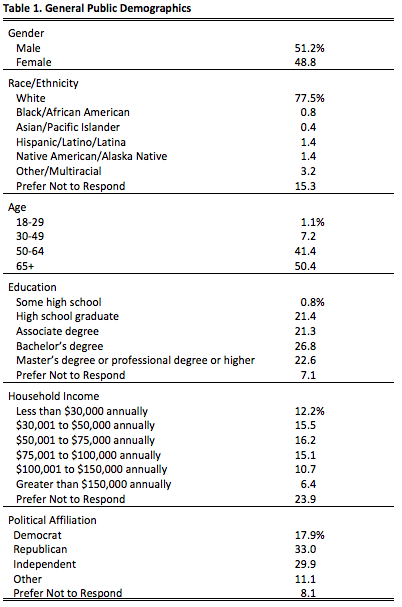
The general public surveys were disseminated through Facebook between May 7 and June 8, 2018. Facebook ads were shared with three distinct custom audiences in each of the three communities: users interested in news and news-related topics like education, crime and healthcare; users who liked the newspaper’s Facebook page; and “lookalike” audiences of people similar to those who liked the newspaper’s Facebook page. Participants accessed the survey through a link and then completed it on their own computers after consenting to participate.
The newsroom and news source surveys were created on the Qualtrics online platform, and The Fresno Bee, The Kansas City Star, and The Telegraph distributed the surveys to their staff and news sources with the assistance of the News Co/Lab. Newsroom employees and news sources were encouraged to complete the surveys, but not required to do so. Newsroom employees took the surveys between July 11 and August 13, 2018. News sources took the surveys between August 29 and October 2, 2018.
In total, 4,854 participated in the public survey.29

 Preliminary reports for the community survey, news sources survey, and newsroom survey can be found at the links provided.
SUGGESTED CITATION:
Chen, Gina Masullo, Murray, Caroline, Newton, Eric, Gillmor, Dan, Roschke, Kristy, and Stroud, Natalie Jomini. (2018, November). How the public, news sources, and journalists think about news in three communities. Center for Media Engagement. https://mediaengagement.org/research/public-sources-and-journalists
- In some analyses, the sample size is smaller because not all participants answered all of the questions. [↩]
- We note the fake headline in Fresno differed from the fake headlines in Macon and Kansas City. In Fresno, the fake headline was geographical in nature, written in an effort to appeal to a person who thought the city did not get the attention it deserved. In Macon and Kansas City, the headlines were rooted in racial or ideological beliefs. In addition, the language used in the fake headline in Fresno was not incendiary. [↩]
- We tested the difference using a chi-square statistic, which was statistically significant χ2(1) = 40.54, p < .01 [↩]
- We tested the difference using a chi-square statistic, which was statistically significant χ2(2) = 37.93, p < .01. We also ran Bonferroni-corrected pairwise comparisons. There were significant differences across the three party categories. [↩]
- We tested the difference using a chi-square statistic, which was statistically significant χ2(2) = 13.95, p < .01. We also ran Bonferroni-corrected pairwise comparisons. There were significant differences between Democrats and those with other partisan affiliations. [↩]
- We tested the difference using a chi-square statistic, which was not statistically significant χ2(2) = 2.29, p = .32 [↩]
- We tested the difference using a chi-square statistic, which was statistically significant χ2(1) = 14.10, p < .01 [↩]
- To conduct the coding, two researchers first performed a qualitative analysis. Each researcher read every word to see what categories existed among the words. Then two researchers coded a 20% sample into two categories, negative and positive/neutral, and achieved a reliable coefficient of .95. All 3,890 words were then coded using this strategy. [↩]
- We tested the difference using a chi-square statistic, which was statistically significant, χ2(1) = 30.71, p < .01 [↩]
- The chi-square statistic for Macon was statistically significant, χ2(1) = 6.56, p < .05, and for Fresno χ2(1) = 5.04, p < .05. It was not significant for Kansas City χ2(1) = 2.19, p = .14 [↩]
- We tested the difference using a chi-square statistic, which was statistically significant, χ2(1) = 21.41, p < .01 [↩]
- We tested the difference using a chi-square statistic, which was statistically significant, χ2(2) = 378.08, p < .01. We also ran Bonferroni-corrected pairwise comparisons. There were significant differences across the three partisan categories. [↩]
- We tested the difference using a chi-square statistic, which was statistically significant, χ2(3) = 35.87, p < .01. We also ran Bonferroni-corrected pairwise comparisons, which showed a significant difference between having an MA or more and all other education levels considered (high school degree or less, AA degree, and BA degree). [↩]
- We tested the difference using a chi-square statistic, which was statistically significant, χ2(3) = 23.92, p < .01. We also ran Bonferroni-corrected pairwise comparisons, which showed a significant difference between having less than a high school degree versus those having a BA degree or more. Those with an AA degree were not significantly different from any other groups; 39.4% reported occasionally or frequently needing help. [↩]
- We tested the difference using a chi-square statistic, which was statistically significant, χ2(1) = 14.53, p < .01 [↩]
- We tested the difference using a chi-square statistic, which was statistically significant, χ2(1) = 18.06, p < .01 [↩]
- Public vs. journalists: Accurate, t(2935) = 17.35; Biased, t(2942) = 13.50; Transparent, t(2927) = 9.76; Engaging, t(2918) = 11.63; Fair, t(2924) = 16.21; Trustworthy, t(2931) = 17.19; Credible, t(2933) = 17.06. Sources vs. journalists: Accurate, t(133) = 6.27; Biased, t(133) = 7.86; Transparent, t(133) = 3.16; Engaging, t(133) = 4.84; Fair, t(132) = 7.56; Trustworthy, t(133) = 7.92; Credible, t(133) = 7.39 [↩]
- Public vs. sources: Accurate, t(2894) = 4.18; Biased, t(2901) = 2.83; Transparent, t(2886) = 2.72; Engaging, t(2877) = 1.92; Fair, t(2882) = 3.56; Trustworthy, t(2890) = 4.24; Credible, t(2892) = 4.98 [↩]
- Public vs. journalists: t(3044) = 17.78, public vs. sources: t(3004) = 4.07; journalists vs. sources: t(134) = 9.50 [↩]
- Public vs. journalists: t(3048) = 17.42, public vs. sources: t(3008) = 3.46; journalists vs. sources: t(134) = 8.52 [↩]
- Public vs. journalists: t(3038) = 12.41, public vs. sources: t(2998) = 0.08; journalists vs. sources: t(147) = 6.64 [↩]
- Public vs. journalists: t(3039) = 1.43, public vs. sources: t(2999) = 0.24; journalists vs. sources: t(134) = 0.58 [↩]
- Public vs. journalists: t(3033) = 2.58, public vs. sources: t(2993) = 3.41; journalists vs. sources: t(134) = 3.44 [↩]
- Public vs. journalists: t(3033) = 5.40, public vs. sources: t(2993) = 2.04; journalists vs. sources: t(134) = 1.24 [↩]
- Public vs. journalists: t(3037) = 15.93, public vs. sources: t(2997) = 0.08; journalists vs. sources: t(134) = 8.96 [↩]
- Public vs. journalists: t(3036) = 10.89, public vs. sources: t(2996) = 1.11; journalists vs. sources: t(134) = 5.48 [↩]
- Public vs. journalists: t(3042) = 17.93, public vs. sources: t(3002) = 0.23; journalists vs. sources: t(134) = 9.90 [↩]
- Respondents were asked to rate their news usage on a 1 (not at all) to 5 (more than once a day) scale for their local news organization. The average for reading their local news organization was 3.86, with a standard deviation of 1.08. This score was between 3 (a few times a week) and 4 (once a day). [↩]
- For some of the analyses that we conducted, the sample size is smaller because not all participants answered all of the questions. [↩]