


SUMMARY
The Center for Media Engagement tested whether certain information about a news outlet can affect trust when shown in a Knowledge Panel alongside a Google search. This study included experiments in the U.S., Germany, and Brazil in order to determine how trust signals work across different cultures with varying levels of news trust. The findings suggest the following takeaways:
- Brief descriptions of a news outlet — that clearly articulate the reputation of the news outlet — are powerful signals to people as they judge whether or not to trust a news site. These descriptions should appear when people search for a news outlet.
- People pick up clues about whether to trust — or distrust — a news outlet based on which additional news outlets other visitors have accessed. This information should appear when people search for a news outlet.
- Having an entity in place to independently verify newsrooms’ corrections policies helps people figure out which sources to trust.
- News organizations, especially those in the U.S., should include information about their awards, founding date, and journalists on their websites. The information should also appear when people search for the news outlet.
THE PROBLEM
News audiences worldwide aren’t sure which news outlets to trust.1 The Center for Media Engagement’s research shows that news outlets can build audience trust by adding information next to a print story2 or within a broadcast story3 to explain how and why the story was done, but these efforts do not always work.4 Adding a series of trust elements5 — such as a reporter’s photograph or story labels — also can boost trust, although adding a reporter’s bio4 alone does not work.
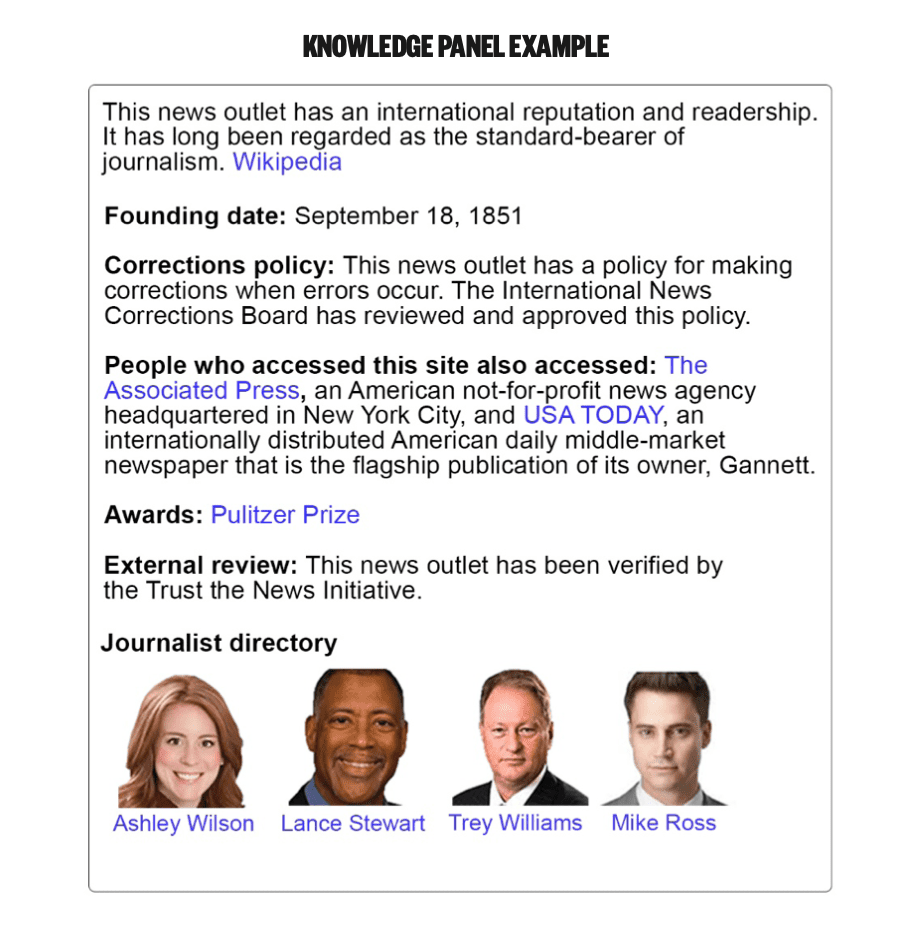
This study examined the problem of news distrust in a new way. We tested whether trust or distrust in a news outlet can be cued at the “domain level” — alongside search information about the news outlet — rather than beside or within a specific story. To do this, we used information about the news outlet — signals — that could be shown in a sidebar called a Knowledge Panel6 when people do a Google search for that news outlet. We conducted one experiment in the U.S. and Germany, and another in the U.S., Germany, and Brazil. We used multiple countries in order to determine how trust signals work across different cultures with varying levels of news trust.7 The Google News Initiative funded this research.
KEY FINDINGS
The following findings stand out:
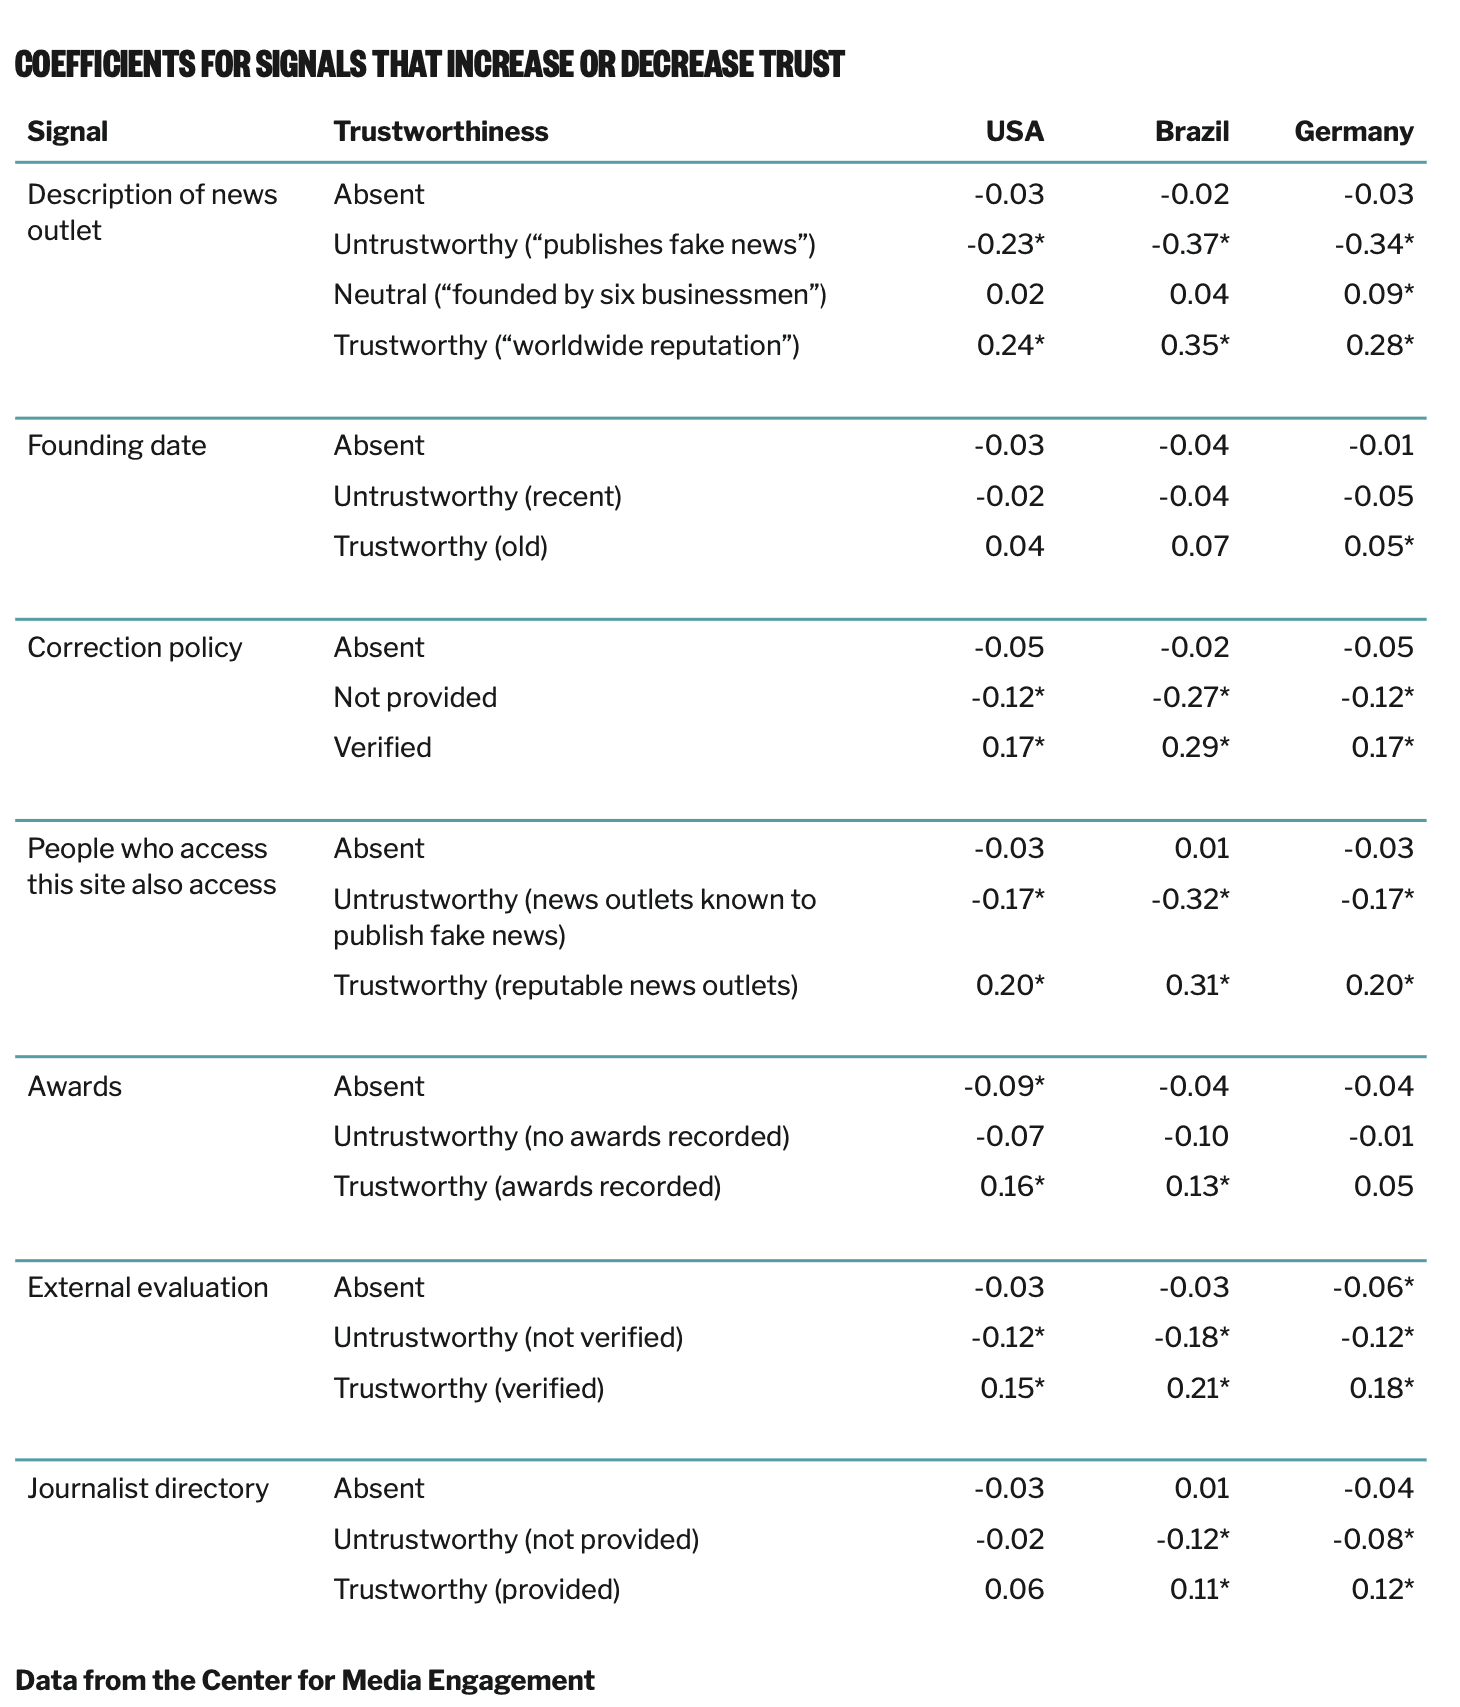
- Of all the trust signals we tested, the description of the news outlet was the most important to people as they assessed whether to trust or distrust a news outlet. If this description noted the news outlet had a “worldwide reputation,” it increased trust more than other signals, but if it noted the site “regularly publishes fake news that has been linked to harassment and conspiracy theories,” it decreased trust more than other signals. If the description was neutral, saying the outlet was “founded by six businessmen,” it slightly increased trust in Germany and had no effect in Brazil and the U.S.
- People made assessments about whether to trust or distrust a news outlet based on the news preferences of others who had visited that news site. People had higher trust in a news outlet if site visitors also accessed reputable news sites. They had low trust in a news outlet if site visitors also accessed outlets that traffic in conspiracy theories.
- Having a corrections policy verified by an independent entity was important to how people made assessments about whether to trust a news outlet. People rated “having a verified corrections policy” as the signal they thought would most increase their trust. When we tested that notion, it was among the top three signals to convey trust.
- The absence of information influenced trust perceptions only in some cases. The absence of information about the news outlets’ awards, founding date, or journalists decreased trust in the U.S., but not in Brazil or Germany. If a verified corrections policy was absent, it signaled distrust more to Germans than to participants in the other countries.
- Participants consistently trusted known news brands more than unknown brands. Showing people trustworthy information about local or national news outlets made them trust those sites more than conspiracy sites, and showing people untrustworthy information about a conspiracy site made them trust it less.
- Trust signals that showed background about the news brands (e.g., when it was founded) and external evaluations (e.g., awards won) had some influence on news trust in Germany, but the results did not replicate in the U.S.8
IMPLICATIONS
Our findings suggest the following takeaways:
- Brief descriptions of a news outlet — that clearly articulate the reputation of the news outlet — are powerful signals to people as they judge whether or not to trust a news site. These descriptions should appear when people search for a news outlet.
- People pick up clues about whether to trust — or distrust — a news outlet based on which additional news outlets other visitors have accessed. This information should appear when people search for a news outlet.
- Having an entity in place to independently verify newsrooms’ corrections policies helps people figure out which sources to trust.
- News organizations, especially those in the U.S., should include information about their awards, founding date, and journalists on their websites. The information should also appear when people search for the news outlet.
FULL FINDINGS
Which Signals Convey Trustworthiness
In order to assess which signals people use to decide whether to trust or distrust a news outlet, we showed participants five different Knowledge Panels created for this project. Participants rated each of the Knowledge Panels they saw for how trustworthy or untrustworthy they perceived that news outlet.9 The Knowledge Panels showed random combinations of signals. Some signals were designed to convey more trust (e.g., having a verified corrections policy). Others were intended to signal less trust (e.g., a news outlet being recently founded) or were neutral or absent. The signals were tailored for each country. The name of the news outlet wasn’t mentioned in the panel so it wouldn’t influence the results. We examined signals in seven categories.10

Participants’ evaluations of the trustworthiness of different versions of Knowledge Panels allowed us to estimate the relative importance of each signal in each country compared to the other signals. Collectively, the relative importance scores total 100 and are interpreted as percentages. We found that:
- In all three countries, the description of the news outlet was the most important category, with relative importance at 20% in Brazil, 21% in the U.S., and 22% in Germany.
- The news preferences of people who accessed the news outlet were slightly more important for Brazilians than for U.S. and German participants, but this remained the second most important category across countries.
- Whether the news outlet had won an award or not was more relevant to Americans than to German and Brazilian participants. Awards were specific to each country.

Across the three countries, the following findings stand out:12
- The description of the news outlet was most important to people as they made assessments about trust or distrust. If the description noted the news outlet had a “worldwide reputation,” it increased trust. If it noted the news outlet “regularly publishes fake news that has been linked to harassment and conspiracy theories,” it diminished trust. If the description was neutral, saying the outlet was “founded by six businessmen,” it slightly increased trust in Germany and had no effect in Brazil and the U.S.
- News preferences of site visitors were an important signal of whether to trust a news outlet. If the outlets were reputable, trust increased in all three countries. If the outlets trafficked in conspiracy theories, trust decreased in all three countries, although this signal was more important in the U.S. and Brazil.
- Having a corrections policy verified by an independent entity was more important to trust assessments in the U.S. and Brazil. If this policy was absent, it signaled distrust more to Germans than to participants in the other countries.

Some trust signals increased trust in Germany, but not in the U.S.
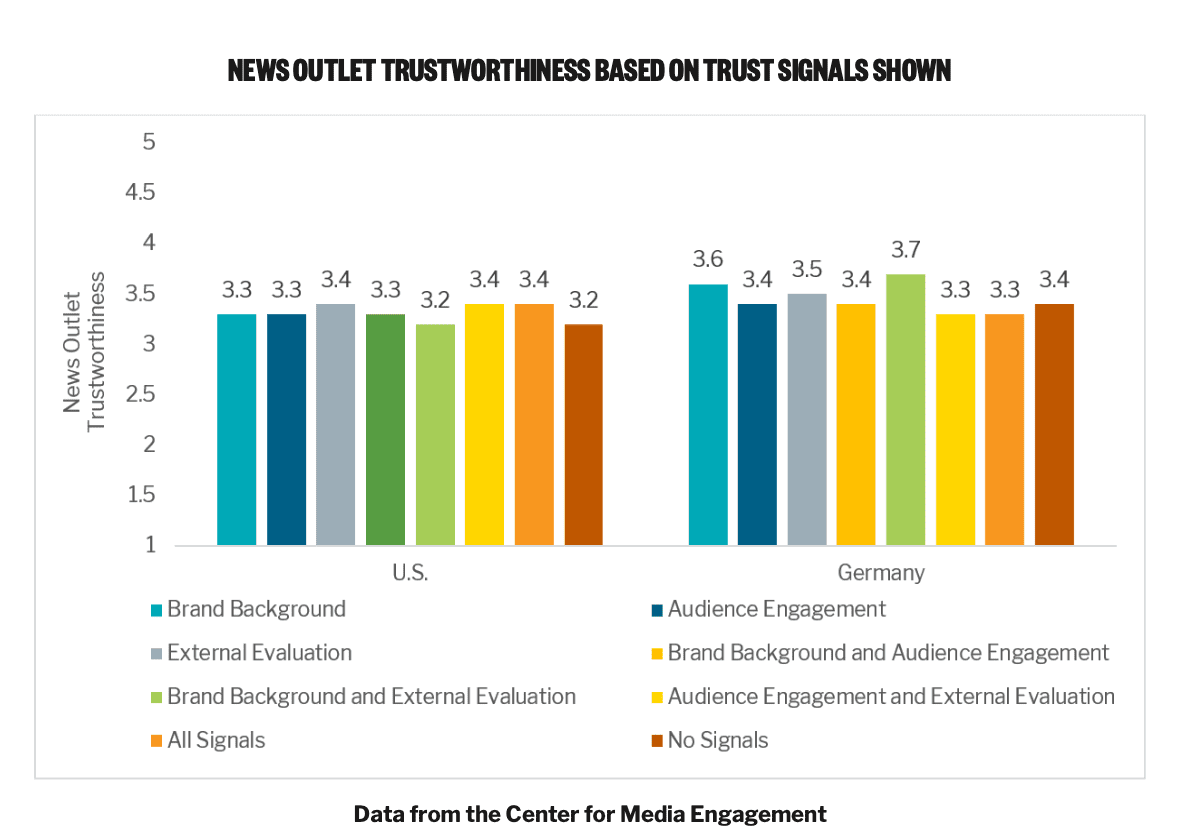
We also examined trust signals by looking at whether certain combinations of signals would be most successful at helping people make assessments of whether to trust or distrust the news outlet. For this part of the project, the Knowledge Panels were interactive — meaning people could click on parts of them and gain more information about different signals (e.g., clicking on the words “ethics policy” would produce a pop-up window with an actual ethics policy).13 We compared only Germany and the U.S. for this part of the research.
We examined three main categories of trust signals in a Knowledge Panel created for the project, either alone or in combination with the other categories. Each was compared to a control condition that only provided the news outlet’s name. This created eight groups in each country. The three categories were:
- Background about the news brand, which included information about ownership and newsroom policies;
- Audience engagement, which focused on contact information for the news outlet and journalists’ bios; and
- External evaluations, which included awards and assessments from independent groups.14
In the United States, news trust was not significantly different regardless of which configuration of the Knowledge Panel people were shown.15 In Germany, news trust was significantly higher when people were shown the configuration with information that provided both background about the news brand and external evaluation, compared to those who were shown the control condition that just displayed the news outlet name.16 This suggests that people may value these signals over the other signals.17

Verified Correction Policies Inspire Trust
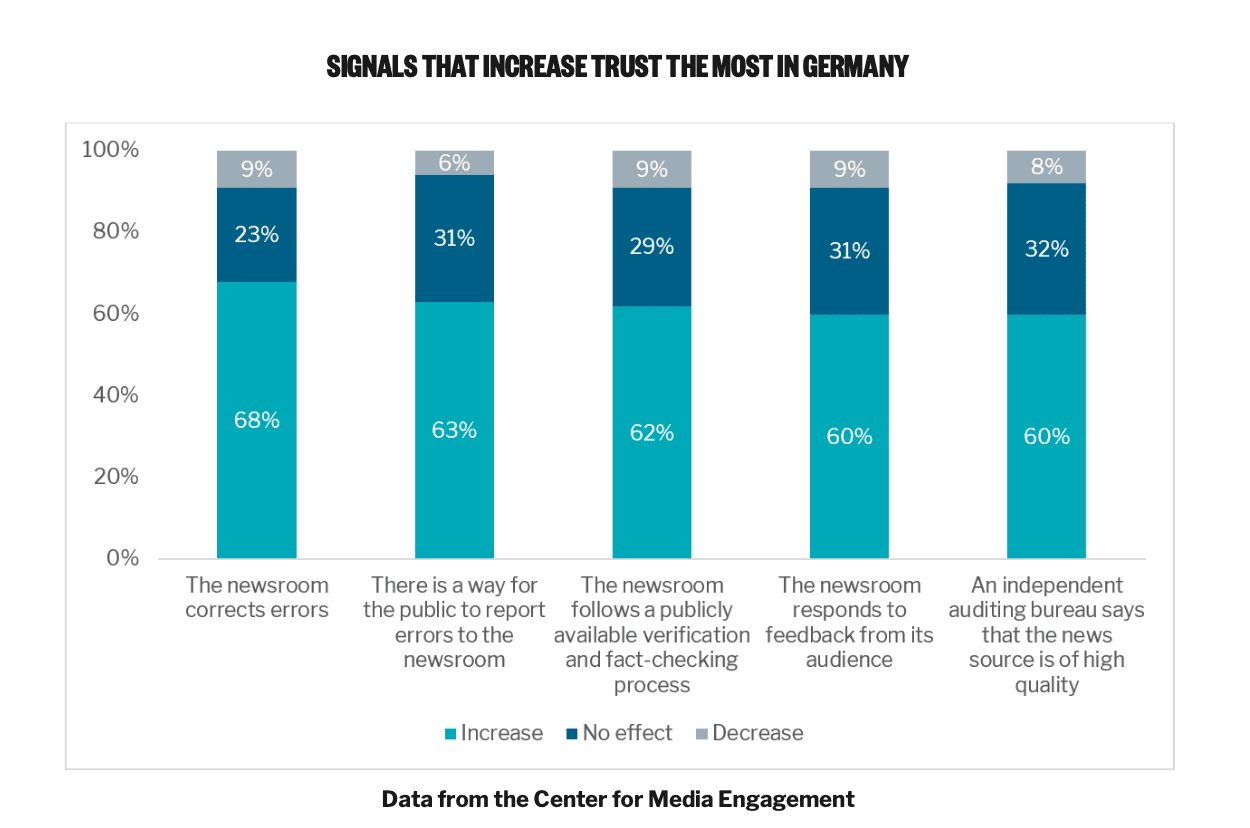
We wanted to know what signals people perceive as helpful as they figure out which news outlets to trust. We presented participants in the U.S. and Germany with 54 possible signals, and they rated whether the signal would increase trust, decrease trust, or have no effect on trust.18 Most signals were intended to inspire trust (e.g., “There is a way for the public to report errors to the newsroom”), while others were intended to inspire less trust (e.g., “The newsroom was founded recently”). The following findings stand out:
- Overall, participants in both countries indicated that signals regarding correction verification helped them make judgments about which news outlets to trust.
- The signal “The newsroom corrects its errors” garnered the highest ratings for increasing trust, compared to the other signals, in both countries.
- The signal “The newsroom has a commitment to holding people in power accountable” was more important to increasing trust in the U.S. than in Germany.
- The signal “An independent auditing bureau says that the news source is of high quality” was more important to increasing trust in Germany than in the U.S.

Trustworthy, known brands increase trust
We also considered the role of known brands in how people assess whether a news outlet is trustworthy or not. We randomly assigned participants in the U.S., Brazil, and Germany to view one of three Knowledge Panels regarding a real news site in their country — either a national news outlet, a local outlet, or a news site known to traffic in conspiracy theories. The national and local sites had Knowledge Panels with all trustworthy signals (e.g., a description that noted it had a “worldwide reputation,” a verified corrections policy, and awards). The Knowledge Panels for the other site had all untrustworthy signals (e.g., a description that noted it is a “fake news website,” no verified corrections policy, and no awards). Participants rated their perceptions of the trustworthiness of all three sites,19 even though they only saw one of the three. The following results stand out across the three countries:
-
People had greater trust for the local or national news outlet, compared to the conspiracy site, if they viewed a Knowledge Panel for either the local or national site.20 Ratings for the national and the local sites were not significantly different from each other.
- People had lower trust for the site known to spread conspiracy theories if they viewed its Knowledge Panel, compared to those who viewed one of the other two Knowledge Panels. All means were significantly different.
We also examined the role of known brands by randomly assigned participants from only Germany and the U.S. to see either a Knowledge Panel for a known news brand for that country, (e.g., USA TODAY in the U.S.) or an unknown brand that was designed to appear as a real site. In both countries, people trusted21 the known news brand more than the unknown news brand, although trust was overall higher in Germany.22

METHODOLOGY
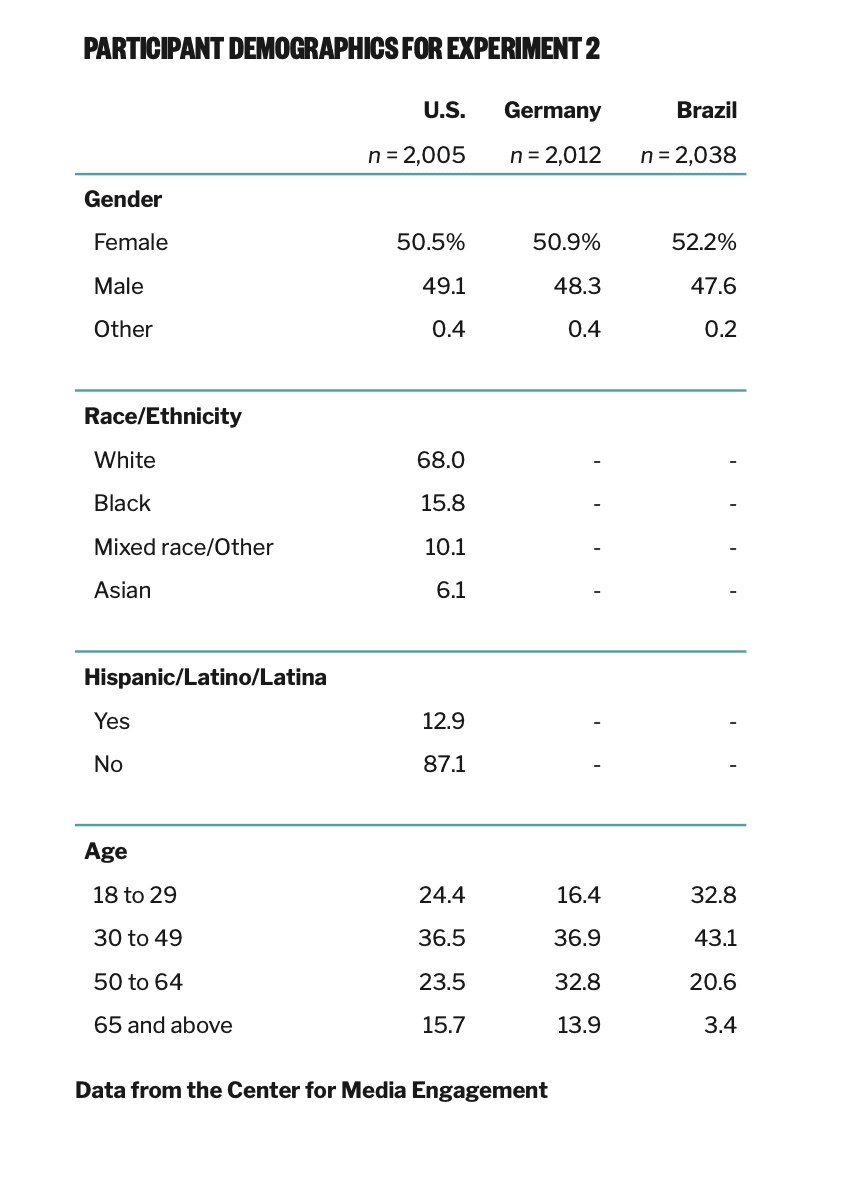
All participants were recruited using the online panel survey firm Dynata to create samples that mirror the demographics of each country.23 Participants had to be at least 18 years or older, reside in the respective countries, and consent to take the survey.24 In the first experiment, 1,037 Americans and 1,000 Germans participated in July and August of 2020.25 For the second experiment, 2,005 Americans, 2,012 Germans, and 2,038 Brazilians participated in November and December of 2020.26
For both experiments, all information in the experiment was provided in the dominant language of that country (English in the U.S., German in Germany, and Portuguese in Brazil). Materials were translated from English by professional translators and research team members fluent in the relevant languages.27
Experiment 1
Participants were randomly assigned to see a Knowledge Panel from either a known news brand or an unknown news brand. In the U.S., the known brand was USA TODAY,28 and the unknown brand was The Gazette-Star, a mock news site. In Germany, the known brand was Süddeutsche Zeitung,29 and the unknown brand was Allgemeines Tagblatt, a mock news site that translates to “general daily newspaper.”
In addition, participants were randomly assigned to be shown one of eight Knowledge Panels that varied which trust signals were shown or if no signals were shown (in the control condition). Three main categories of trust signals were varied — background about the news brand, audience engagement, and external evaluation — and the other conditions were combinations of those signals. After being exposed to the Knowledge Panel, participants answered questions about their perceptions of how much they trusted the news outlet. We also measured how frequently they clicked on the Knowledge Panel to access additional information.

Experiment 2
In Experiment 2, participants in each country were randomly assigned to see five different versions — out of 37 possible versions30 — of a Knowledge Panel for an unknown news brand that had different configurations of either trustworthy, untrustworthy, or absent signals. They also were randomly assigned to view five pairs of Knowledge Panels — out of 20 possible pairs — with different configurations of signals. For each pair, they chose which Knowledge Panel they found more trustworthy.
The way the experiment was designed allowed us to examine which signals were most important to people in shaping their trust perceptions. In this part of the experiment, the Knowledge Panels were shown without the name of the news outlet, so pre-existing attitudes would not influence people’s perceptions. The information was consistent across countries, although details were adapted to be relevant to each country.31 Results showed that the signal explaining the description of the news outlet had the strongest effects in each country, and a verified correction policy and news preferences of other site visitors were also significant indicators.
After participants rated the trustworthiness of the various Knowledge Panels as explained above, they were randomly assigned to view Knowledge Panels for one of three known news brands in their respective countries. These were: a national news outlet, a local news outlet, and a news outlet that disseminates conspiracy theories or false reports. Then they answered questions about the trustworthiness of all three news outlets and their scores were compared. The real news outlets were: USA TODAY, The Virginian-Pilot, and Natural News in the U.S.; Süddeutsche Zeitung, Aachener Zeitung, and Compact-Magazin in Germany; and Folhad S. Paulo, O Dia, and Jornal da Cidade Online in Brazil.32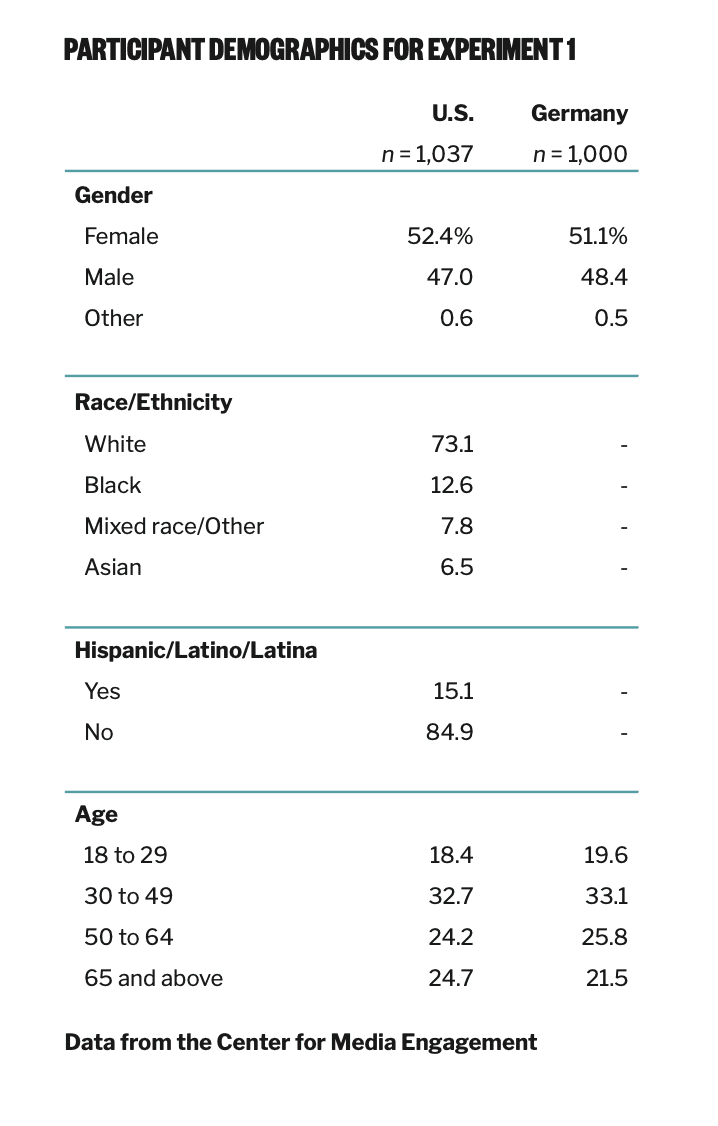
SUGGESTED CITATION:
Lee, Taeyoung, Wilhelm, Claudia, Masullo, Gina M., Riedl, Martin J., Gonçalves, João, and Stroud, Natalie Jomini. (2021, January). How to signal news trust in a Google search. Center for Media Engagement. https://mediaengagement.org/research/how-to-signal-trust-in-a-google-search
- Newman, N., Fletcher, R., Schulz, A., Andı, S., & Nielsen, R. K. (2020). Reuters Institute Digital News Report 2020. https://reutersinstitute.politics.ox.ac.uk/sites/default/files/2020-06/DNR_2020_FINAL.pdf; Mitchell, A., Simmons, K., Matsa, K. E., & Silver, L. (2018, January). Publics globally want unbiased news coverage, but are divided on whether their news media deliver. Pew Research Center. https://www.pewresearch.org/global/2018/01/11/publicsglobally-want-unbiased-news-coverage-but-are-divided-on-whether-their-news-media-deliver/ [↩]
- Chen, G. M., Curry, A., & Whipple, K. (2019, February). Building trust: What works for news organizations. Center for Media Engagement. https://mediaengagement.org/research/building-trust [↩]
- Masullo, G. M., & Tenenboim, O. (2020, June). Gaining trust in TV news. Center for Media Engagement. https:// org/research/trust-in-tv-news [↩]
- Murray, C., & Stroud, N. J. (2020, January). Testing behind the story cards. Center for Media Engagement. https:// org/research/behind-the-story-cards [↩][↩]
- Curry, A., & Stroud, N. J. (2017, December 12). Trust in online news. Center for Media Engagement. https:// org/research/trust-in-online-news/ [↩]
- Information about the Knowledge Panel is obtained from https://support.google.com/knowledgepanel/ answer/9163198?hl=en [↩]
- We included Germany in Experiment 1 because it has higher news trust than the U.S., and a different media and political system. We added Brazil to Experiment 2 because it is similar to the U.S. in having low trust but also has a different political and media system. See Newman et al., 2020. [↩]
- This specific question was not tested in Brazil. [↩]
- There were a total of 37 different Knowledge Panel configurations in each country, and participants were randomly assigned to five of them. For each Knowledge Panel they viewed, participants rated their agreement or disagreement on a 1 (strongly disagree) to 5 (strongly agree) scale for the following statements: “This news site seems like a trustworthy news source,” “I would rely on information from this news site,” and “This news site is a legitimate news source.” Responses for each Knowledge Panel were averaged together into an index. In addition, participants were randomly assigned to view five pairs of Knowledge Panels (out of 20 possible pairs) and pick which of each pair they trusted more. Those results had subtle differences from the ratings results reported here. [↩]
- We reviewed the work of the following organizations to develop a master list of which signals to test: the Credibility Coalition, the Global Disinformation Index, the International Fact-Checking Network, the Journalism Trust Initiative, NewsGuard, the News Quality Initiative, Trusting News, and the Trust Project. We also consulted research in developing this list: Curry, A. L., & Stroud, N. J. (2019). The effects of journalistic transparency on credibility assessments and engagement intentions. Journalism, 1464884919850387. https://doi.org/10.1177/1464884919850387; Karlsson, M. (2010). Rituals of transparency. Journalism Studies, 11(4), 535–545; Karlsson, M. (2011). The immediacy of online news, the visibility of journalistic processes and a restructuring of journalistic authority. Journalism, 12(3), 279–295; Karlsson, M. & Clerwall, C. (2018). Transparency to the rescue? Journalism Studies, 19(13), 1923–1933; Karlsson M., Clerwall, C., & Nord, L. (2014). You ain’t seen nothing yet: Transparency’s (lack of) effect on source and message credibility. Journalism Studies, 15, 668–678; Karlsson M, Clerwall, C. & Nord, L. (2017). Do not stand corrected: Transparency and users’ attitudes to inaccurate news and corrections in online journalism. Journalism & Mass Communication Quarterly, 94(1), 148–167; and Masullo, G.M., Curry, A., Whipple, K.N., & Murray, C. (2021). The story behind the story: Examining transparency about the journalistic process and news outlet credibility. Journalism Practice, Online First Advance Publication. https://doi.org/10.1080/17512786.2020.1870529. We asked experts in news trust to help us prioritize which signals to include in our study: Sally Lehrman, of the Trust Project, Joy Mayer, of Trusting News, Connie Moon Sehat, of the News Quality Initiative, and Olaf Steenfadt, of the Journalism Trust Initiative. We are grateful to them for their help. For Experiment 2, we focused on seven signals based on the results of Experiment 1 in the U.S. and Germany. [↩]
- The relative importance was calculated based on the range values of scores on trustworthiness — called “part-worths estimates” — for each category. Part-worths estimates can be interpreted similarly to regression coefficients. [↩]
- We rescaled values to make them comparable across trust categories and between countries. In the German version, even the neutral description (“founded by six businessmen”) had a strong positive effect on trustworthiness ratings. [↩]
- Simon Xie and Luke Hartman created interactive Knowledge Panels that participants could click on for Experiment 1. Information for the Knowledge Panels was drawn from USA TODAY and a composite of other real sites and then adapted for the German experiment. [↩]
- These signals were identified following the same procedure as explained in endnote 11. [↩]
- This was tested using a multi-factorial ANOVA with type of brand (known versus unknown) and Knowledge Panel configuration (one of eight) as between-subjects’ factors. In the U.S., results showed no significant effect of Knowledge Panel configuration on trust perceptions, F (7, 1021) = 1.03, p = .41, η2 = 0.01. [↩]
- This was tested using a multi-factorial ANOVA with type of brand (known versus unknown) and Knowledge Panel configuration (one of eight) as between-subjects’ factors. For the German sample, results showed a significant main effect of Knowledge Panel configuration on trust perceptions, F (1, 984) = 2.50, p = .02, η2 = 0.02. Planned comparisons using Fisher’s least square difference (LSD) test showed participants had significantly higher trust when exposed to the Knowledge Panel configuration that showed both background about the brand and external evaluations (M = 3.6, SE = 0.07) compared with the control condition (M = 3.4, SE = 0.07, p = .01). No other significant differences were found. [↩]
- We also tested which configuration of trust signals people were more likely to click on, but few people clicked on any Knowledge Panel and results were not consistent. In both the U.S. and Germany, participants clicked the most on Knowledge Panel configurations that showed either audience engagement trust signals — such as news outlet contact information — or background about the brand trust signals — such as ownership and founding date. This suggests they may privilege background about the brand and audience engagement information over external evaluation or a mix of signals. In Germany, three configurations of trust signals drew significantly more clicks than the external evaluation configuration. These were audience engagement, brand background, and the configuration with both of these signals together. In the U.S., no significant differences emerged in clicks based on the trust signals shown. These were tested using multi-factorial ANOVAs with type of brand (known versus unknown) and Knowledge Panel configuration (one of eight) as between-subjects’ factors. In the U.S., results showed Knowledge Panel configuration had a significant main effect on click frequency, F (7, 1021) = 4.51, p < .001, η2 = 0.03. However, pairwise comparisons with a Sidak post hoc correction showed no significant differences in clicks for any of the configurations. In Germany, results showed Knowledge Panel configuration had a significant main effect on click frequency, F (7, 984) = 5.96, p < .001, η2 = 0.04. Pairwise comparisons with a Sidak post hoc correction showed the audience engagement configuration (M = 0.17, SE = 0.03) elicited significantly more clicks than external evaluation (M = 0.00, SE = 0.03, p < .001), and the brand background configuration (M = 0.14, SE = 0.03) received significantly more clicks than external evaluation (p = .01). The configuration with both audience engagement and brand background also elicited significantly more clicks than external evaluation (p = .01). Significant differences compared to the control are not noted because the control condition had nothing clickable. [↩]
- The signals were compiled using the same process we explain in endnote 11. The question wording after each signal was: “Please indicate whether it would (a) increase your trust in a news organization, (b) decrease your trust in a news organization, or (c) wouldn’t have any effect on your trust in a news organization.” Participants were presented with a random selection of half (27) of the signals. [↩]
- On a 1 (strongly disagree) to 5 (strongly agree) scale, participants rated how much they agreed or disagreed with three statements regarding each of the three news outlets. The statements were: “(News site) seems like a trustworthy news source,” “I would rely on information from (news site),” and “(News site) is a legitimate news source.” In each case, the words “news site” were replaced with the name of the news outlet. The three statements were averaged together into indices for each news site in each country, all with high reliability: National news site, MUS = 3.54, SDUS = 1.11, Cronbach’s αUS = 0.91; MGer = 3.66, SDGer = 1.01, Cronbach’s αGer = 0.92; MBra = 3.76, SDBra = 1.23, Cronbach’s αBra = 0.94. Local news site, MUS = 3.12, SDUS = 1.15, Cronbach’s αUS = 0.91; MGer = 2.95, SDGer = 1.17, Cronbach’s αGer = 0.92; MBra = 2.88, SDBra = 1.32, Cronbach’s αBra = 0.95. [↩]
- This was tested using three one-way ANOVAs in each country with the type of Knowledge Panel people were exposed to as the independent variable (national news outlet, local news outlet, or outlet known to spread conspiracy theories). For the U.S., results showed a significant main effect on ratings for the national news outlet, F (2, 1996) = 4.54, p = .01, η2 = 0.01, on ratings for the local news outlet, F (2, 1993) = 110.88, p < .001, η2 = 0.10, and on ratings for the conspiracy site, F (2, 1995) = 44.29, p < .001, η2 = 0.04. For Brazil, results showed a significant main effect on ratings for the national news outlet, F (2, 2008) = 9.75, p < .001, η2 = 0.01, on ratings for the local news outlet, F (2, 2004) = 55.72, p < .001, η2 = 0.05, and on ratings for the conspiracy site, F (2, 2004) = 97.69, p < .001, η2 = 0.09. For Germany, results showed a significant main effect on ratings for the national news outlet, F (2, 1911) = 10.84, p < .001, η2 = 0.01, on ratings for the local news outlet, F (2, 1912) = 72.34, p < .001, η2 = 0.07, and on ratings for the conspiracy site, F (2, 2004) = 44.01, p < .001, η2 = 0.04. In all three countries, means were always significantly lower for the conspiracy site for those exposed to that Knowledge Panel compared to those exposed to the other sites. However, ratings for the national news outlet were not significantly different between those exposed to the national site and those exposed to the local site. [↩]
- News outlet trust perceptions were measured using 16 items averaged together, adapted from Strömbäck, J., Tsfati, Y., Boomgaarden, H., Damstra, A., Lindgren, E., Vliegenthart, R., & Lindholm, T. (2020). News media trust and its impact on media use: toward a framework for future research. Annals of the International Communication Association, 44(2), 139-156. https://doi.org/10.1080/23808985.2020.1755338. On a 1 (strongly disagree) to 5 (strongly agree) scale, subjects rated their agreement or disagreement with the following: “(News site) seems like a trustworthy news source,” “I would rely on information from (news site),” “(News site) cares about its audience,” “(News site) is a legitimate news source,” “(News site) values feedback from its readers,” “(News site) is a respected news source,” “(News site) is fair when covering the news,” “(News site) is unbiased when covering the news,” “(News site) tells the whole story when covering the news,” “(News site) is accurate when covering the news,” and “(News site) separates facts from opinions when covering the news.” On a 1 (very unlikely) to 5 (very likely) scale, participants also rated how likely or unlikely they would be to “Seek out news from (News site),” “Read a story from (News site),” “Share an article from (News site),” “Click on an article from (News site) that appeared in a Google Search result,” or “Recommend news from (News site) to others.” In each case, the words “news site” were replaced with the name of the news outlet to which the participant was exposed. A principal component analysis (PCA) with promax rotation suggested these items loaded on one factor in both the U.S. and Germany. Items were averaged into indices for each country, both with high reliability (Mus= 3.33, SDus = 0.91, Cronbach’s αus = 0.96; MGer= 3.46, SDGer = 0.77, Cronbach’s αGer = 0.94). [↩]
- This was tested with two multi-factorial ANOVAs with type of brand (known versus unknown) and Knowledge Panel configuration (one of eight) as between-subjects’ factors. For both the U.S. sample F (1, 1021) = 10.05, p = .002, η2 = 0.01, and the German sample, F (1, 984) = 30.45, p < .001, η2 = 0.03, results also showed main effects of exposure to a known brand on trust perceptions. [↩]
- For the U.S. samples, Dynata matched demographics of the U.S. adult internet population based on a random sample survey conducted by Pew Research Center. For the German and Brazilian samples, Dynata matched the age and gender of the sample to the adult population in the respective country. [↩]
- The Institutional Review Board at The University of Texas at Austin approved both projects. [↩]
- What follows are details of recruitment for Experiment 1: A total of 1,759 Americans were recruited, but data was removed for those who could not see the stimuli (n = 339), who failed two attention checks (n = 142), who did not consent (n = 142), who did not reside in the U.S. (n = 42), who were not at least 18 years old (n = 36), who used the Internet Explorer browser despite being advised it was unsuitable for the project (n = 11), or who appeared to attempt to participate more than once (n = 10). That resulted in n = 1,037. A total of 1,482 Germans were recruited, data were removed for those who could not see the stimuli (n = 244), who failed two attention checks (n = 142), who did not consent (n = 53), who were not at least 18 years old (n = 18), who used the Internet Explorer browser despite being advised it was unsuitable for the project (n = 12), who appeared to attempt to participate more than once (n = 8), or who did not reside in Germany (n = 5). That resulted in n = 1,000. [↩]
- What follows are details about recruitment for Experiment 2: A total of 2,268 Americans were recruited, but data were removed for those who did not consent (n = 164), who did not reside in the U.S. (n = 28), who were not at least 18 years old (n = 52), or who appeared to attempt to participate more than once (n = 19). That resulted in n = 2,005. A total of 2,155 Germans were recruited, but data were removed for those who did not consent (n = 58), who did not reside in Germany. (n = 12), who were not at least 18 years old (n = 27), or who appeared to attempt to participate more than once (n = 46). That resulted in n = 2,012. A total of 2,318 Brazilians were recruited, but data were removed for those who did not consent (n = 38), who did not reside in Brazil. (n =15), who were not at least 18 years old (n = 153), or who appeared to attempt to participate more than once (n = 74). That resulted in n = 2,038. [↩]
- We thank Rosenthal C. Alves, Carmem Meira Cunha, and Rachel R. Mourão for reviewing the Brazilian stimuli. [↩]
- USA TODAY was selected because it is among news sites trusted across the ideological spectrum. See Mitchell, A., Gottfried, J., Kiley, J., & Matsa, K.E. (2014, October 21). Political polarization and media habits. Pew Research Center. https://www.journalism.org/2014/10/21/political-polarization-media-habits/; Jurkowitz, M., Mitchell, A., Shearer, E., & Walker, M. (2020, January 24). U.S. media polarization and the 2020 election: A nation divided. Pew Research Center. https://www.journalism.org/2020/01/24/u-s-media-polarization-and-the-2020-election-a-nation-divided/. [↩]
- We are grateful to German scholars Marc Ziegele, Teresa K. Naab, and Pablo Jost who advised us on selecting the German news outlet for Experiment 1. We selected it because it is perceived as a quality publication that is ideologically central. See Magin, M., & Stark, B. (2010). Mediale Geschlechterstereotype: Eine ländervergleichende Untersuchung von Tageszeitungen (Gender stereotypes in the mass media: A comparative study of newspapers) and; Publizistik, 55(4), 383–404; Engesser, S., Esser, F., Reinemann, C., Scherr, S., Matthes, J., & Wonneberger, A. (2014). Negativität in der Politikberichterstattung: Deutschland, Österreich und die Schweiz im Vergleich (Negativity in political coverage: Germany, Austria and Switzerland in comparison). M&K, 62(4), 588–605. [↩]
- We employed a conjoint experimental design for Experiment 2 so we could estimate the causal effects of multiple treatment components simultaneously. See Hainmueller, J., Hopkins, D. J., & Yamamoto, T. (2014). Causal inference in conjoint analysis: Understanding multidimensional choices via stated preference experiments. Political Analysis, 22(1), 1–30. https://doi.org/10.1093/pan/mpt024. The fractional factorial design was created using the orthoplanprocedure in SPSS following the traditional conjoint approach where respondents have to rate or rank a series of profiles displaying systematic variations of treatment components. Data were analyzed using the conjoint-procedure in SPSS (OLS regression), in which the seven knowledge panel attributes (e.g., founding date, description of news outlet, awards) were entered as independent variables and trustworthiness ratings as dependent variable. Goodnessof-Fit was assessed by Pearson’s correlation coefficients between observed and estimated preference ratings (U.S., r = .95, p < .001; Brazil, r = .96, p < .001; Germany, r = .97, p < .001) [↩]
- For example, the names of awards and the founding dates varied in the countries to be applicable to that country. Real news outlets from each country were named as news preferences for site visitors, and the journalists’ pictures and names that were shown were typical of that country. [↩]
- News sites were picked to be typical of each country. [↩]