

The Center for Media Engagement tested two approaches to helping newsrooms build trust with audiences:
- Showing the audience how journalists approached a story by adding an “explain your process” box to news stories
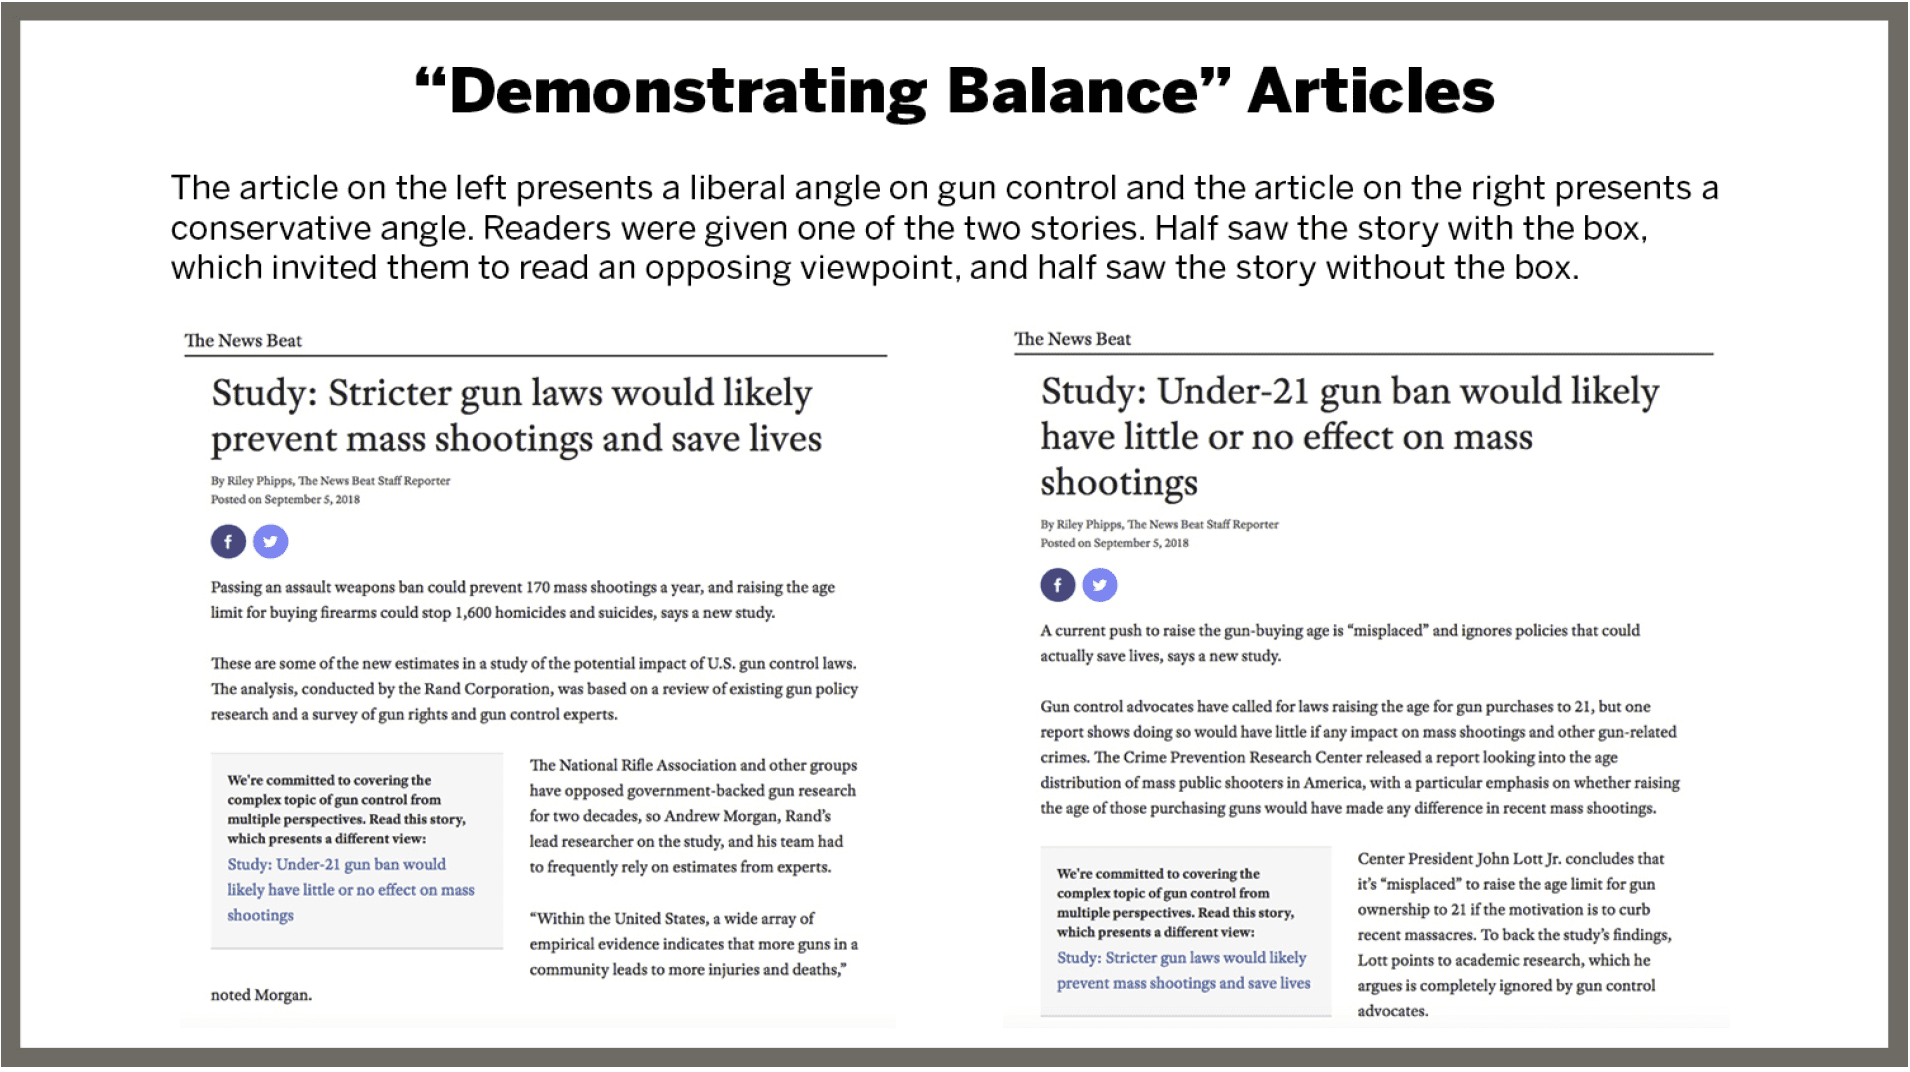
- Showing the audience a commitment to balanced coverage of partisan topics by adding a “demonstrating balance” box to news stories
The results of the experiment suggest that newsrooms could benefit from adding an “explain your process” box to stories. We found that:
- Adding a box that explains the story process improves perceptions of a news organization
- Adding an “explain your process” box is quick and easy for newsrooms to implement
The findings were inconclusive for adding a “demonstrating balance” box that points readers to an article with an opposing viewpoint.
The Problem
Amid the frequent cries of “fake news” and lagging trust in journalism, how can news organizations gain audience trust? The Center for Media Engagement teamed up with Joy Mayer of Trusting News and two newsroom partners, USA TODAY and the Tennessean, to test two approaches to building trust:
- Showing the audience how journalists approached the story. We added an “explain your process” box to a news story that explained why and how the story was covered. This was tested using two experiments with 1,312 total participants.
-
Demonstrating balanced coverage of partisan topics. We added a “demonstrating balance” box that directed readers of a partisan political news story to another story that offered an opposing partisan focus. This was tested using two experiments with 1,233 people.
Key Findings
Adding the “explain your process” box improved how people perceived the news organization. We suggest that news organizations consider adding the box to news stories.
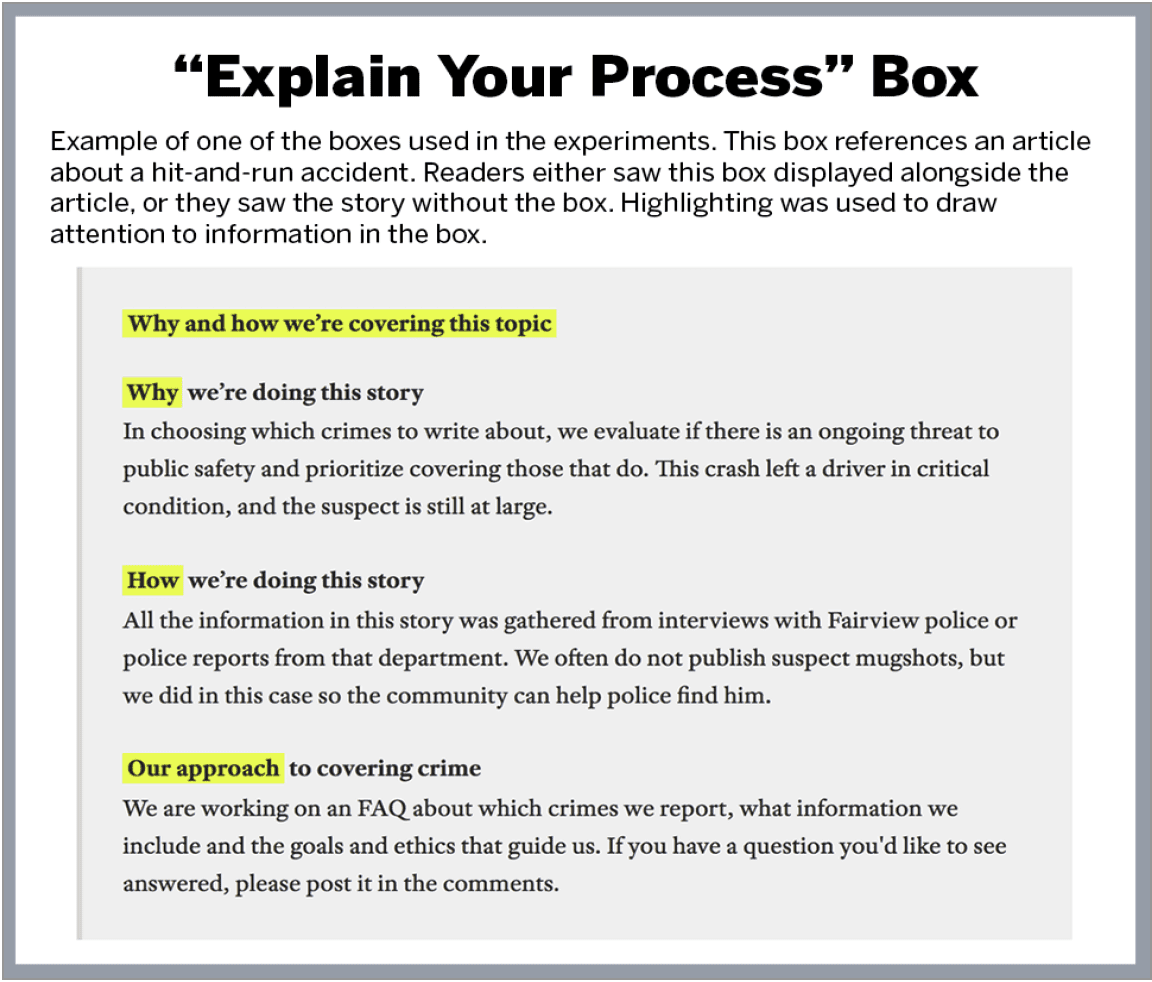
- Using a mock news site, people who viewed a news article with the box perceived the news organization as significantly more reliable, compared to people who saw the same story without the box.
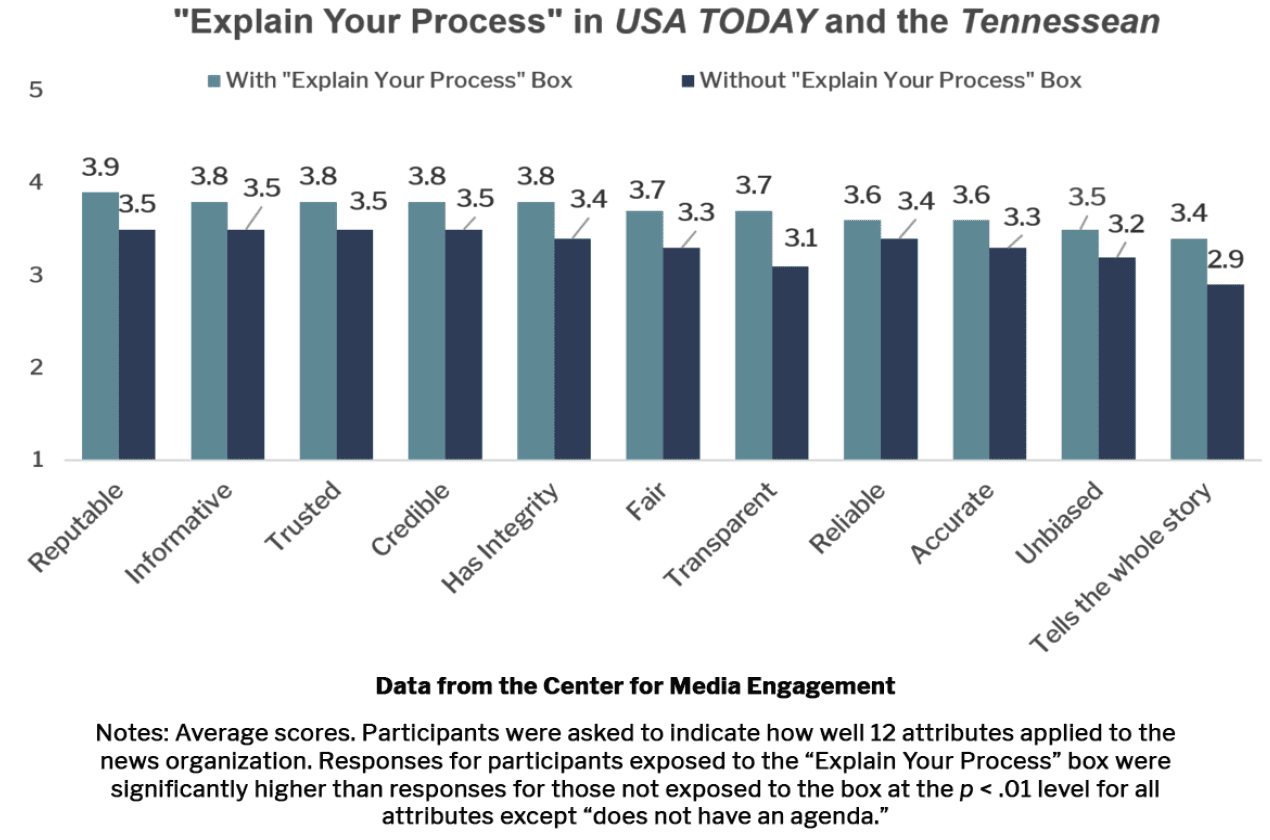
- Using stories from USA TODAY and the Tennessean, people who viewed an article with the box rated USA TODAY and the Tennessean significantly higher on 11 of the 12 attributes of trust compared to people who saw the same story without the box. These attributes include being more transparent, informative, accurate, fair, credible, unbiased, and reputable.1 Only does not have an agenda was not significantly higher.
The “demonstrating balance” box slightly improved how people perceived the news organization.
- Participants who saw a story with the “demonstrating balance” box rated the news site significantly higher on two attributes: fair and does not have an agenda.
- Further statistical analyses showed that the effects were too small for us to suggest that news organizations will benefit from adding a “demonstrating balance” box to news stories.
Implications for Newsrooms
Our experiments tested several strategies for building trust in news. The results suggest that news organizations should consider using the “explain your process” box. It is relatively easy to put this box together using information from the reporters’ news-gathering process and can improve items that relate to trust, which was shown particularly in the experiment involving USA TODAY and the Tennessean.
We cannot recommend using the “demonstrating balance” box at this point because our findings were inconclusive.
Small steps taken by news organizations can have an influence on building trust with audiences, even if every approach does not work. We encourage news organizations to continue experimenting.
The Study
Explain Your Journalistic Process
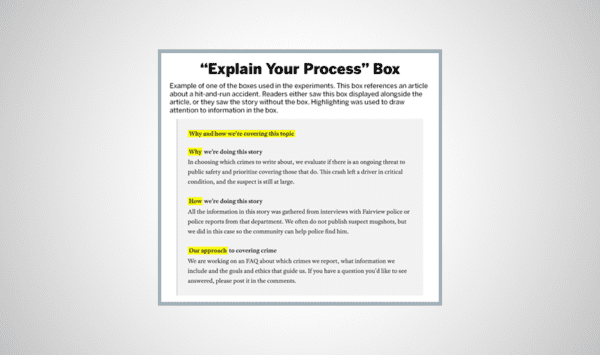
The goal of the “explain your process” experiments was to find out whether providing a short, explanatory text box at the bottom of a news story would help the audience understand the process of journalism better and – as a result – boost their trust in the news organization.2 The box included how and why the news organization decided to pursue the story and where reporters gathered information. We tested the “explain your process” box in two separate experiments – first with a mock news site and then with real local and national news sites.
Test with The News Beat
In the first experiment, articles were published on a mock news site, The News Beat. We used two different stories – one about a hit-and-run car crash and one about mass shootings in the United States – to test if the box worked the same across topics. The stories came from real news sites and were adapted for the experiment.
The 753 participants were randomly assigned to read one of the two stories.3 Half the participants saw a story with the “explain your process” box and half saw a version without it. After seeing the story, participants were asked to share their opinions about The News Beat and rate our mock news organization on a series of 12 items related to trust. These 12 items were used in all the experiments and included ratings of the news organization’s transparency, credibility, accuracy, and fairness, along with other items.4
We found that the presence of the “explain your process” box boosted ratings on one item, reliability of the news organization.5
Test with USA TODAY and the Tennessean
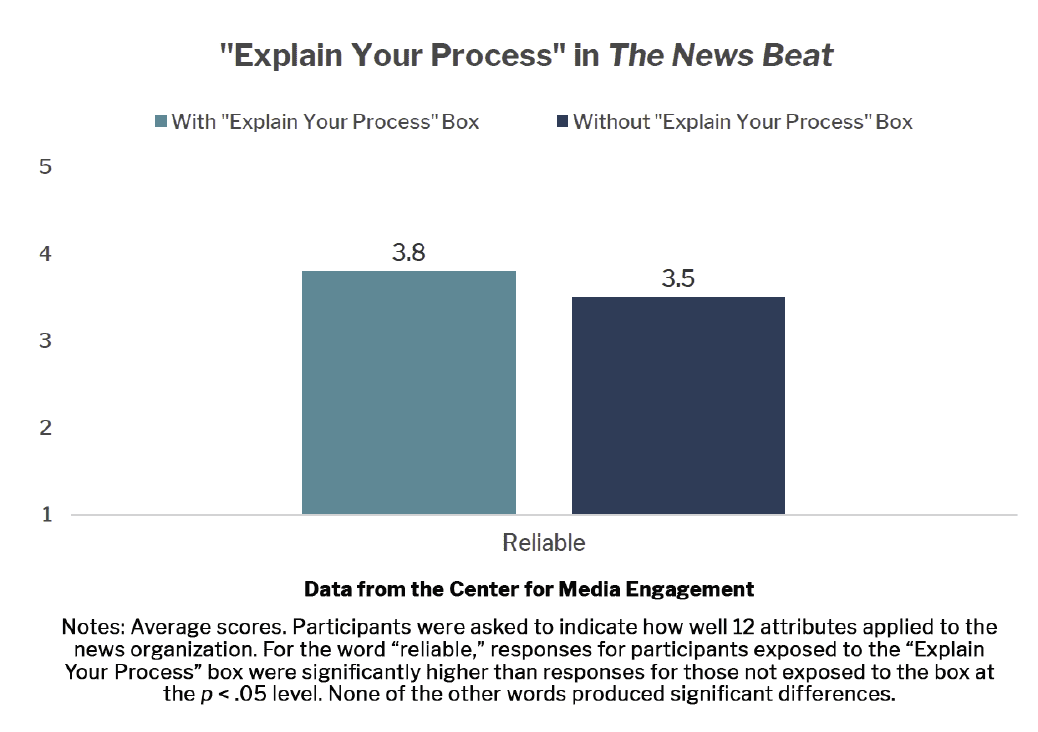
We conducted a second experiment to see if the “explain your process” box would work in a real-world situation. Unlike the previous experiment in which articles appeared on The News Beat webpage, the articles in this experiment appeared on what looked like USA TODAY or Tennessean webpages.6
The two news outlets, both part of the Gannett chain, provided us with examples of real stories from their sites. The USA TODAY story focused on Amazon’s efforts to find a new headquarters, and the Tennessean story was about a viral Facebook post that gave a mistaken impression that a veteran had been declined medical care. The news organizations then distributed a link to the experiment to their audiences. Participants were again randomly assigned to read either a story with the “explain your process” box or without it.7 They rated the news organizations in the same way as in the first experiment. A total of 559 people participated.8
Results showed that the presence of the “explain your process” box boosted people’s perceptions of the news organization on 11 of the 12 items related to trust. These were: transparent, informative, accurate, fair, tells the whole story, reliable, credible, unbiased, trusted, has integrity, and reputable.9
We conducted additional analyses to test whether these results differed based on several factors, including study participants’ pre-existing trust in online news, political ideology, or whether or not they saw an article from USA TODAY or the Tennessean. In no instance did we find differences in the effects of the “explain your process” box based on these factors.10
Demonstrating Balance in News Coverage
Most Americans want news from both sides of the political spectrum.11 So, we tested how people would respond to a news organization that covered a topic from two different viewpoints. Study participants either saw a story that focused on research suggesting gun control is needed to prevent mass shootings or a story that focused on studies suggesting approaches other than gun control have greater merit in preventing mass shootings. Half the participants saw a story that included a “demonstrating balance” box, which linked to the story expressing the opposite viewpoint.
We tested the “demonstrating balance” box using two separate experiments. In both experiments, we used our mock website, The News Beat.
Our first experiment had 791 participants and used the same 12 items (e.g., transparent, credible, informative, etc.) mentioned earlier to evaluate participants’ opinions about The News Beat.12 Participants perceived the news organization identically on all 12 items regardless of whether they saw the “demonstrating balance” box or not.13 There are a number of possible explanations for this finding, including that a box like the one we tested is not an effective method for demonstrating balanced news coverage in an online news site. Another possible explanation could be that the box needed to be more prominent. Nearly half the participants who were exposed to the “demonstrating balance” box did not remember seeing it.
In spite of the lack of significant findings from the first “demonstrating balance” experiment, we felt the idea warranted one more test using a different online survey vendor. This test showed that our new group of 442 participants14 who saw the box rated the news organization significantly higher on fairness and does not have an agenda.15 Further statistical tests showed that results for fairness did not hold up when we did not take into account other factors, such as participants’ political ideology or pre-existing trust in online news.16
Methodology
This project was led by the Center for Media Engagement and Joy Mayer of Trusting News. Trusting News is a project of the Reynolds Journalism Institute and the American Press Institute. It is staffed by Mayer and Lynn Walsh. All four experiments were embedded in Qualtrics-based surveys. Participants were recruited in different ways for each study. Participants for the first “explain your process” experiment were recruited via a Qualtrics panel. For the experiment involving USA TODAY and the Tennessean, the news organizations recruited participants in various ways, including through social media and newsletters they send out to their audience members. For the two “demonstrating balance” experiments, participants were recruited via Research Now SSI for the first experiment17 and via Amazon’s Mechanical Turk for the second experiment.
Qualtrics panels and Research Now SSI were used to create samples that matched the demographics of U.S. Internet users taken from a nationally representative, random sample survey conducted by Pew Research Center. Amazon Mechanical Turk also yielded a sample that was relatively close to our Pew demographic targets. Finally, although the sample recruited through USA TODAY and the Tennessean does not reflect the U.S. Internet demographics, it represents the audiences of both sites, particularly those engaged enough to respond to a survey.
All surveys and survey procedures were nearly identical across the studies. After participants answered screening questions to verify their age and U.S. residency, they were asked questions about their education, income, gender, and race. Following these questions, each person was randomly assigned to one of the experimental conditions. In the “explain your process” experiments, participants saw an article either with or without the “explain your process” box. In the “demonstrating balance” experiments, people saw an article with or without the “demonstrating balance” box. Participants were asked to read the news article and browse the page as they would normally do on a news site. After leaving the article page, participants were presented with a series of identical questions aimed at gauging their opinions about the news organization that published the article.

SUGGESTED CITATION:
Chen, Gina Masullo, Curry, Alex, and Whipple, Kelsey. (2019, February). Building trust: What works for news organizations. Center for Media Engagement. https://mediaengagement.org/research/building-trust
- These results were evident regardless of a person’s political ideology, pre-existing trust in online news, or which site the article appeared on (USA TODAY or the Tennessean). [↩]
- In both experiments, the “explain your process” box was placed at the bottom of the webpage, below the article text. The survey was designed so that every participant randomly chosen to see an article with an “explain your process” box had to scroll past the box before being able to continue with the survey. [↩]
- A total of 1,031 people completed this experiment, but some responses were not used in our analysis. The survey was intended for adults living in the United States, so those who did not meet age or residency requirements were removed (n = 39). Others were removed because they were unable to view the article page (n = 48), participated in the experiment more than once (n = 11), answered in a way that indicated they were not reading the questions carefully (n = 9), or left responses to open-ended questions that did not make sense (e.g., “uyuytutuyu”; n = 138). In addition, after the experiment, we asked participants to identify the topic of the article they had just read, and those who failed to do so correctly (n = 33) were not included in the final analysis, leaving us with data from 753 participants. [↩]
- Participants rated the 12 items on a 1-to-5 semantic differential scale adapted from Gaziano, C., & McGrath, K. (1986). Measuring the concept of credibility. Journalism Quarterly, 63(3), 451-462; Johnson, T. J., & Kaye, B. K. (2004). Wag the blog: How reliance on traditional media and the Internet influence credibility perceptions of weblogs among blog users. Journalism & Mass Communication Quarterly, 81(3), 622-642; Kiousis, S. (2003). Job approval and favorability: The impact of media attention to the Monica Lewinsky scandal on public opinion of President Bill Clinton. Mass Communication and Society, 6(4), 435. The anchors were: transparent/not transparent, informative/not informative, accurate/not accurate, not credible/credible, biased/not biased, fair/not fair, cannot be trust/can be trusted, tells the whole story/does not tell the whole story, does not have integrity/has integrity, reliable/unreliable, does not have an agenda/has an agenda, not reputable/reputable. [↩]
- These were tested using a series of ANOVAs, one for each of the 12 trust items. Each model tested a main effect of the “explain your process box,” pre-existing trust in online news, political ideology, and the article topic (hit-and-run or mass shootings). Also tested were interaction effects between the “explain your process” box and pre-existing trust in online, political ideology, and topic, as well as between pre-existing trust in online news and topic. The only one of the 12 trust items that produced a significant main effect was reliable, F (1, 741) = 8.9, p =.003, η2 = .01. [↩]
- The USA TODAY and Tennessean webpages used in this study were not actual sites from these news outlets, but sites created to look identical to the real sites. The reason for not using the actual sites was to be able to control what information appeared on the sites, which would not be possible had we used an actual news organization webpage. For example, using an actual page would not have given us control over the ad content that participants saw. [↩]
- When following the link to participate in our experiment, USA TODAY readers saw the article from USA TODAY, while Tennessean readers saw the article from the Tennessean. [↩]
- A total of 731 people began this survey (225 via USA TODAY and 506 via the Tennessean), but some responses were not used in our analysis. As in the previous study, the survey was intended for adults living in the United States, so those who did not meet age or residency requirements were removed (n = 7). Others were removed because they were unable to view the article page (n = 20), took the survey more than once (n = 41), answered in a way that indicated they were not reading the questions carefully (n = 4), or did not finish the survey (n = 97). In addition, after the experiment, we asked participants to identify the topic of the article they had just read, and those who failed to do so correctly (n = 3) were not included in the final analysis, leaving us with data from 559 participants. [↩]
- These were tested using a series of ANOVAs, one for each trust item. Main effects were tested for the “explain your process” box, pre-existing trust in online news, political ideology, and which site the article appeared on (USA TODAY or the Tennessean). Results show statistically significant differences between ratings on 11 of the 12 items, with higher means at p < .01 for those exposed to the “explain your process” box compared to those not exposed to the box. Only does not have an agenda did not produce a significant main effect. [↩]
- To assess whether other factors were influencing the trust items, we tested interactions in the ANOVAs for each of the 12 items. Interactions were tested between the “explain your process” box and pre-existing trust in online news, political ideology, and news organization, as well as between pre-existing trust in online news and news organization. None of the interactions produced significant effects. [↩]
- A 2018 Gallup report indicated that “60% of Americans say it is a major problem to choose news sources that solely reflect one’s point of view.” See https://news.gallup.com/opinion/gallup/226472/sides-aisle-agree-media-problem.aspx. [↩]
- A total of 900 people completed this survey, but not all responses were used in our analysis. Participants were removed because they took the survey more than once (n = 1), answered in a way that indicated they were not reading the questions carefully (n = 10), or left nonsensical responses to open-ended questions (e.g., “dtvybunjimk”; n = 45). In addition, after the experiment, we asked participants to identify the topic of the article they had just read, and those who failed to do so correctly (n = 53) were not included in the final analysis, leaving us with data from 791 participants. [↩]
- These were tested using a series of ANOVAs, one for each of the 12 trust items. Main effects were tested for the “demonstrating balance” box, pre-existing trust in online news, political ideology, and whether the initial story the participant read was left- or right-leaning. No significant main effects were found. [↩]
- A total of 499 people completed this survey, but not all responses were used in our analysis. Participants were removed because they were unable to view the article page (n = 11), took the survey more than once (n = 19), or left nonsensical responses to open-ended questions (e.g., “good”; n = 8). In addition, after the experiment, we asked participants to identify the topic of the article they had just read, and those who failed to do so correctly (n = 19) were not included in the final analysis, leaving us with data from 442 participants. [↩]
- Regression analyses showed that, in the presence of controls (see footnote 16), exposure to the “demonstrating balance” box was a significant positive predictor of scores on fairness, β = .10, t(2.23), p = .03 and does not have an agenda, β = .13, t(2.69), p = .01. These variables were also tested using ANOVAs; none produced significant main effects. [↩]
- We used a total of eight control variables in the regressions detailed in the previous footnote. The control variables were: political ideology, the article seen in the experiment (right-leaning or left-leaning), pre-existing trust in online news, amount of online news consumption, age, education, income, and whether or not the respondent noticed the “demonstrating balance” box. Only does not have an agenda is significant with or without controls. [↩]
- At the time of the experiments, Research Now SSI was called Survey Sampling International. [↩]