

SUMMARY
The Center for Media Engagement found that Chicago news sources posting about coronavirus on Facebook in the first half of 2020 mentioned some parts of Chicago more frequently than others. When the amount of coronavirus coverage is mapped against the number of coronavirus cases, several ZIP codes on Chicago’s West and South Sides received less attention than would be expected based solely on the number of cases. This finding relates to our previous research, which showed that newsrooms covered Chicago’s South and West Sides less frequently than the North / Downtown region.
Chicago news sources most often mentioned politics and local businesses when covering coronavirus on Facebook, and coronavirus posts related to health information received more engagement than did coronavirus posts about political or community issues. We also saw that Chicago sources serving a specific geographic area (e.g., the South Side) or audience (e.g., communities of color) posted more local coronavirus- related content, as opposed to national stories or stories about another state, than sources targeting a general audience.
BACKGROUND
Previous research by the Center for Media Engagement examined how Chicago news sources covered various parts of the city and how the public felt about local coverage. The studies revealed that Chicago’s North / Downtown region was mentioned more frequently by local media than the West and South Sides. The findings supported what people living on the West and South Sides of Chicago told us in response to a survey, namely that many felt underrepresented or poorly represented by Chicago news media. In a separate stream of work, we also examined how local newspaper and broadcast news organizations across the country covered coronavirus on Facebook and use this as a point of comparison.
This report, supported by the Robert R. McCormick Foundation, examined how Chicago news sources covered coronavirus on Facebook from January 20 to June 23, 2020. We looked at how coronavirus coverage changed over time, what areas of Chicago were covered, and how audiences engaged with the content. We also examined whether news sources that covered a specific audience or geographic location handled coronavirus coverage differently than sources covering Chicago more generally.
KEY FINDINGS
- When the amount of coronavirus coverage in Chicago news sources’ Facebook posts is mapped against the number of coronavirus cases, several ZIP codes on Chicago’s West and South Sides received less attention than would be expected based solely on the number of cases.
- Coronavirus coverage declined over time across Chicago news sources.
- In their posts about coronavirus, sources covering a specific geographic area or audience posted more local content than did sources targeting a more general audience.
- Coronavirus coverage related to health information received more engagement than did coronavirus coverage related to politics or community issues. News sources posted most often about how government and local businesses responded to coronavirus.
IN-DEPTH FINDINGS
Chicago Locations Mentioned in Coronavirus Coverage
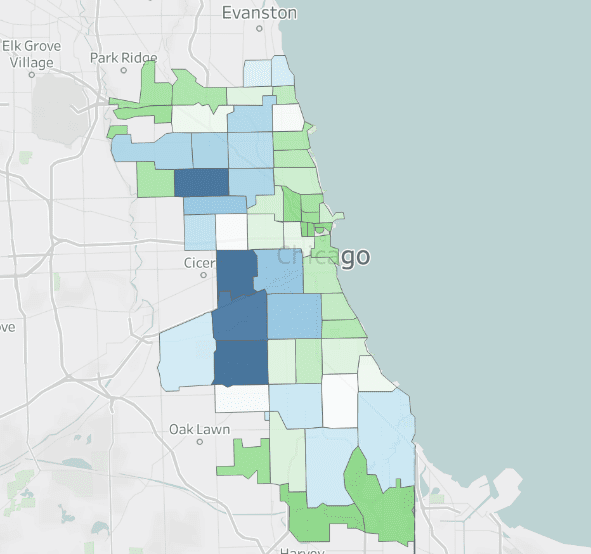
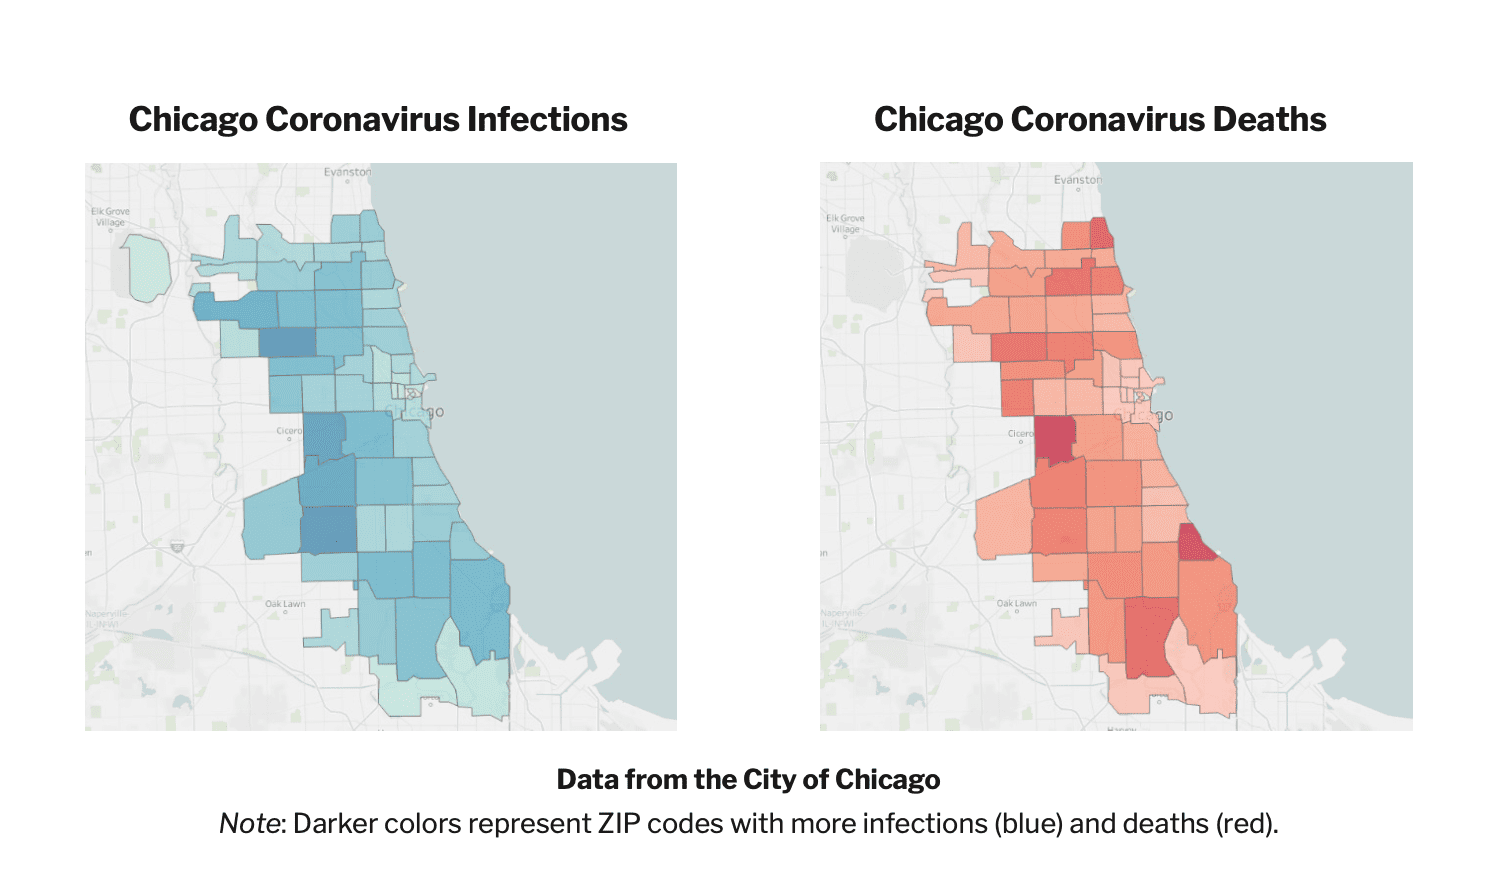
In this study, we analyzed Facebook posts from 51 news sources in Chicago from January 20 to June 23, 2020 using Crowdtangle, a public insights tool owned and operated by Facebook. We sought to find Chicago-area locations mentioned in these posts, as well as in the news articles that were shared as links in the posts. Our analysis found 630 unique locations mentioned in the Facebook posts, and 1,839 unique locations mentioned in the news articles. ZIP-code-based maps were created to illustrate which areas of Chicago received coverage in Facebook posts and in news articles. The image below shows locations mentioned in Facebook posts with darker brown representing more coverage of that ZIP code.1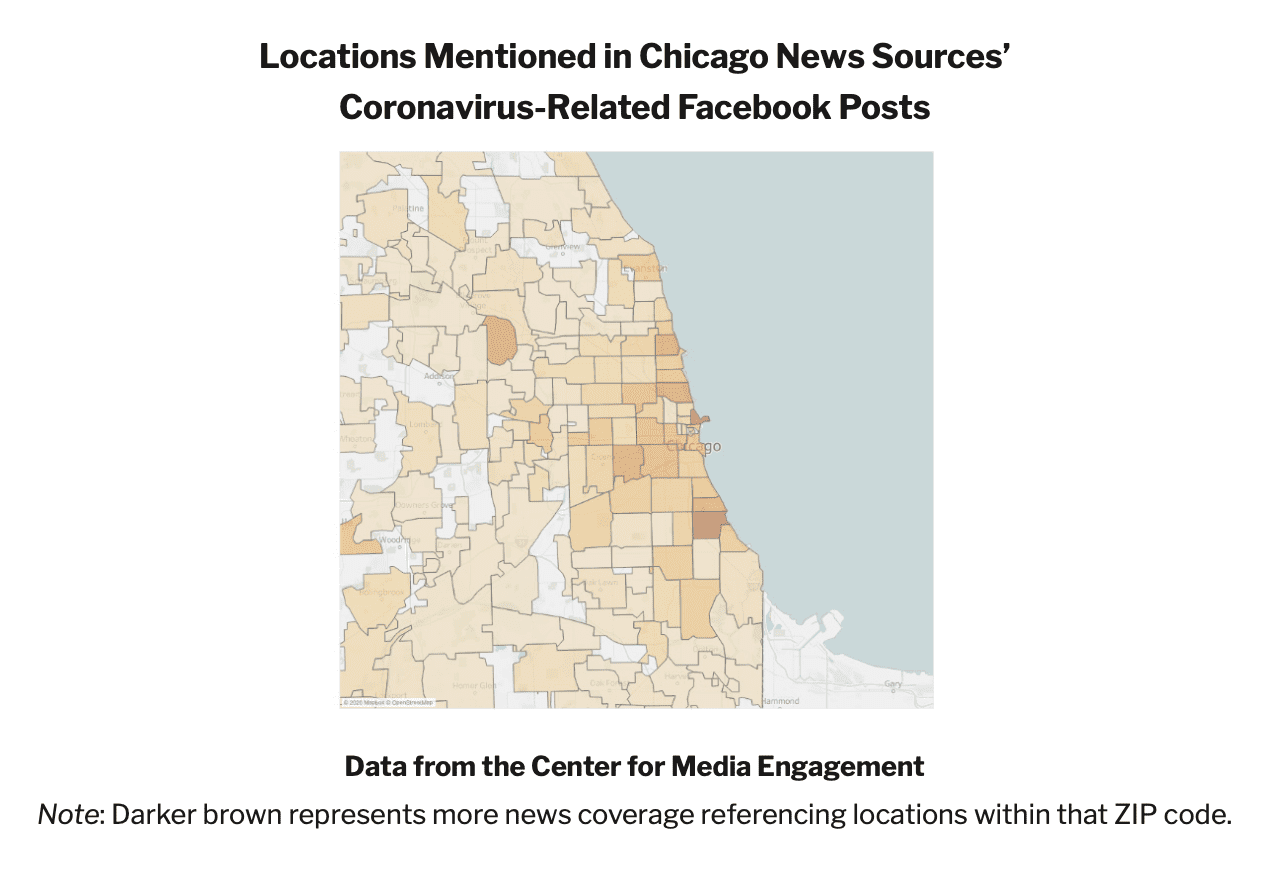 In addition, we used publicly available government data from data.cityofchicago.org to create ZIP code maps showing where coronavirus infections and deaths occurred during the same time period covered by our dataset. We created these maps to offer a visual comparison between the areas of Chicago affected by coronavirus and the areas of Chicago receiving coronavirus coverage. As can be seen by comparing these maps, the amount of coverage did not always line up with the areas that were most affected.
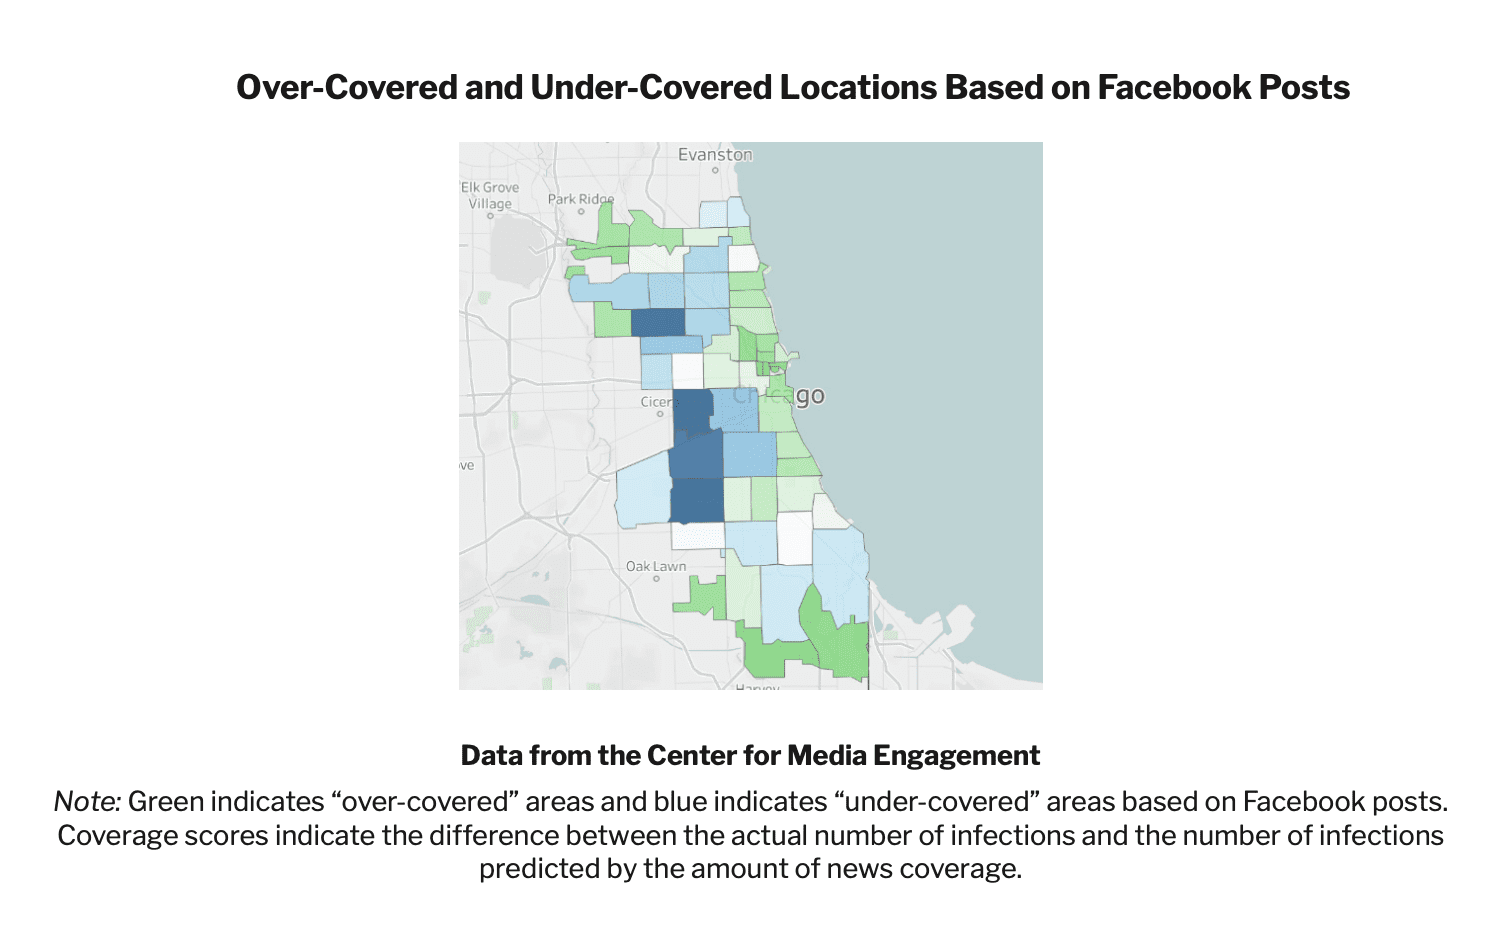
 Using both the publicly available infection data and our Facebook post and article datasets, we were able to calculate “coverage scores” that indicate the difference between the actual number of infections and the number of infections predicted by the amount of news coverage. Negative coverage scores indicate that, based on the amount of media coverage in a particular ZIP code, we would have expected to see more infections in that ZIP code; negative coverage scores mean the ZIP code was “over-covered” by the news media (on the map below, the darker the green, the more a ZIP code was “over-covered”). Conversely, positive coverage scores indicate that, based on media coverage, we would have expected to see fewer infections in a given ZIP code; positive coverage scores mean the ZIP code was “under-covered” by the news media (the darker the blue, the more a ZIP code was “under- covered”). Maps, like the one shown below, were created to show coverage scores for our Facebook post data and our news article data.2
 Although static maps are included in this report, our interactive maps allow users to look more in-depth at the Chicago locations mentioned in coronavirus Facebook posts from local Chicago sources, Chicago locations mentioned in the articles that were linked to the Facebook posts, Chicago COVID data, and an analysis of which areas were over- and under- covered on the basis of the number of COVID cases in the ZIP code.
Local Chicago News Sources’ Coronavirus-Related Posts on Facebook
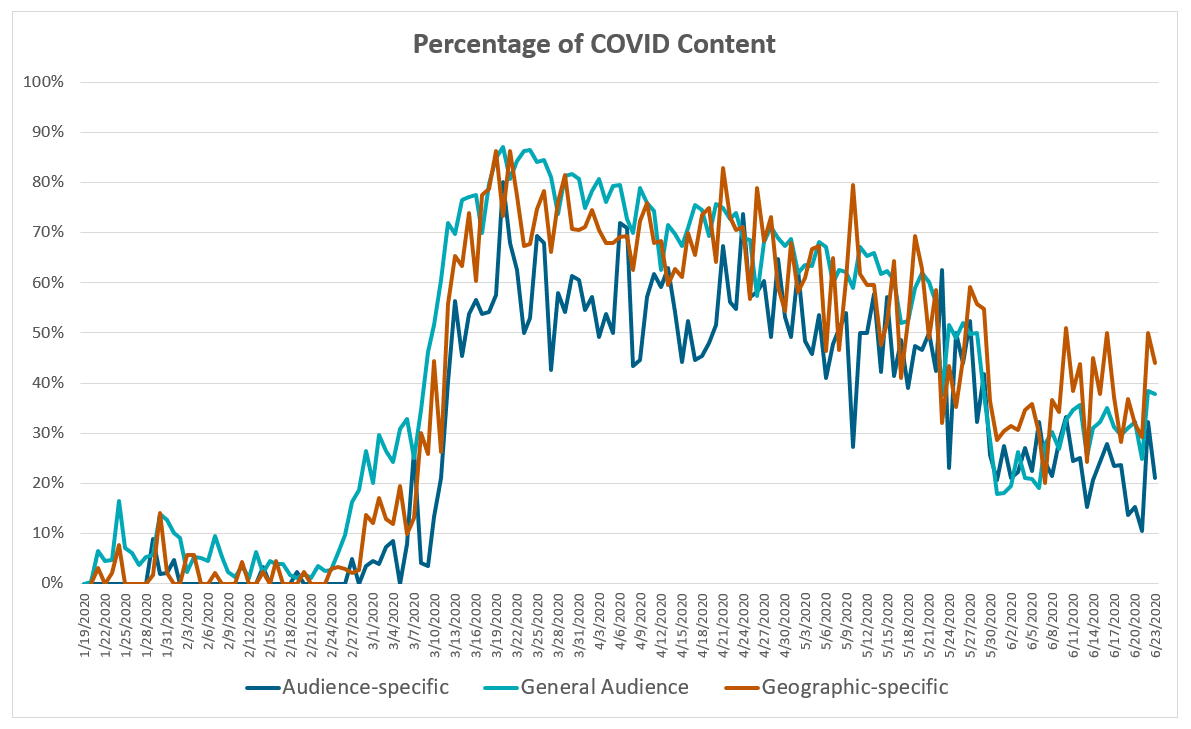
Across all of the Chicago sources we analyzed, 41.3% of Facebook posts were about coronavirus. There was variation, however, over time and depending on the type of source. We examined sources targeting a general audience, such as The Chicago Tribune, sources targeting a specific geographic area, such as the Hyde Park Herald, and sources targeting a specific audience, such as The Chicago Crusader. We also compared sources that publish in English to sources that publish in Spanish.
- On average, 44% of posts from general audience sources and 43% of posts from geographic-specific sources were about coronavirus compared to 33% of posts from audience-specific sources.
- Across all three types of news sources, coronavirus posts began to increase in late February and continued to rise in early March. Coronavirus posts dropped in late May as news sources shifted coverage to the protests against police brutality sparked by George Floyd’s death.
 Data from the Center for Media Engagement
- Spanish-language news sources posted about coronavirus less frequently than did sources using English; 36.3% of posts from Spanish-language sources were about coronavirus, compared to 43.0% of posts from sources using English.
Chicago News Organizations’ Facebook Posts
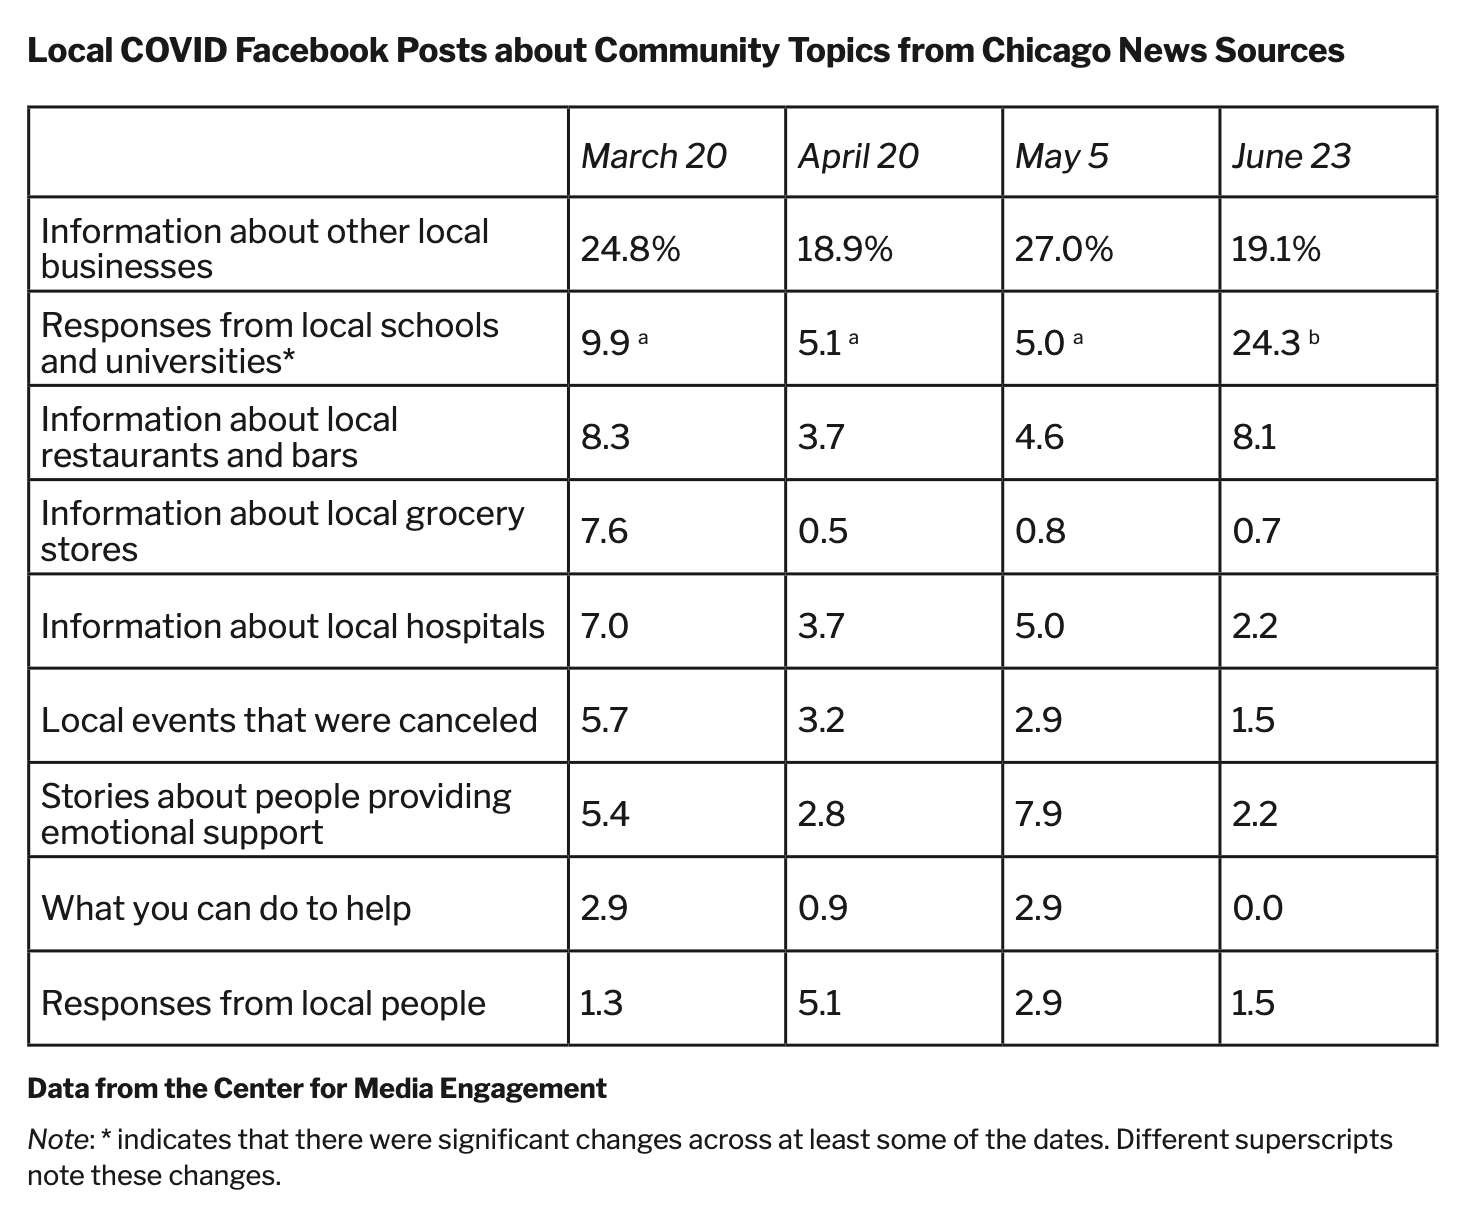
We did an in-depth analysis of Facebook posts from four dates (March 20, April 20, May 5, and June 23) to analyze how coverage changed over time in more detail. All four dates were significant moments in Chicago’s coronavirus news cycle. On March 20, Governor Pritzker issued a stay-at-home order for Illinois. On April 20, known coronavirus cases spiked. On May 5, Governor Pritzker released a plan to reopen Illinois. On June 23, officials announced that Chicago’s students would be returning to school in the fall.
The percentage of Facebook posts from Chicago news sources that mentioned coronavirus significantly declined over time.3 On March 20, 83.9% of posts on Facebook mentioned coronavirus, compared to 38.6% on June 23. We observed a similar decline in our previous research on coronavirus coverage from local news sources across the nation.
We also looked at how many coronavirus posts were local, meaning they mentioned something about Chicago or Illinois. The percentage of local COVID posts did not change over time.4 Approximately half of the coronavirus-related posts were local on each of the four dates. This is slightly lower than what we found in our research that examined local news sources across the nation; for these sources, 65% of coronavirus coverage was local.
News sources targeting a specific audience posted coronavirus-related content on Facebook less frequently than did news sources targeting a general audience.5 The percentage of coronavirus posts for geographic-specific sources fell in between these two.
When audience-specific and geographic-specific sources did post about coronavirus, they were more likely to localize their posts than were sources targeting a general audience.6 For geographic-specific sources, 86.7% of COVID-related Facebook posts were local. For audience-specific sources, 73.0% of the COVID-related posts were local. For general audience sources, 58.7% of COVID-related posts were local.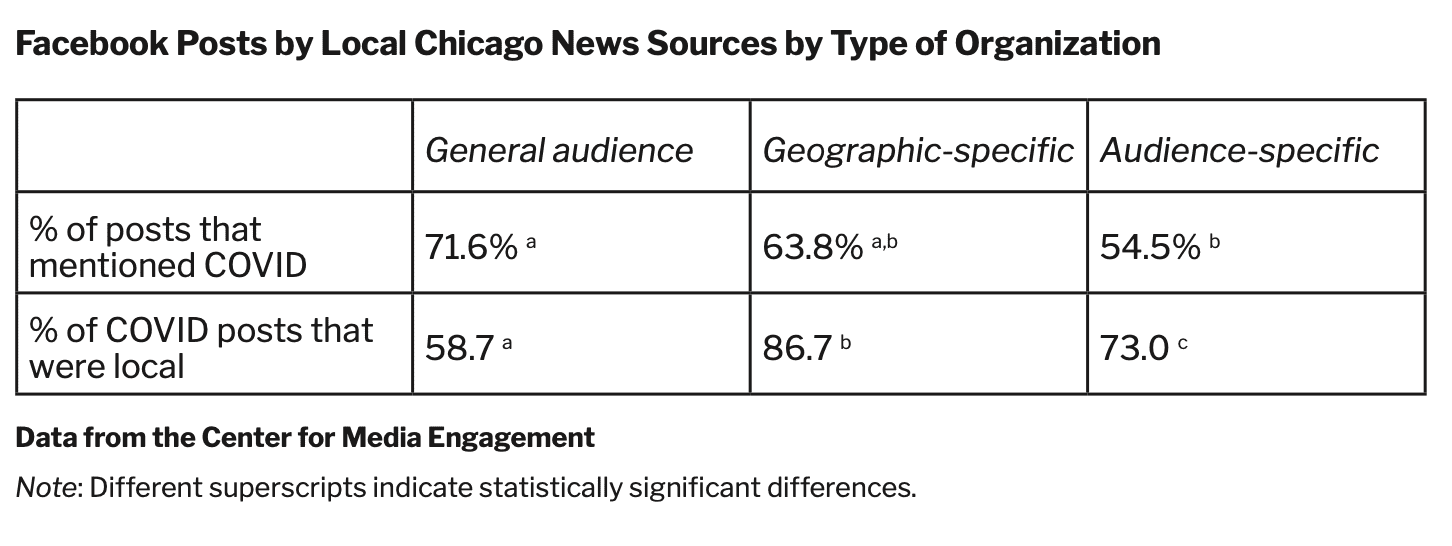 When news sources posted local coronavirus content on each of the four dates, it was most often about government responses and local businesses. When we did a similar analysis of coverage at local news sources across the country, we found that these also were the most common topics.
In terms of political topics, more coronavirus posts mentioned local government responses in June (41.9%) than in April (28.1%) or May (23.8%), but a similar percentage mentioned government responses in March (37.3%).7
More news coverage on Facebook focused on the local economic consequences of coronavirus in April (20.8%) than in March (12.1%).8 In June, however, the percentage of coverage that mentioned economics decreased to 12.5%.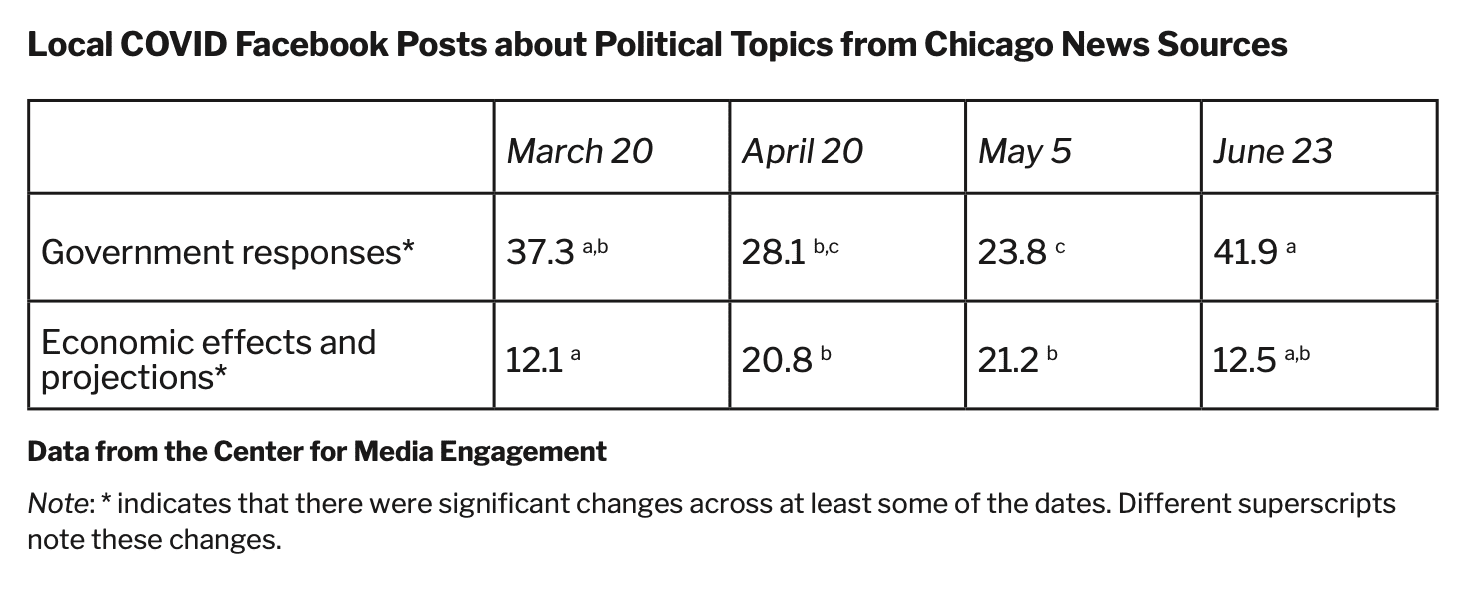 We also looked at coverage of community topics among the Facebook posts. Here, information about local businesses was the most common topic we analyzed on March 20, April 20, and May 5. Responses from local schools and universities was the most common topic on June 23 – a significant increase in coverage compared to the other dates.9 In June, 24.3% of coronavirus-related posts on Facebook mentioned schools, compared to 9.9% in March, 5.1% in April, and 5.0% in May. This is likely because Illinois officials announced on June 23 that students would be returning to school in the fall. In our research examining local coronavirus news coverage across the country, we also saw coverage of education-related topics increase in June.
 Next, we analyzed mentions of health topics in the Facebook posts. Coverage of the number of people who tested positive was the most common category on March 20, whereas the number of deaths was the most common on April 20 and May 5. On June 23, information about masks was the most common health topic that we examined.
There were changes over time for some of these categories. Coverage of the number of deaths peaked in April, where 21.2% of the posts on Facebook mentioned the number of deaths, versus 2.9% in March, 10.0% in May, and 2.2% in June.10 This is potentially because, on April 20, Illinois officials announced that 59 people had died from coronavirus within 24 hours.
Posts that mentioned health effects on subpopulations or vulnerable groups, such as the homeless, significantly increased from March (3.8%) to April (13.8%).11 Coverage of vulnerable groups in April and May fell in between the other two months. In April, Mayor Lori Lightfoot brought attention to the disproportionate effect of the pandemic on communities of color in Chicago. Of posts that mentioned health effects on subpopulations across the four dates, 2.6% focused on racial disparities connected to the virus.12
Chicago news sources posted about masks less frequently in March than in any other month; 1.0% of posts from March mentioned masks, compared to 4.6% in April and May and 10.3% in June.13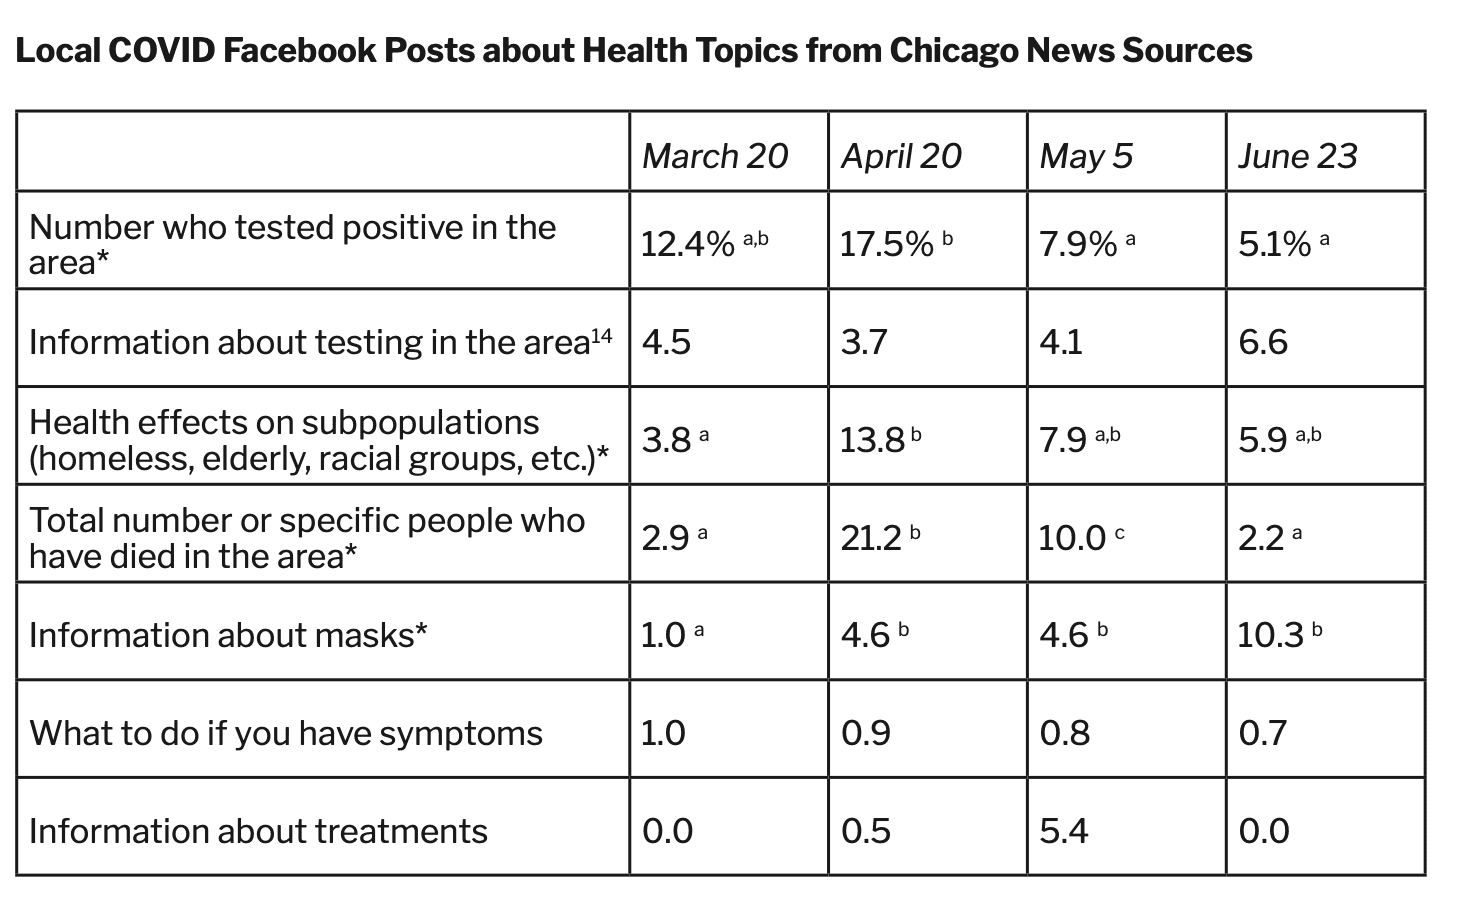 Data from the Center for Media Engagement14 Note: * indicates that there were significant changes across at least some of the dates. Different superscripts note these changes.
We also examined how often different types of news sources mentioned these topics. In the next table, we present information only for those categories where there were significant differences across the types of organizations.
Audience-specific sources posted less frequently about the number of people who tested positive and the number of deaths than did the two other kinds of sources.15 Audience- specific sources posted more stories about communities providing emotional support than general audience sources posted.16 Geographic-specific sources were more likely to provide information about local restaurants and bars than general audience sources were.17 There were no differences for any of the other topics. We also compared posts from Spanish-language sources to posts from English-language sources. We only found a difference for one topic. Sources in English posted more stories about people providing emotional support, but the occurrence was infrequent overall; 5.6% of posts from sources in English provided information about people providing emotional support, compared to 0.9% of posts from sources in Spanish.18
Engagement with Coronavirus Content
For the four days on which we conducted the in-depth analysis, we were able to connect the posts to information about how people engaged with them.
As in our previous report on coronavirus posts from local outlets across the country, COVID- related posts from Chicago news sources received more likes, comments, and shares than posts about other topics.19 Posts that mentioned coronavirus received a median of 24 likes, 7 comments, and 11 shares. Non-COVID-related posts received a median of 8 likes, 1 comment, and 3 shares.
Content that covered national coronavirus news or coronavirus news from another state received more engagement than local coronavirus content.20 Local stories that mentioned coronavirus received a median of 29 likes, 9 comments, and 15 shares, whereas non-local COVID-related posts received a median of 64 likes, 34 comments, and 34 shares. This finding differs from our previous research on coronavirus coverage from local sources across the country, in which local stories received more comments and shares than stories about other areas.
Looking only at the local COVID-related posts, posts that contained information about health, as opposed to only information about political or community issues, received the most engagement.21 Health-related posts received a median of 54 likes, 30.5 comments, and 32.5 shares. Posts that didn’t mention any health information received a median of 20 likes, 5 comments, and 8 shares.
Specific areas of high engagement include:
- Facebook likes were highest for posts that mentioned information about masks (81.5 likes, the median value). Likes were also high for posts about the number of deaths in the area (60 likes, the median value) and government responses (42 likes, the median value). Posts that mentioned the number of deaths and garnered a high number of likes often focused on responses following deaths, such as families remembering loved ones who died or awards given to firefighters who had passed, or the number of deaths accompanied by a mention of political action, such as issuing stay at home orders or reopening the economy.
- Shares were highest for posts that mentioned the number of deaths (56.50 shares, the median value) and information about local grocery stores (40.5 shares, the median value).
- Comments were highest for information about masks (59.5 comments, the median value) and the number of deaths (48 comments, the median value).
Coronavirus Topic Coverage on Facebook
For the entire corpus of coronavirus Facebook posts from Chicago news sources, we analyzed how frequently the posts mentioned 13 different topics that we identified in our previous work.22
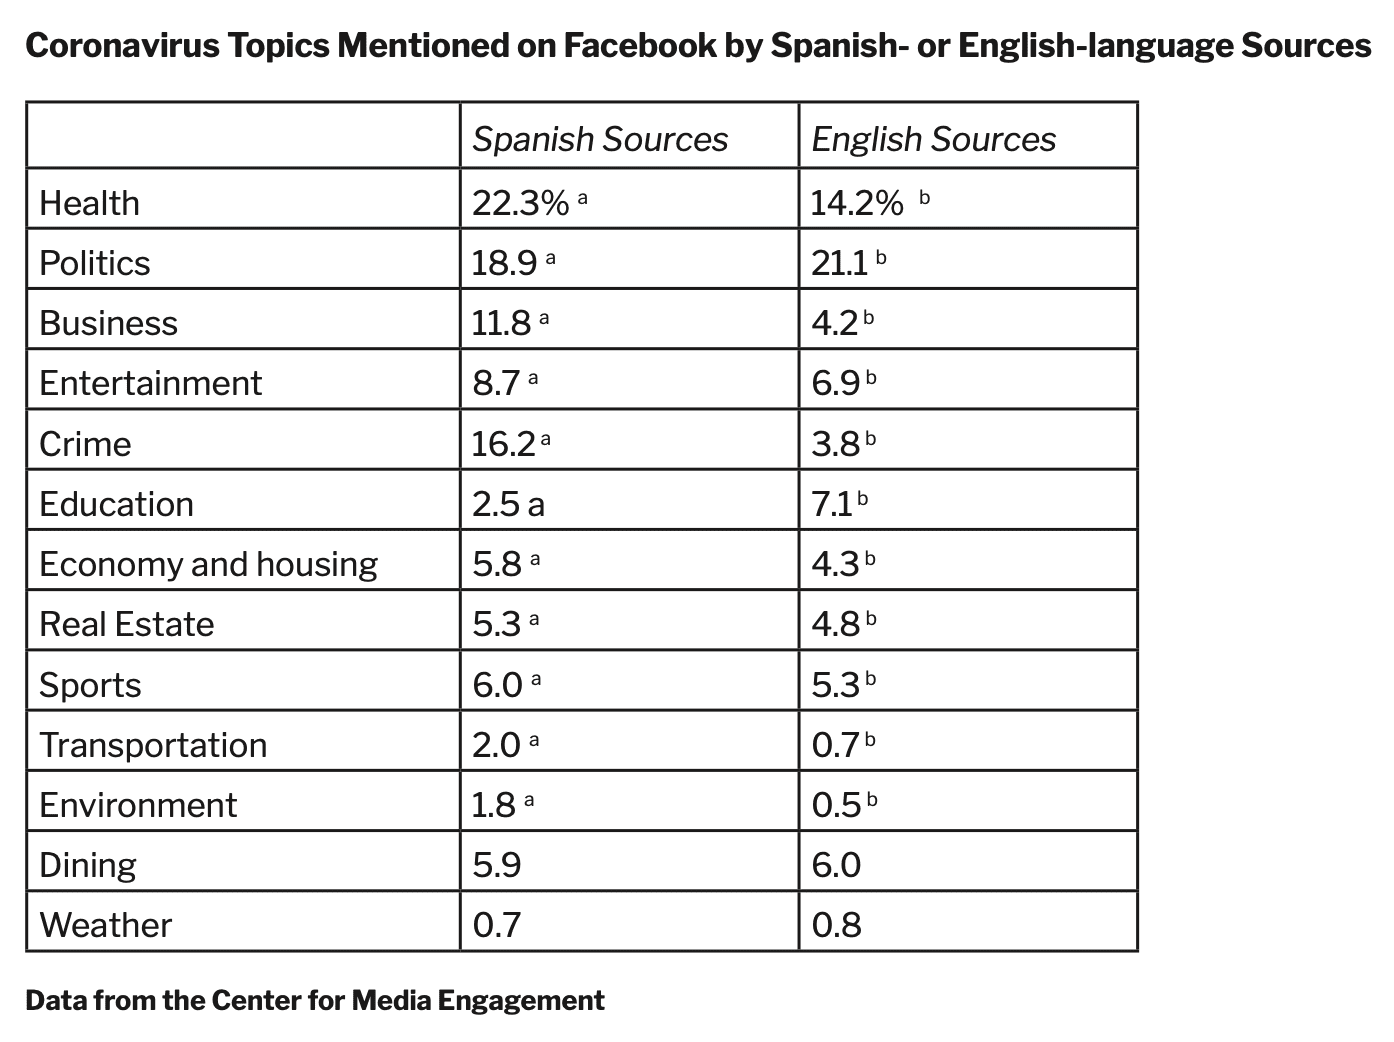
General audience and audience-specific sources posted the most about political issues related to coronavirus, while geographic-specific sources posted the most about health topics.23 Geographic-specific sources also posted less often about business and crime related to coronavirus than did audience-specific or general audience sources.24 Coronavirus-related posts from audience-specific sources were more likely to mention entertainment topics and economy and housing topics than general audience or geographic-specific sources.25 General audience sources were also the least likely to mention education topics and the most likely to mention real estate topics in their coronavirus-related posts.26 We also compared coronavirus-related posts from Spanish-language sources to coronavirus-related posts from English-language sources.27 Posts from Spanish-language sources were more likely to mention words related to health, business, economy and housing, crime, and entertainment than sources in English.28 Spanish-language sources posted less about education and politics in relation to coronavirus than sources in English.29
METHODOLOGY
We used Facebook’s CrowdTangle platform to gather Facebook posts from 51 news sources in Chicago. The following news sources were included in the general audience category: ABC 7, CBS 2, Chicago Magazine, Chicago Sun-Times, Chicago Tribune, Crain’s Chicago Business, Fox 32, NBC 5, Telemundo Chicago, Univision Chicago, WBBM Newsradio, WBEZ 91.5, WGN, and WTTW PBS. The sources included in audience-specific category were: AirGo Radio, Borderless Magazine, Bronzecomm, Chicago Defender, Chicago Parent, Contratiempo, Council of Islamic Organizations of Greater Chicago, El Dia Newspaper, Free Spirit Media, La Raza Chicago, Negocios Now, Puerto Rican Cultural Center, Rebellious Magazine for Women, StreetWise, The Chicago Reader, The Chicago Reporter, The Chicago Crusader, The Hoodoisie, The TRiiBE, Via Times, WGHC 98.3FM, Windy City Times, N’Digo, Juneteenth Productions, and WVON. The sources included in the geographic-specific category were: Austin Weekly News, Block Club Chicago, City Bureau, Hyde Park Herald, Invisible Institute, McKinley Park News, South Side Drive Magazine: Guide to the Good Life Chicago, South Side Weekly, The Beverly Review, The Joliet Herald-News, The Village Free Press, and The Voice Newspapers. We only examined content from sources that published in English or in Spanish.30
Machine Learning Classifier for Coronavirus Posts
We created two classifiers to generate predictions of coronavirus posts from the sources’ Facebook pages, one for predictions in January and February and the other for the remaining months. We built two classifiers because a general classifier did not perform well for earlier posts. We coded posts to determine whether they were about coronavirus or not, looking at the Facebook post message, link text, and description.
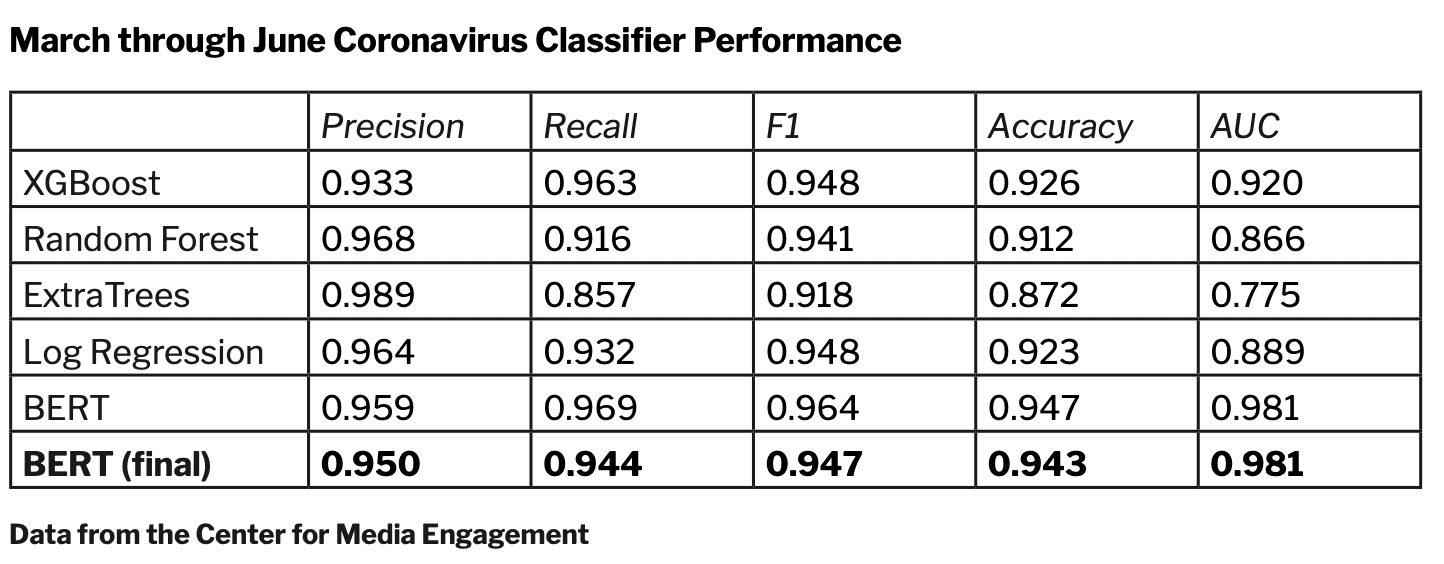
For Facebook posts in January and February, we created a sample (n = 476, with a 3:1 ratio of non-COVID to COVID posts) because there were few posts about coronavirus in this early period (119 coronavirus posts identified from 2,400 total posts). Based on the manually coded dataset, we created a BERT classifier to label posts as related to coronavirus. The test performance of 20% of the coded dataset is included in the following table. We then used the classifier to label all 20,769 posts from January and February to indicate whether they were about coronavirus; 1,038 posts were classified as coronavirus-related posts.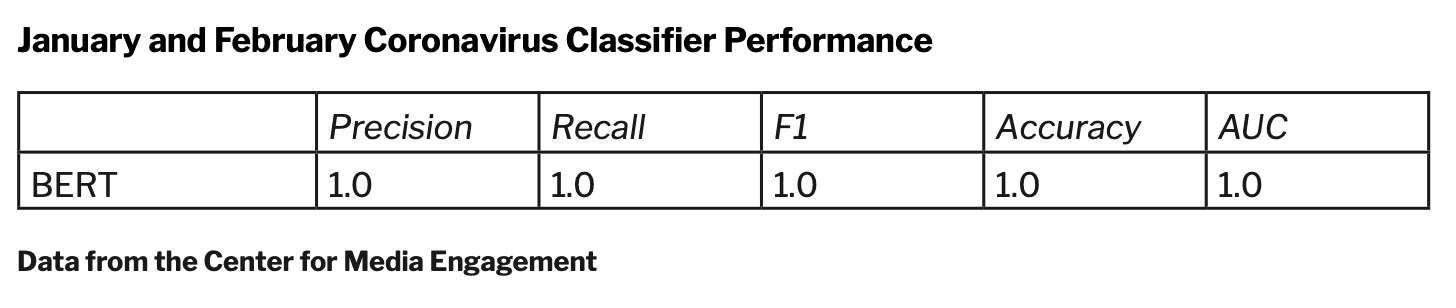 For posts from March through June, we used a manually coded dataset (n = 6,994) to build a classifier. We used the BERT model, as it outperformed other models. All 67,784 posts from March through June were labeled using this classifier; 35,528 posts were classified as containing coronavirus-related content.
Mapping
All coronavirus-related Facebook posts and news articles in our dataset were analyzed to find instances in which Chicago-area place names were mentioned. For the Facebook posts, we analyzed the link text and link description; for the news articles, we analyzed the headline, lead, and article text. Prior to analysis, all words appearing in our dataset, as well as in our list of Chicago-area place names, were pre-processed to remove characters and conjugation that would prevent matching. This pre-processing was done using Python, and matching place names was done using R.31 Our analysis indicated that 630 unique Chicago- area locations appeared at least once in 4,027 Facebook posts, and 1,839 unique Chicago- area locations appeared at least once in 15,396 news articles.
After being matched to posts/articles, researchers identified the ZIP codes for each unique location. Using Tableau, an analytics and data visualization platform, we then created maps highlighting ZIP codes in which locations appeared in the posts, as well as ZIP codes in which locations appeared in the news articles.
Chicago Locations
Our list of Chicago-area locations was originally created for our Chicago Media Mapping study. This original list was updated using publicly available government data from data.cityofchicago.org (including information about coronavirus testing, infections, and deaths). The original list was created using data.cityofchicago.org to identify police and fire stations, libraries, polling places, schools, affordable housing developments, restaurants (identified from public health inspection reports), as well as other public service locations, including cooling and warming centers, public health clinics, and senior centers. Wikipedia, Yelp, and other webpages containing the names of religious institutions, cultural centers, sports venues, neighborhoods, etc. were also collected. For this analysis, we used a dataset of 21,038 unique Chicago-area locations.
Using the location list, we identified locations mentioned in the Facebook posts and the
full text of the articles linked in the Facebook posts, respectively. For preprocessing, POS tagging (Penn Treebank tags) and tokenizing (WordNetLemmatizer from the Natural Language Toolkit package on Python) were applied for the text from the Facebook postings and the articles as well as the location list.32
Determining the ZIP codes that were over/under-covered was done by creating a regression model predicting infections from media coverage. The infections variable represented cumulative coronavirus infections within each ZIP code from January 1, 2020, through the last full week of June 2020; this information was obtained using publicly available data from data.cityofchicago.org. Media coverage for each ZIP code was calculated by summing the total number of articles in our dataset that mentioned a location in each ZIP code. “Coverage scores” are the standardized residuals from our regression analysis and indicate the difference between the actual number of infections and the number of infections predicted by the media coverage in our dataset.
In-Depth Content Analysis
For the in-depth analysis, we evaluated 2,515 Facebook posts. To obtain intercoder reliability, two coders examined 20% of the total dataset for whether a Facebook post mentioned coronavirus and, if the post did mention coronavirus, whether it was a local story, meaning the post covered issues in Chicago and/or Illinois. After obtaining reliability, we coded the rest of the dataset. We identified 908 posts that mentioned coronavirus and were local stories. We examined topic coverage only for these 908 posts. Two coders examined 20% of these posts to obtain intercoder reliability for all health, politics, and community variables.
Reliabilities were computed using Krippendorff’s alpha. The metric runs from 0, indicating a lack of reliability and extensive disagreement among people examining the same content, to 1, indicating perfect agreement among people examining the content. Scores greater than 0.80 indicate strong reliability and those greater than 0.67 indicate acceptable levels of reliability. Krippendorff’s alphas for all variables can be found below.
Reliabilities
Mention of coronavirus: 0.93
Local: 0.84
Number of people who tested positive: 0.95
Number of deaths: 0.97
What to do if you have symptoms: 1.0
Information about testing: 1.0
Masks: 0.92
Treatments: 0.86
Events that were canceled: 0.88
Schools/universities: 0.86
Hospitals: 0.79
Local people: 0.75
Grocery stores: 0.85
Restaurants and bars: 0.96
Other local businesses: 0.78
Health effects on subpopulations: 0.87
What you can do to help: 0.93
Stories about people emotionally supporting each other: 0.76
Government responses: 0.74
Economic effects and projections: 0.84
Data from the Center for Media Engagement
We attempted to code for other topics but could not obtain reliability due to how infrequently they appeared in the dataset. These topics included mental health, crime related to coronavirus, local fact-checking, electoral effects and projections, local political disagreement/agreement, and racism connected to coronavirus.
News Topics
We examined articles for mentions of 13 news topics, including: business, crime, dining, economy and housing, education, environment, entertainment, health, politics, real estate, sports, transportation, and weather. These topics were determined based on an original survey (from a previous study) in which Chicago residents were asked to name the most important issues facing their neighborhoods. Eight additional topics were chosen based on their prevalence in our Chicago Media Mapping study. In this previous study, lists of words unique to each news topic were created using a variety of sources, including online dictionaries, word association lists, and the original Chicago survey. Words were chosen for inclusion based on their specific association to a particular topic. For example, “home invasion” was included in the crime topic list because of its clear association with crime, but “shooting” was not included because it can be related to crime, sports (e.g., “shooting the ball”), and entertainment (e.g., “shooting a movie”). Each topic list varied in size based on the number of words with clear associations to a particular topic. This resulted in an average topic list containing 109.7 words (SD = 102.07). All 1,426 news topic words were translated into Spanish for analysis of Spanish language news articles. For preprocessing of the Spanish language Facebook posts and the articles, POS tagging and tokening with a pre-trained model from SpaCy (“es_core_news_sm”) were applied.
With the 13 topic lists, we matched the Facebook posts and the full text of the articles linked to in the Facebook posts, respectively. The same preprocessing methods used with the location matches were applied for the topic lists and the text from the Facebook posts and the articles.
Machine Learning Classifier for Coronavirus Posts about Testing
We coded 2,925 posts as part of the content analysis to determine whether they were about COVID testing or not. Since the coded binary samples were imbalanced (only 5.2% of the total posts were coded as COVID testing-relevant), we used a sample of 450 posts (150 as testing posts, 300 as non-testing posts) to train a machine learning classifier. We chose a BERT model after comparing the performances of other machine learning models as presented below.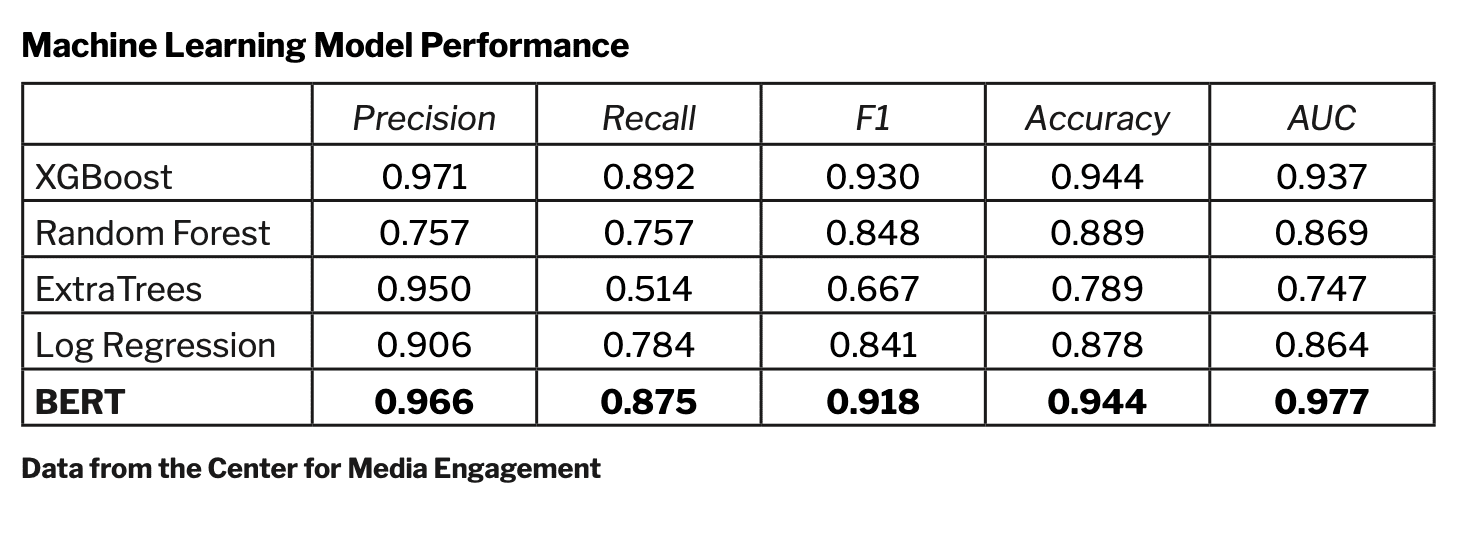 The BERT COVID-testing classifier generated 1,422 predictions of posts mentioning testing.
SUGGESTED CITATION:
Murray, Caroline, Curry, Alex, Kim, Yujin, & Stroud, Natalie Jomini. (December, 2020). Coronavirus coverage in Chicago. Center for Media Engagement. https://mediaengagement.org/research/coronavirus-coverage-in-chicago
- As mentioned in the report, we also created a map of the locations mentioned in the news articles. We did not include an image of this article map in the report because of its visual similarity to the Facebook post location map. The correlation by ZIP code for the two maps is r (234) = 0.65, p < .001. [↩]
- An over/under-coverage map was also created using our news article dataset, but because of its visual similarity to the article- based map, we did not display it in this report. The correlation by ZIP code for the two maps is r (56) = 0.54, p < .001. [↩]
- χ2(3, 2515) = 306.36, p < .001. One of the sources, La Raza, posted much more frequently on Facebook than any other source. They posted 412 times across the four dates, compared to the next most active audience-specific or geographic-specific source, The Joliet Herald-News, which posted only 82 times, and the next most active general audience source, Fox 32, which posted 187 times. Due to their heightened activity, we examined La Raza separately in some of our analyses so they wouldn’t have a disproportionate impact on our results. This finding holds when we remove La Raza from the analysis; χ2(3, 2103) = 299.01, p < .001. [↩]
- χ2(3, 1671) = 7.46, p = .059. When we remove La Raza from the analysis, we find a significant decline in local coverage from March (65.8%) to April (55.8%), but no differences between any month to May (61.9%) or any month to June (66.3%); χ2(3, 1451) = 10.94, p = .01. [↩]
- χ2(2, 2094) = 30.34, p < .001. Due to La Raza’s disproportionate activity on Facebook and the fact that only six out of their 412 posts contained local coronavirus content, we did not include La Raza in this analysis. [↩]
- χ2(2, 1447) = 41.47, p < .001. Due to La Raza’s disproportionate activity on Facebook and the fact that only six out of their 412 posts contained local coronavirus content, we did not include La Raza in this analysis. [↩]
- χ2 (3, 907) = 19.07, p < .001. [↩]
- χ2 (3, 906) = 12.52, p = .006. [↩]
- χ2 (3, 908) = 44.87, p < .001. [↩]
- χ2 (3, 908) = 61.69, p < .001. [↩]
- χ2 (3, 908) = 18.96, p < .001. [↩]
- Three coders examined the 69 posts across the four dates that mentioned health effects on subpopulations for mentions of racial disparities (Krippendorff’s alpha: 0.958). [↩]
- χ2 (3, 908) = 21.01, p < .001.[↩]
- We trained a classifier to detect coronavirus posts about testing across the full dataset. With these data, we were able to look at differences across the outlet types, finding that 6.0% of coronavirus posts from geographic-specific outlets were about testing followed by 4.5% of coronavirus posts from general audience outlets and 0.8% of coronavirus posts from audience-specific outlets. The rate of coverage remained relatively constant over time. [↩]
- Number of people who tested positive: χ2(2, 899) = 7.72, p = .02. Number of deaths: χ2(2, 899) = 7.99, p = .018. [↩]
- χ2(2, 899) = 8.13, p = .017. [↩]
- χ2(2, 899) = 6.82, p = .03. [↩]
- χ2(1, 905) = 4.57, p = .03. [↩]
- Mann-Whitney Z = -7.99, p < .01 for likes; -7.16, p < .01 for comments; and -7.59, p < .01 for shares comparing coronavirus to non-coronavirus posts. This finding holds when we remove La Raza from the analysis; Mann-Whitney Z = -6.02, p < .01 for likes; -5.00, p < .01 for comments; and -5.09, p < .01 for shares comparing coronavirus to non-coronavirus posts. [↩]
- Mann-Whitney Z = -6.54, p < .01 for likes; -6.35, p < .01 for comments; and -5.93, p < .01 for shares comparing coronavirus to non-coronavirus posts. Due to La Raza’s disproportionate activity on Facebook and the fact that only six out of their 412 posts contained local coronavirus content, we did not include La Raza in this analysis. [↩]
- Mann-Whitney Z = -4.35, p < .001 for likes; -6.24, p < .001 for comments; and -6.85, p < .001 for shares comparing health- related to non-health-related posts. [↩]
- We also examined the full text of the articles linked through the Facebook posts for mentions of the 13 topics. The results were highly correlated with the results from examining the posts alone (r=0.94), so we only included the results from the Facebook posts in this report. [↩]
- Politics: χ2(2, 32402) = 34.98, p < .001. Health: χ2(2, 32402) = 25.28, p < .001. [↩]
- Crime: χ2(2, 32402) = 34.67, p < .001. Business: χ2(2, 32402) = 22.79, p < .001. [↩]
- Entertainment: χ2(2, 32402) = 319.41, p < .001. Economy and housing: χ2(2, 32402) = 26.59, p < .001. [↩]
- Education: χ2(2, 32402) = 71.61, p < .001. Real estate: χ2(2, 32402) = 51.88, p < .001.[↩]
- Spanish-speaking sources included Univision Chicago, Telemundo Chicago, La Raza, Contratiempo, El Dia Newspaper, Negocios Now and the Puerto Rican Cultural Center. [↩]
- Health: χ2(1, 36412) = 317.64, p < .001. Business: χ2(1, 36412) = 661.43, p < .001. Entertainment: χ2(1, 36412) = 28.54, p < .001. Economy and housing: χ2(1, 36412) = 33.43, p < .001. Crime: χ2(1, 36412) = 1610.27, p < .001. [↩]
- Education: χ2(1, 36412) = 237.04, p < .001. Politics: χ2(1, 36412) = 17.83, p < .001. [↩]
- Five additional outlets were considered for analysis but were not included for various reasons. Four of the outlets, Ukie Drive Radio, Tsahim Urtuu North America, News Magazine Chicago and Korea Times, were not included because they did not publish content in English or Spanish. One outlet, North Lawndale Community News, wasn’t included because it did not post at all from January 20 to June 23, 2020. [↩]
- More details about the analysis process: The texts were separately tokenized after tagging the part of speech using Penn Treebank tags and WordNetLemmatizer from the NLTK (Natural Language Toolkit) package and Python 3.7. Likewise, the list of places was also applied in this process. The tokenizing process solves some linguistic issues such as matching with a plural form of places from the news articles. To increase the accuracy of matching, a blank space was added before and after each word/ phrase from the place list, which prevents capturing partly matched words (e.g., incorrectly capturing “bridge” from the word “bridgeview”) and was added before and after the post and article texts. Finally, using R, a dataset was created in a matrix format and coded as 1 if the place name appeared each news article. [↩]
- The pre-cleaning number of Facebook posts, before we removed place names with multiple Chicago-area locations, like “mcdonalds” or “subway” were: 8,521 posts out of 35,528 matched (24%) with 836 locations, and for the full text of the articles, 19,633 articles out of 26,717 matched (73.5%) with 2,464 locations. [↩]