

In an analysis of local Chicago news coverage, the Center for Media Engagement found that the media mentioned Chicago’s North / Downtown region more frequently than the West and South Sides and that there were differences in which topics were included in articles mentioning different parts of Chicago.
This follows up on a previous study, where we found that people living on the West and South Sides of Chicago felt underrepresented or poorly represented by Chicago news media compared to those living in the North / Downtown region. As this study shows, these perceptions have a basis in actual news coverage.
Implications
Chicago’s media ecosystem is both vibrant and lacking. It is vibrant in the sense that there are many news organizations catering to diverse populations throughout the city. It is lacking in the sense that survey research shows sharp divides in how well people think that local Chicago media are meeting their needs. In a previous report, we found that those living on the South and West Sides felt less represented by Chicago media compared to those living in the North / Downtown region.
It is important to figure out how well perceptions of media coverage actually square with reality. In this report, supported by the Robert R. McCormick Foundation, we analyze whether the South and West Sides are covered differently than the North / Downtown region.
The results showed that the North / Downtown region was mentioned in more articles than the West and South Sides and that there were differences in which topics were included in articles that mentioned different parts of Chicago.
We shared our analysis at a McCormick Foundation event for local Chicago media organizations. The surrounding discussion signaled a recognition of the issues we uncovered, revealed shared enthusiasm about addressing the issues, and brought to light several projects already underway.
Key Findings
- The North / Downtown region was mentioned in more articles than the West and South Sides.
- Crime, which Chicago residents rated as one of the top issues facing their neighborhoods in our survey, was mentioned more frequently in articles referencing West Side locations than articles referencing the other two regions.
- Across the 13 topics we examined, crime was the most frequent coverage topic of all three regions.
- Other categories like transportation and the environment, which were also top issues for Chicago residents, received comparatively less coverage.
- Articles that mentioned South and West Side locations were more likely to reference education, politics, the economy and housing, and the environment than were articles mentioning North / Downtown locations.
- Coverage patterns varied by news outlet, but nearly all of the Chicago sources mentioned locations from the North / Downtown region in a majority of their coverage.
Complete Findings
In this study, we scraped text from 5,286 articles appearing on the homepages of 21 Chicago news sources over the course of two weeks from February 8-22, 2019. We then conducted a content analysis to examine the coverage.
Chicago Locations Covered in Local Media
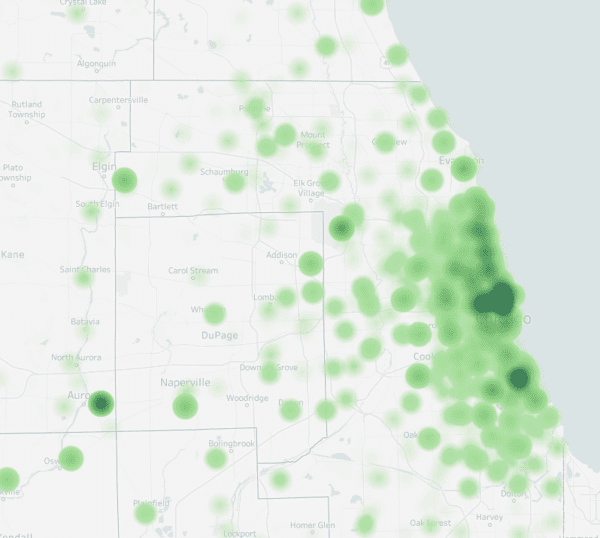
Across the articles we scraped, 2,247 mentioned a distinct Chicago location, including outlying areas. We show the findings graphically in the map below, where darker green indicates more articles.
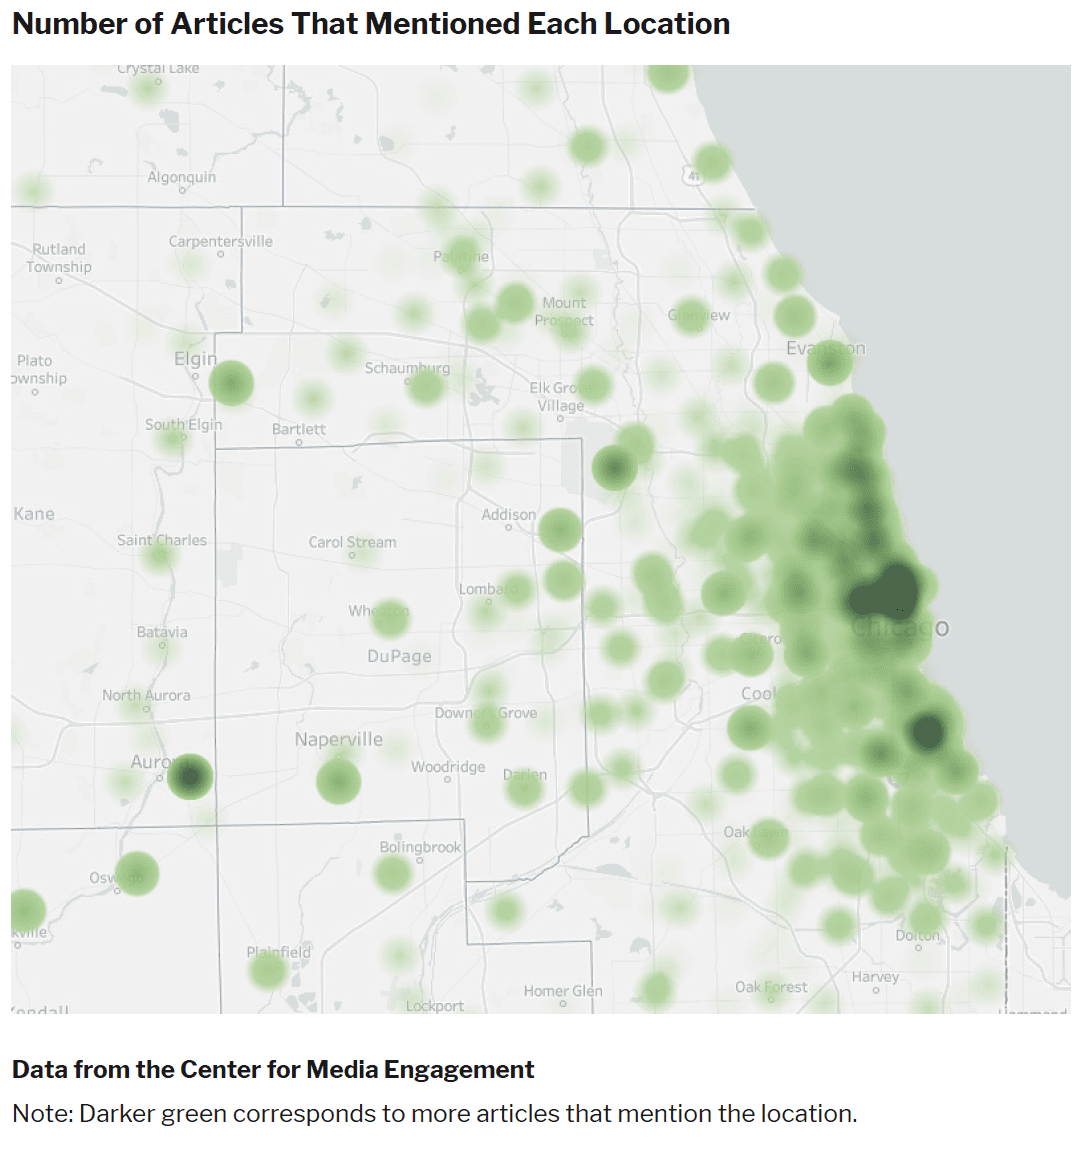
Consistent with our past work, we wanted to examine whether there were any differences across three regions of Chicago: North / Downtown, South Side, and West Side. Of the articles we scraped about Chicago, 1,574 mentioned locations that lie within these regions. Article mentions varied by region; 1,206 articles mentioned a location in the North / Downtown region of Chicago, 544 mentioned a location on the South Side, and 222 mentioned a location on the West Side.1
Topics Mentioned in the Media
We next analyzed how frequently 13 different topics were mentioned in the media. Five of the topics were named by our survey respondents as the most important issues facing their neighborhoods: crime and law enforcement, economic and housing issues, transportation, education, and the environment. The remaining eight categories were determined after reviewing the coverage.
The table below shows what percentage of articles mention both an identifiable Chicago location and a particular topic. Articles, of course, could mention more than one topic and location. For example, of all articles that include a mention of a location on the North Side or Downtown, 42% also included a mention of entertainment.
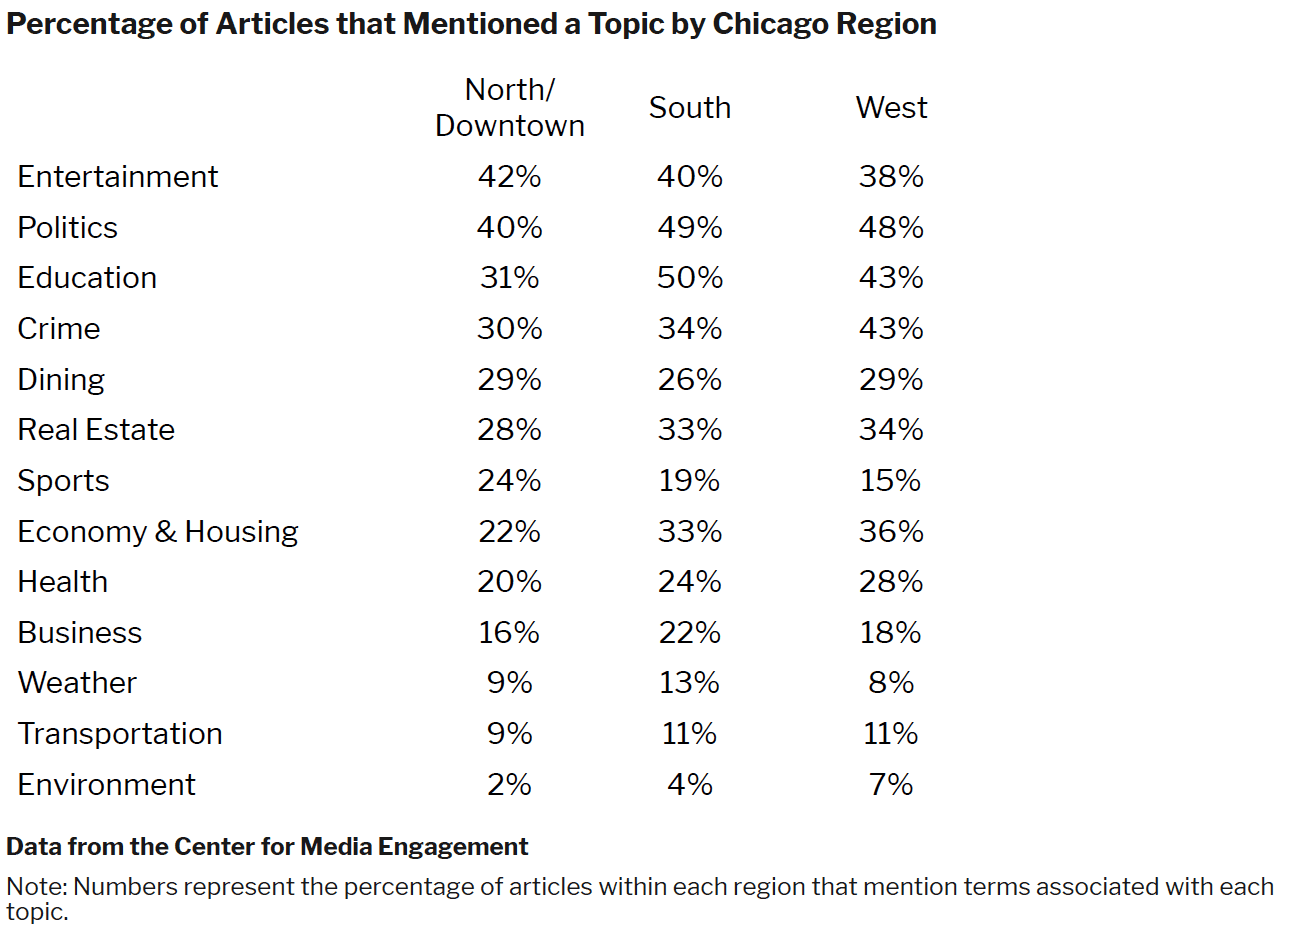
Overall, there was a great deal of similarity across the regions in terms of which topics were covered. There were, however, a few notable differences. Articles with locations on the South and West Sides were more likely to reference education, politics, the economy and housing, and the environment than were articles including North / Downtown locations. Articles referencing the North / Downtown region were more likely to mention sports than articles mentioning other parts of Chicago. Crime was more prevalent in articles about the West Side in comparison to the other two regions.
In addition to looking at whether words associated with particular topics were mentioned in each article, we also looked at the overall topic of each article. For example, an article about the Jussie Smollett attack could mention politics, crime, and entertainment, but the article may only cover the details of the crime in-depth. The table below shows what percentage of articles mentioned an identifiable Chicago location and were primarily about that particular topic.2
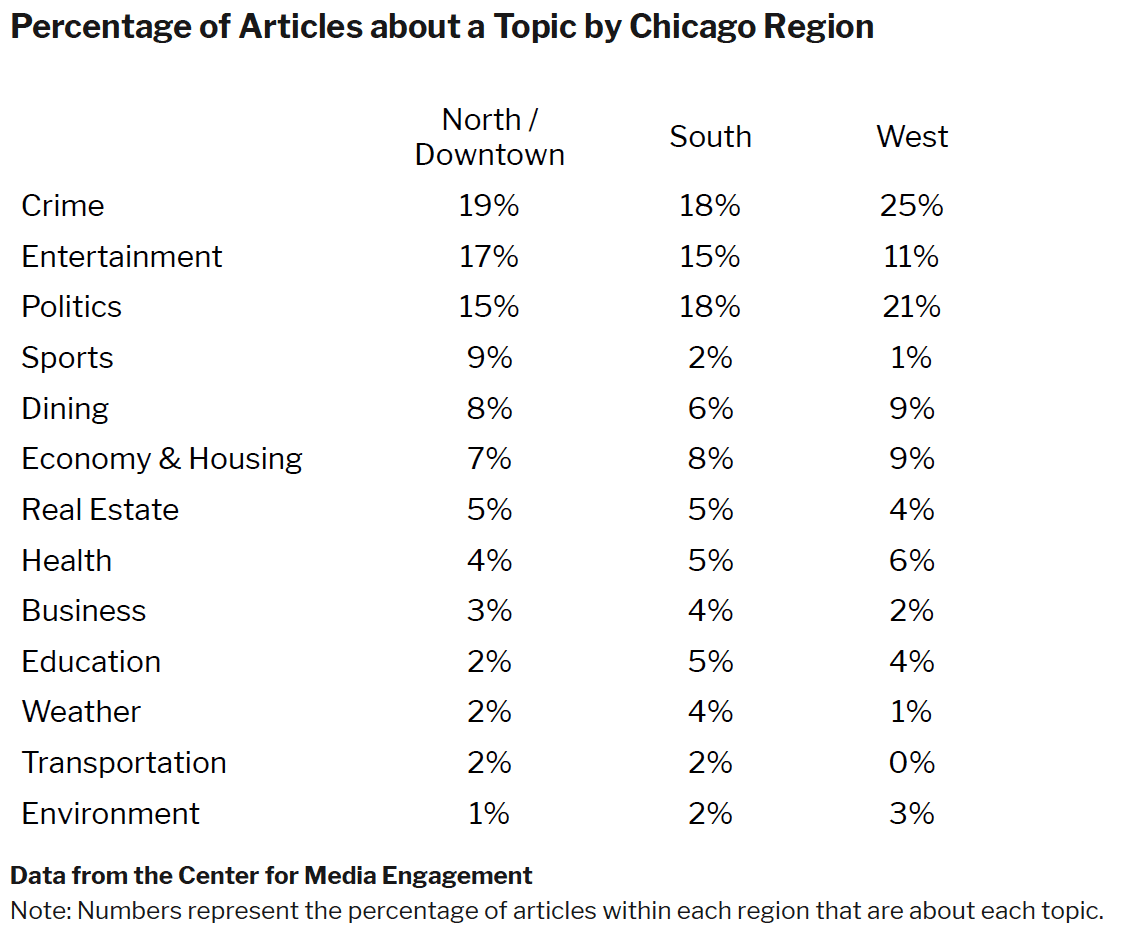
This approach produced several noteworthy patterns. First, crime rose to the top for all regions when we looked at the overall article topic, as opposed to articles that mentioned a particular topic. A quarter of the articles that mentioned a West Side location were about crime, more than the percentage of articles that mentioned a South Side or North / Downtown location. The higher rate of crime coverage for the West Side was consistent across both measurement strategies. Second, although between 30 and 50 percent of articles across the regions mentioned terms related to education, five percent or fewer were actually about education. Third, when we compared the content of the media to the priorities of the Chicago public, there were some discrepancies. According to our survey, the “top five most important issues facing your neighborhood” named by respondents were crime and law enforcement (56.6%), economic and housing issues (21.4%), transportation (6.5%), education (4.4%), and environment (3.6%). Although the highest percentage of articles were about crime, other categories like transportation and the environment receive comparatively less coverage.
Given the importance of crime coverage for survey respondents and in terms of the frequency of articles, we dove more deeply into Chicago’s crime coverage and compared it with actual crime data from the Chicago Police Department.
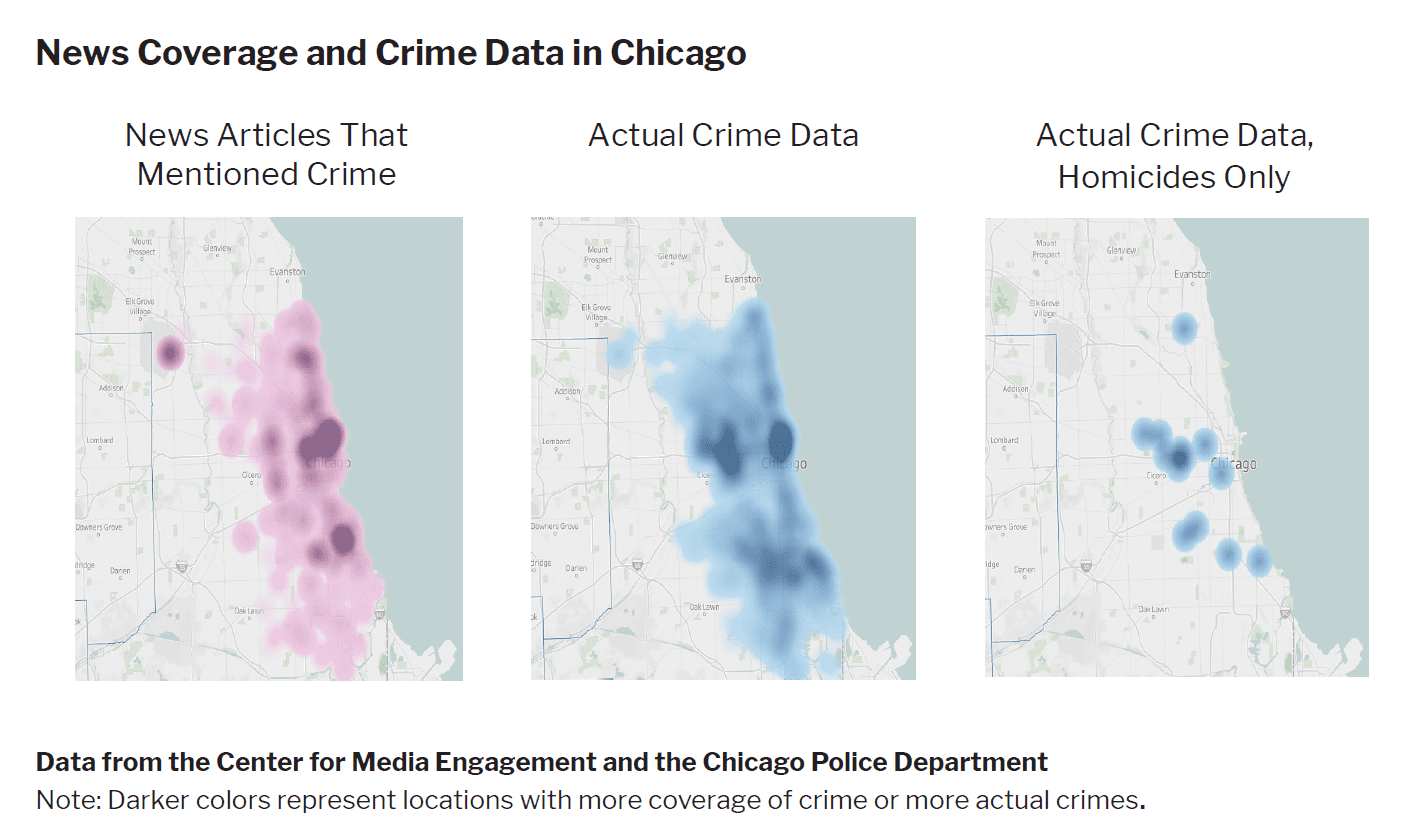
As these charts suggest, there are some differences between the frequency with which crime words were used in articles about particular locations and actual crime data. Crime did appear throughout the city, particularly in Downtown Chicago and on the West Side. Coverage emphasized crime in particular locations. 3 For example, the large dark purple dot at O’Hare Airport corresponded with coverage of two men thought to be associated with the Jussie Smollett case being picked up at O’Hare. As another example, the dark purple dot in South Chicago corresponded with the University of Chicago Medical Center, a location where many crime victims were transported. In the middle crime chart showing all of the crime data, there were high areas of crime in Chicago’s Downtown and West Sides, the latter corresponding with the increased coverage of crime in our content analysis. When isolating homicides only (the third chart), it is clear that crime coverage (the first chart) is not a direct match.
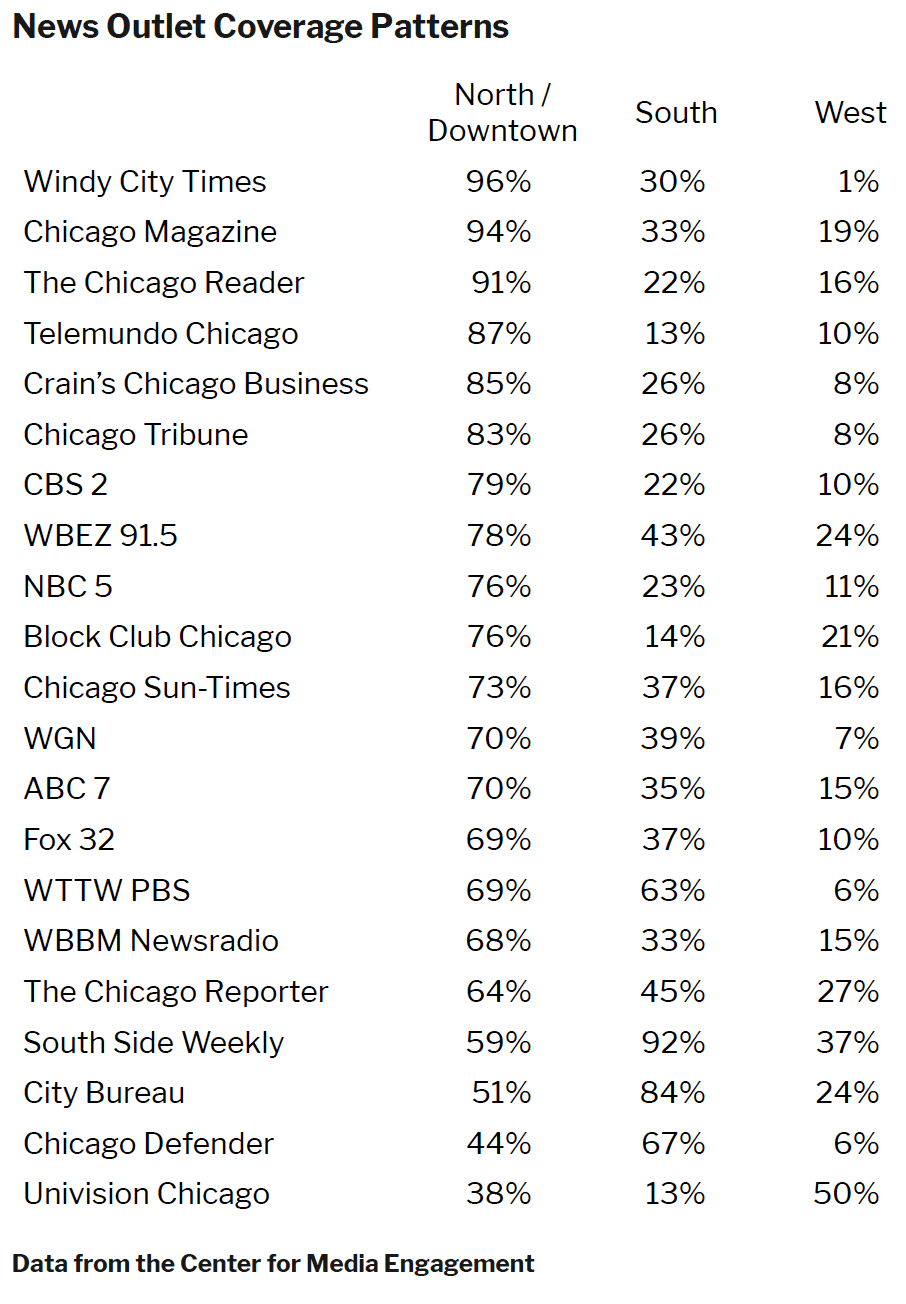
Coverage of Chicago Regions Vary by Outlet
Coverage patterns varied by news outlet, with outlets like Windy City Times and Chicago Magazine mentioning North / Downtown Chicago locations more frequently than South and West Side locations, outlets like South Side Weekly and City Bureau mentioning the South Side locations more often, and Univision Chicago focusing on West Side locations. Ninety percent of the Chicago sources mentioned locations from the North / Downtown region in a majority of their coverage compared to 19% mentioning South Side locations in a majority of their coverage and 5% mentioning West Side locations.
Methods
The purpose of this study was to identify (a) which Chicago-area locations are covered by Chicago news outlets; and (b) which news topics are covered in the different locations. To accomplish this, we collected two weeks of online news articles from Chicago news outlets and created a database of Chicago-area locations and lists of words corresponding with different news topics. The news articles were analyzed for the presence of location names and topic-specific words. Details of each phase of the study are below.
Data Collection and Preparation
Articles
Article data were collected in two stages. The first stage lasted two weeks and involved collecting all article URLs from the homepages of 21 news outlets.4 To do this, we programmed Data Miner – a customizable web-scraping tool available as a Google Chrome extension – to scrape every URL from the homepages of the news outlets. From February 8-22, 2019, at approximately 2:00 P.M. Central Time,5 we initiated a data scrape. At the conclusion of our two weeks of scraping, our dataset consisted of 85,079 total URLs. After removing duplicate URLs, we were left with 10,507 unique URLs. At this point, we manually went through each row of data, deleting all non-article URLs. For example, we removed all URLs to other news website sections (e.g., “sports,” “politics,” “weather,” etc.), advertisements, “about us” pages, classifieds, FAQs, etc. After removal of the non-article URLs, our dataset consisted of 5,463 unique news article URLs.
The second stage of article data collection consisted of programming Data Miner to scrape the headlines, leads (where applicable), and article text for each of the 5,463 news articles. In cases where a URL linked to a video story without an accompanying article, the headline and video description were scraped. This scrape was conducted in April-May, 2019. Most URLs worked and we were able to scrape the article headlines, leads, and text, but some URLs were broken or did not link to relevant articles. For broken or misdirected URLs, attempts were made to find the article using alternate methods, including Google searches for the article titles and searching the respective news organization websites for the articles. In some cases, these tactics were successful, but in the end 177 URLs had to be discarded due to broken links, leaving us with a total of 5,286 articles (consisting of 2,940,880 words) in our dataset.
Chicago Locations
A variety of sources were used to create a custom dataset of Chicago-area locations. Publicly-available government data from data.cityofchicago.org included information about crime locations,6 restaurant health inspections, police and fire stations, libraries, polling places, schools, affordable housing developments, and other public service locations, including cooling and warming centers, public health clinics, and senior centers. Wikipedia, Yelp, and other webpages containing the names of religious institutions, cultural centers, sports venues, neighborhoods, etc. also were scraped using Data Miner. Collecting, combining, and removing duplicates from all these sources resulted in a dataset of 23,250 unique Chicago-area locations.7
News Topics
We examined articles for mentions of 13 news topics, including: business, crime, dining, economy and housing, education, environment, entertainment, health, politics, real estate, sports, transportation and weather. These topics were determined based on an original survey (from a previous study) in which Chicago residents were asked to name the most issues facing their neighborhoods. Eight additional topics were chosen based on their prevalence in the scraped articles. Lists of words unique to each news topic were created using a variety of sources. These included online dictionaries, word association lists, and the original Chicago survey. Words were chosen for inclusion based on their specific association to a particular topic. For example, “home invasion” was included in the crime topic list because of its clear association with crime, but “shooting” was not included because it can be related to crime, sports (e.g., “shooting the ball”), and entertainment (e.g., “shooting a movie”). Each topic list varied in size based on the number of words with clear associations to a particular topic. This resulted in an average topic list containing 75.7 words (SD = 60.7). All 1,171 news topic words were translated into Spanish for analysis of Spanish-language news articles.
Data Analysis
All articles were analyzed to find instances in which (a) place names and (b) words from the news topic lists appeared in the headline, lead, or article text. Prior to analysis, all article text was manually reviewed to remove text that was not specific to an individual article. For example, there were cases in which Data Miner scraped not just the article text from a webpage, but also the list of “most read articles” from a page. These non-article-text portions were manually removed from the dataset. In addition, all words appearing in headlines, leads, articles, location names, and topic lists were processed to remove special characters and conjugation that would prevent matching (e.g., before this processing, “treasonous” and “treason” would not result in a match; after processing, both words would appear as “treason” and would result in a match). This pre-processing was done using Python, and matching places/news topic words to article text was done using R.8
All 5,286 articles in our dataset were analyzed, resulting in 2,135 unique Chicago-area locations appearing at least once in 2,247 articles. No Chicago location matches were found in the remaining 3,039 articles in our dataset.9 We then repeated this analysis process looking for appearances of news topic words in each of the 2,247 location-matched articles. Topic words appeared 55,039 times in our articles dataset. Many of the 2,247 location-matched news articles mentioned multiple topics (e.g., crime and transportation), with news topics being mentioned 6,775 times in the articles.
Mapping
Once articles were matched to location and news topic, R and the Google Maps API were used to collect geographic information (i.e., latitude and longitude) for each location. Using Tableau, an analytics and data visualization platform, we then created maps highlighting each location that appeared in the articles in our dataset, as well as where different news topics were covered. The interactive maps allow users to explore the coverage of different news organizations, locations, and topics.
For some analyses, mapping was used to sub-divide data into three Chicago regions: North / Downtown, South, and West, as was done in a previous Center for Media Engagement study. In total, 1,574 articles mentioned a distinct Chicago location in the North / Downtown, South Side, or West Side.
Reliability of the Topic Mentions Computerized Content Analysis
For each of the 13 topics, we created stratified random samples of 100 articles for people to evaluate through Amazon.com’s Mechanical Turk (MTurk). MTurk is an online service where people can sign up to complete tasks, such as taking surveys, in exchange for payment. The strata included approximately (a) 1/3 articles that did not mention the topic based on our computerized content analysis, (b) 1/3 articles that included 1-2 mentions of the topic based on our computerized content analysis, and (c) 1/3 articles that included 3 or more mentions of the topic based on our computerized content analysis.
In total, 1,300 articles were evaluated by two MTurk workers each in October and November of 2019. The workers were asked: “Did any part of the article mention anything related to <the environment>?” The topic was varied across the 13 topics. The question aimed to assess what we measured in our computerized content analysis, namely, whether the article included a mention of the topic.
When asked whether the article mentioned a topic, the MTurk workers agreed with our computerized content analysis 73% of the time. Inspecting the results further, we found that there was strong agreement when the computerized content analysis indicated that the article did not contain a topic (85%) and when the computerized content analysis indicated that the article contained three or more mentions of the topic (83%). When the article contained only one or two mentions, however, there was considerably more disagreement (49%). To examine the reliability of their evaluations, we used Krippendorff’s alpha, a statistic that varies between 0 and 1 with values greater than 0.80 indicating strong reliability and values greater than 0.67 considered acceptable. Without the 1 and 2 mentions, Krippendorff’s alpha between the computer score and the coders was 0.68, which is considered acceptable reliability.
We had a team of coders evaluate all articles where our computerized content analysis indicated that there were 1 or 2 mentions of a topic separately. Here, our method was to evaluate whether the word counted as a mention of a topic fit in context of that topic. For example, in our computerized content analysis, the word “broadway” was counted as a mention of the entertainment topic. However, in some articles, “broadway” referred to the name of a street in Chicago, not a Broadway theater show.
We created article excerpts by extracting 1,000 characters before and 1,000 characters after the topic mention. Two coders evaluated 300 random excerpts. Here, the reliability was 0.84. We also wanted to ensure that our strategy of looking at only 1,000 characters before and after the topic mention was adequate. We coded 50 articles in full and compared them to our coding of the article snippet. We found few differences between coding the article excerpt and coding the full article (Krippendorff’s alpha = 0.88). We then coded all remaining articles for their topic mentions.
Determining the Article Topic
MTurk workers were asked a second question when evaluating each of the 1,300 articles, “Overall, would you say that this article is mainly about <the environment>?” As before, the topic included in the question was varied across the 13 topics examined. This question aimed to assess whether we could capture the overall topic of each article.
We first examined agreement among the MTurk workers; in 86% of the cases, the two MTurk workers agreed as to whether the article was about a topic or was not (Krippendorff’s alpha = 0.62). For the remaining 14% of cases, we had a third MTurk worker evaluate the article and used the majority code as the final assessment of the article topic. The results are similar if we exclude cases with 1 or 2 mentions (85% agreement, Krippendorff’s alpha = 0.64). Although these alphas are low, the steps that we took to model the data and code discrepancies boost confidence in this technique, as described below.
As we were already coding the article excerpts for the topic mentioned (when the topic was mentioned only 1 or 2 times), we also asked coders to evaluate the article’s overall topic based on the same excerpts. Two coders evaluated 300 excerpts for overall topic with acceptable reliability (Krippendorff’s alpha = 0.74). We also coded 50 articles in full and compared them to the excerpts to evaluate the article topic. We found few differences between coding the article excerpt for overall topic and coding the full article for overall topic (Krippendorff’s alpha = 0.81).
For articles that included zero or three or more mentions of a topic based on our computerized content analysis, we used the MTurk workers’ coding to create a model of whether or not the article was about the topic. In the model, we included the number of words in the article, the topic mentioned, the number of mentions per topic by the number of words (a proportion), and the interaction between the number of words in the article and the topic mentioned. This model was able to correctly classify 87.9% of the decisions (excluding instances where there were one or two mentions of a topic). It correctly classified 94.8% of instances in which the MTurk workers believed that the article was not about the topic and 70.8% of instances in which the MTurk workers believed that the article was about the topic. We used this model to evaluate the topic of all of the remaining articles.
Suggested Citation:
Stroud, Natalie Jomini, Curry, Alex, Murray, Caroline, and Kim, Yujin. (2020, August). Chicago media mapping. Center for Media Engagement. https://mediaengagement.org/research/chicago-media-mapping
- Regions were determined using ZIP codes as follows: North / Downtown: 60601, 60602, 60603, 60604, 60605, 60606, 60607, 60610, 60611, 60613, 60614, 60618, 60625, 60626, 60630, 60631, 60634, 60639, 60640, 60641, 60642, 60645, 60646, 60647, 60654, 60656, 60657, 60659, 60660, 60661, 60707 (part, ending at 43; also Harlem Ave x Belmont Ave x 76th Ave x Wellington Ave); West: 60623, 60624, 60644, 60651; South: 60609, 60615, 60617, 60619, 60620, 60621, 60628, 60629, 60633 (city limits stop just north of Burnham park), 60636, 60637, 60643, 60649, 60652, 60653, 60655, 60827 (part outside of Chicago ends at 138th St, up S. Indiana Ave to river, then follows metro line to 130th St. In some instances, ZIP codes crossed areas, and region was determined as follows: 60608 (north of interstate 55 = West; south of interstate 55 = South); 60616 (north of 18th and east of 90 = North; west of 90 and north of 55 = West; south of 18th, east of 90, south of 55 until it hits 90 = South); 60612 (east of “North Western Ave” = North / Downtown; west of “North Western Ave” = West); 60622 (east of “North Western Ave” = North / Downtown; west of “North Western Ave” = West); 60632 (north of interstate 55 = West; south of interstate 55 = South); 60638 (north of interstate 55 = West; south of interstate 55 = South; north of 65th is the city limits). [↩]
- In 13% of instances, articles were coded as focusing on more than a single topic. [↩]
- The patterns are similar if we look at news articles about crime, as opposed to those that just mentioned crime. [↩]
- We originally included 22 outlets, but WVON was removed from our analysis because the scraped site content was largely not relevant to our study. URLs scraped from WVON’s homepage were either links to station personalities, links to podcasts, or links to old news stories from other Chicago-area news organization websites. [↩]
- On February 16, 2019, the webpages were scraped at 10:00 P.M. Central Time. We do not expect that this single instance of scraping data at 10:00 P.M. instead of 2:00 P.M. would result in any significant changes to this study’s results. [↩]
- The data used to create the crime map came from data.cityofchicago.org. Although we scraped article data from February 8-22, 2019, we plotted crime data from February 7-22, 2019; the 7th of February was added because crimes committed on the 7th might not have made it into the news until the 8th. [↩]
- Some locations/names are not unique to a single location (e.g., “subway” or “addison”). This is the case with chain restaurants, generic names, etc. Automated content analyses, such as the one used here, are unable to identify the exact location of each non-unique location name. Therefore, these non-unique location names were removed from our study. [↩]
- More details about the analysis process: The headlines, ledes, and article texts were separately tokenized after tagging the part of speech using Penn Treebank tags and WordNetLemmatizer from the NLTK (Natural Language Toolkit) package and Python 3.7. Likewise, the list of places was also applied in this process. The tokenizing process solves some linguistic issues such as matching with a plural form of places from the news articles. To increase the accuracy of matching, a blank space was added before and after each word/phrase from the place list, which prevents from capturing the partly matched words (e.g., incorrectly capturing “acre” from the word “massacre”) and was added before and after the conjoined news articles (including the headlines, ledes, and article text). Finally, using R, the dataset was created as a matrix format (5286 x 2135, the total number of the news articles by the total number of place names that appeared in the articles more than once) and coded as 1 if the place name appeared each news article. For English topic words, after preparing for the list of topic words (13 different topics) and the list of articles, through R, each word from the list of each topic was matched to the news articles and coded as the number of occurrences from each article (i.e., the total number of times a word appears in an article). For Spanish topic words, the 13 lists of topic words were translated into Spanish. Then, the “es_core_news_sm” model from SpaCy applied the topic words for tokenizing and the part of speech tagging through Python 3.7. After lemmatizing the Spanish topic lists, a Spanish speaker reviewed the tokens for corrections. With the corrected list of Spanish topic words, the lemmatizing process was applied again for both the Spanish topic lists and articles. Through R, the words from the 13 different topic lists were matched on the Spanish articles and coded as the number of word occurrences that appeared in each article. [↩]
- It is possible that, in some cases, locations were mentioned in some of these 3,039 articles but not captured by our analysis for reasons mentioned in a previously (i.e., some place names were purposefully excluded from our analysis because of our use of automated content analysis). To test this, we coded 25 random articles that did not have a location match, where we found 24 of the 25 articles did not mention a specific location in Chicago. One article mentioned locations in Chicago, but these locations were excluded from our analysis, as they were identified as non-unique location names. When we read 25 random articles that did have a location match, all 25 mentioned Chicago. This corresponds with Krippendorff’s alpha of 0.96. [↩]