


SUMMARY
Throughout the coronavirus pandemic, television news served as a crucial source of information for the public. But our past research showed that coverage of the virus was politicized in ways that seemed to put profit and partisanship above public health, particularly on Fox News and MSNBC. Now our research turns to the advertisers that support this programming.
In an examination of advertiser spending on broadcast and cable news programs between January 2020 and June 2021, we found that spending remained fairly constant on nightly network news programming. On primetime cable news programs, spending increased around the 2020 presidential election and then fell afterward. There is no evidence of any mass exodus or changes in advertising spending for any particular network during this time period. This was true even for healthcare advertisers, who are more likely to be invested in public health outcomes.
Companies can choose where to advertise and consumers can choose where to spend their money and how to allocate their time. By shining a light on advertiser spending, we hope that this report empowers consumers to advocate for change and make informed choices.
BACKGROUND
In 2020 and 2021, primetime cable and nightly network news programming was an important source of information for many. Ratings increased, especially during the early days of the COVID-19 pandemic and throughout the election season.1 In this report, we look at the advertisers that supported news programming during this tumultuous period.
Advertising is a critical driver of cable and broadcast news’ revenue models.2 Given this, we explored whether advertisers changed their spending habits, particularly as the networks faced criticism for their coverage. With respect to COVID-19, criticism ranged from accusing news organizations of “prioritiz[ing] hype over accuracy”3 to denouncing news organizations, especially Fox News, for circulating misinformation.4 Fox News was also criticized for its coverage of January 6th and the aftermath.5
Our past research on how the networks covered COVID-19 in particular provides some justification for these critiques. Early in the pandemic:
- All networks had moments where they shared misleading and incorrect information about COVID-19 that was not immediately accompanied by corrective information. Fox News was the least likely to present correct information about wearing masks after the Centers for Disease Control and Prevention (CDC) released mask-wearing guidelines.
- MSNBC described COVID-19 using words associated with the scale of the virus, such as “problem,” “crisis,” and “outbreak,” more often than Fox News.
- Fox News and MSNBC dedicated more air time to partisans than to health officials and organizations.
Our past work found that viewers received a different story depending on which network they chose. Different information can affect how people act in response to a public health crisis; studies have shown that people had different COVID-19 attitudes and behaviors depending on the outlets that they watched.6 This report hones in on the advertisers supporting these networks.
KEY FINDINGS
Between January 1, 2020 and June 30, 2021, ad spending remained fairly constant on nightly network news programming. On primetime cable news programs, spending increased around the 2020 presidential election and then fell afterward.
There is no evidence of any mass exodus or changes in advertising spending for any particular network during this time period.
Ad spending followed similar patterns even for healthcare advertisers, that were invested in public health outcomes.
OVERALL AD SPENDING
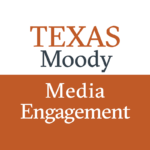
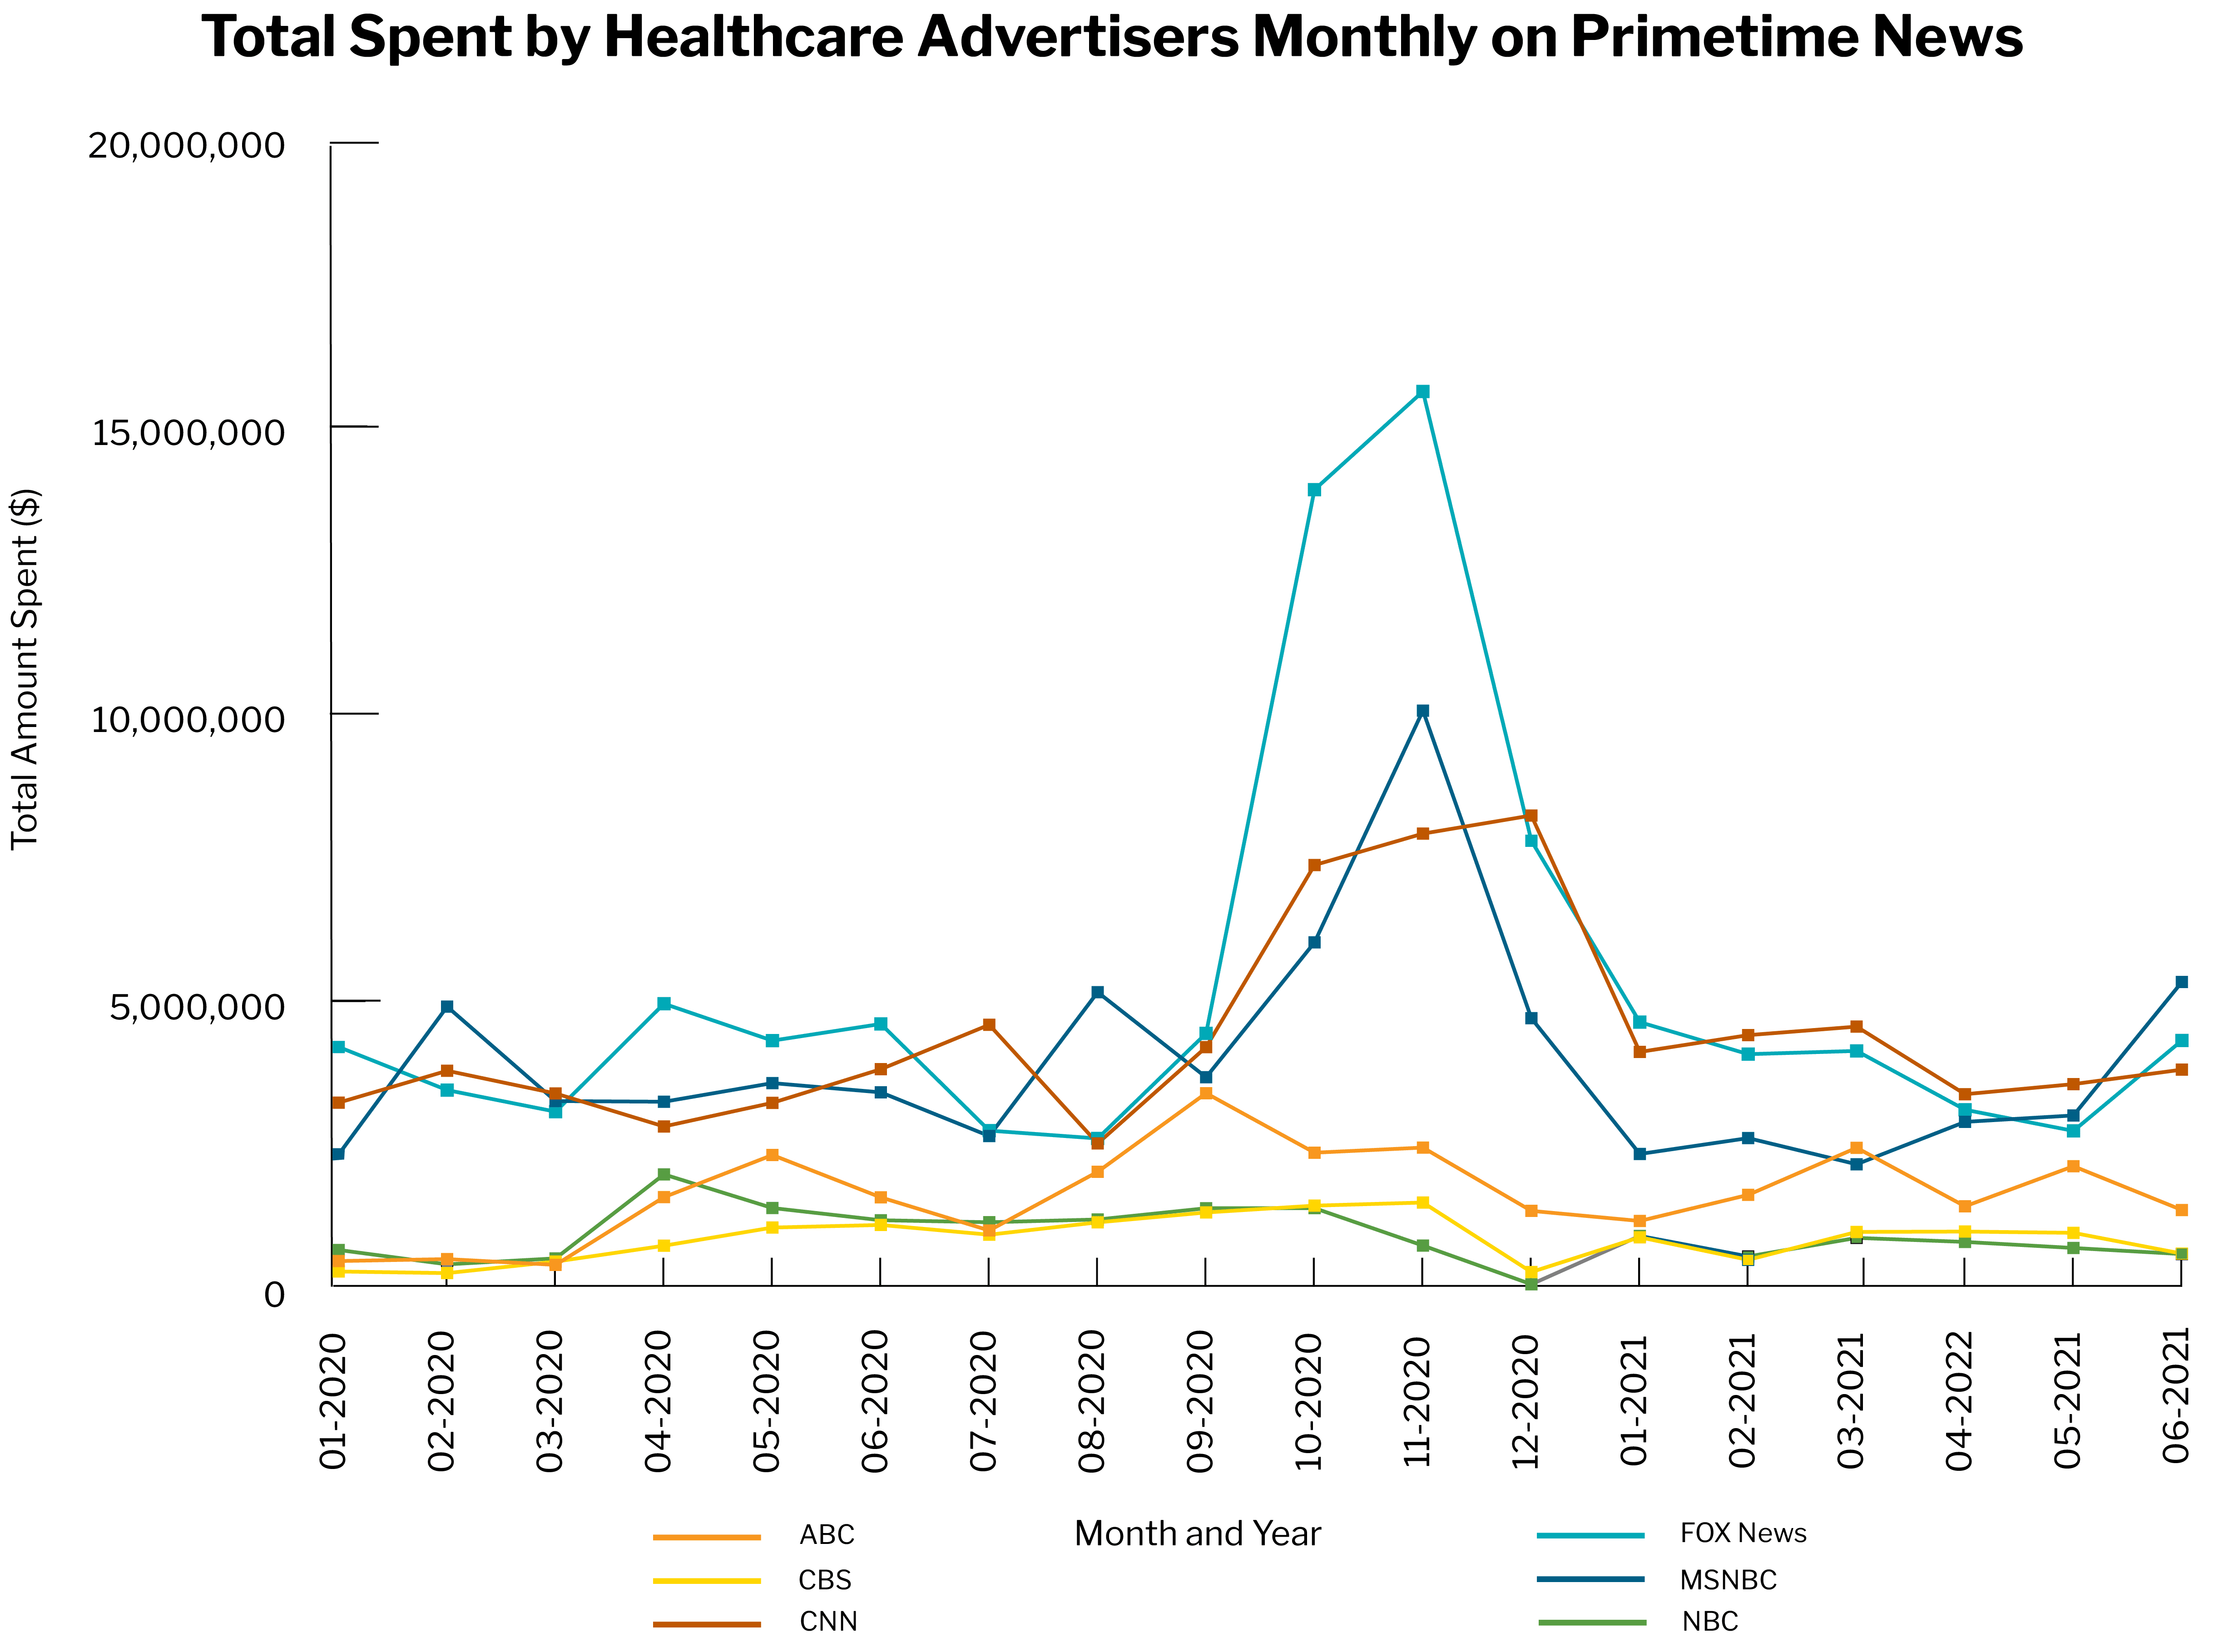
Over two billion dollars ($2.2B) were spent on ads during primetime cable news (5 pm until midnight on CNN, Fox News, and MSNBC) and nightly network news programming on ABC, CBS, and NBC between January 1, 2020 and June 30, 2021. Fox News earned the most in advertising ($622M) and CBS earned the least ($205M).
Advertising spending tended to follow a similar pattern across cable networks (CNN, Fox News, MSNBC). Spending peaked in October and November and declined afterward. Fox News alone, however, had upticks between April and June of 2020.
Compared to advertising spending on primetime cable news, advertising on broadcast news programs didn’t change as much over the course of a year and a half.
TOP FIVE ADVERTISERS BY NETWORK
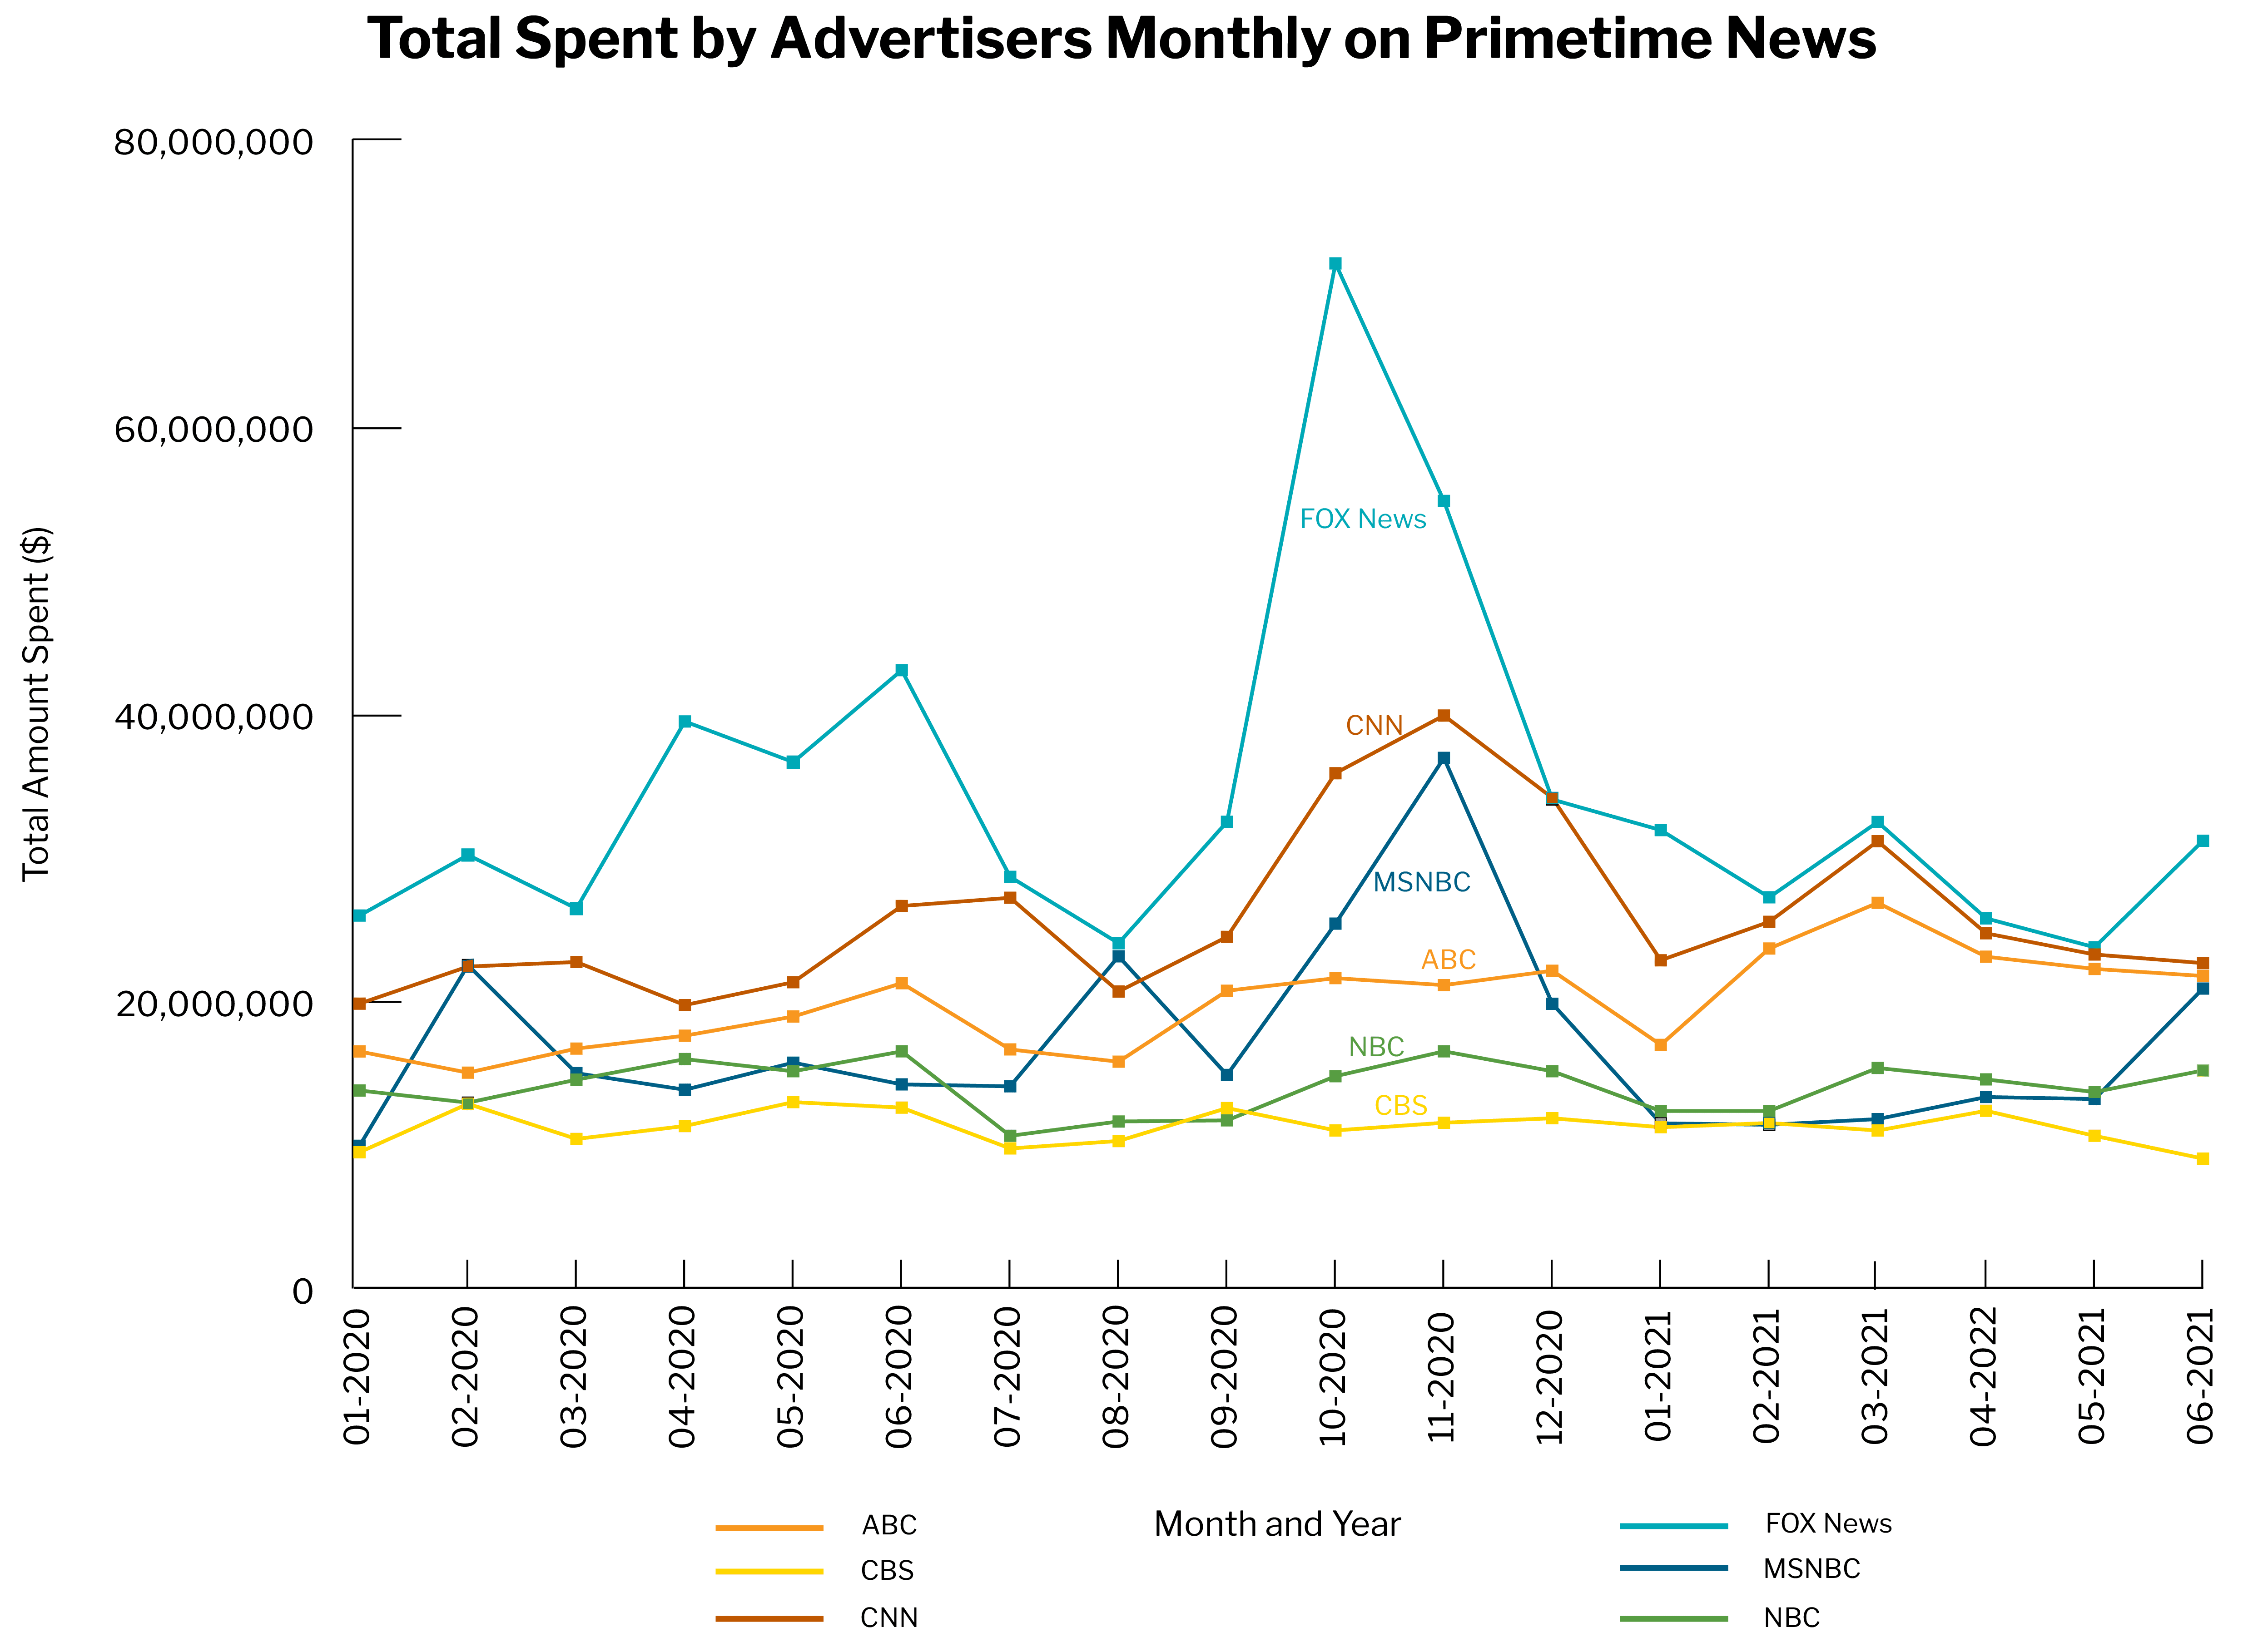
Looking only at the top five advertisers on each network, $287.3M was spent advertising on primetime cable and nightly network news programs. Fox News received the most advertising dollars from its top five advertisers ($87.4M), with MyPillow as the network’s largest advertiser ($44.2M). CBS received the least advertising dollars from its top five advertisers ($27.9M), which was distributed fairly evenly across the five brands. Among the broadcast networks (ABC, CBS, NBC), ABC received the most advertising dollars from its top five advertisers ($61.4M), with Dupixent, a “prescription medicine used to treat moderate-to-severe atopic dermatitis (eczema),” as the network’s largest advertiser ($20.9M).
Some brands spent advertising money on all of the primetime cable and broadcast news programs. For example:
- Insurance company Liberty Mutual advertised on all broadcast and cable networks and was among the top five advertisers for NBC and MSNBC.
- Amazon also advertised on all broadcast and cable networks and was among the top five advertisers for CNN and MSNBC.
- Pharmaceuticals Cologuard, Otezla, and Prevagen advertised on all broadcast and cable networks and were present in CBS’s top five advertisers.
A number of pharmaceutical brands advertised only on the three network news broadcasts: Dupixent, Eliquis, Humira, Ibrance, Prolia, and Xeljanz. Other pharmaceutical brands spent on all three cable news networks during primetime and did not spend on the nightly network news programs:
- Biopharmaceutical companies AbbVie and Gilead advertised on all three cable networks (AbbVie was present in the top 5 advertisers on CNN and MSNBC and Gilead was present in the top 5 on MSNBC).
- The Medicare Benefits & Questions Line advertised on all three cable networks (not present in MSNBC’s top 5 advertisers).
Other brands advertised on a mix of cable and nightly network news programs, but chose only a subset of the six networks we analyzed:
- WeatherTech spent on all networks but CBS (only present among the top 5 advertisers for ABC and NBC).
- Noom Weight Loss spent on ABC, CNN, MSNBC, and Fox News (only present among CNN’s top 5 advertisers).
- Novartis spent on all networks but ABC (only present among MSNBC’s top 5 advertisers).
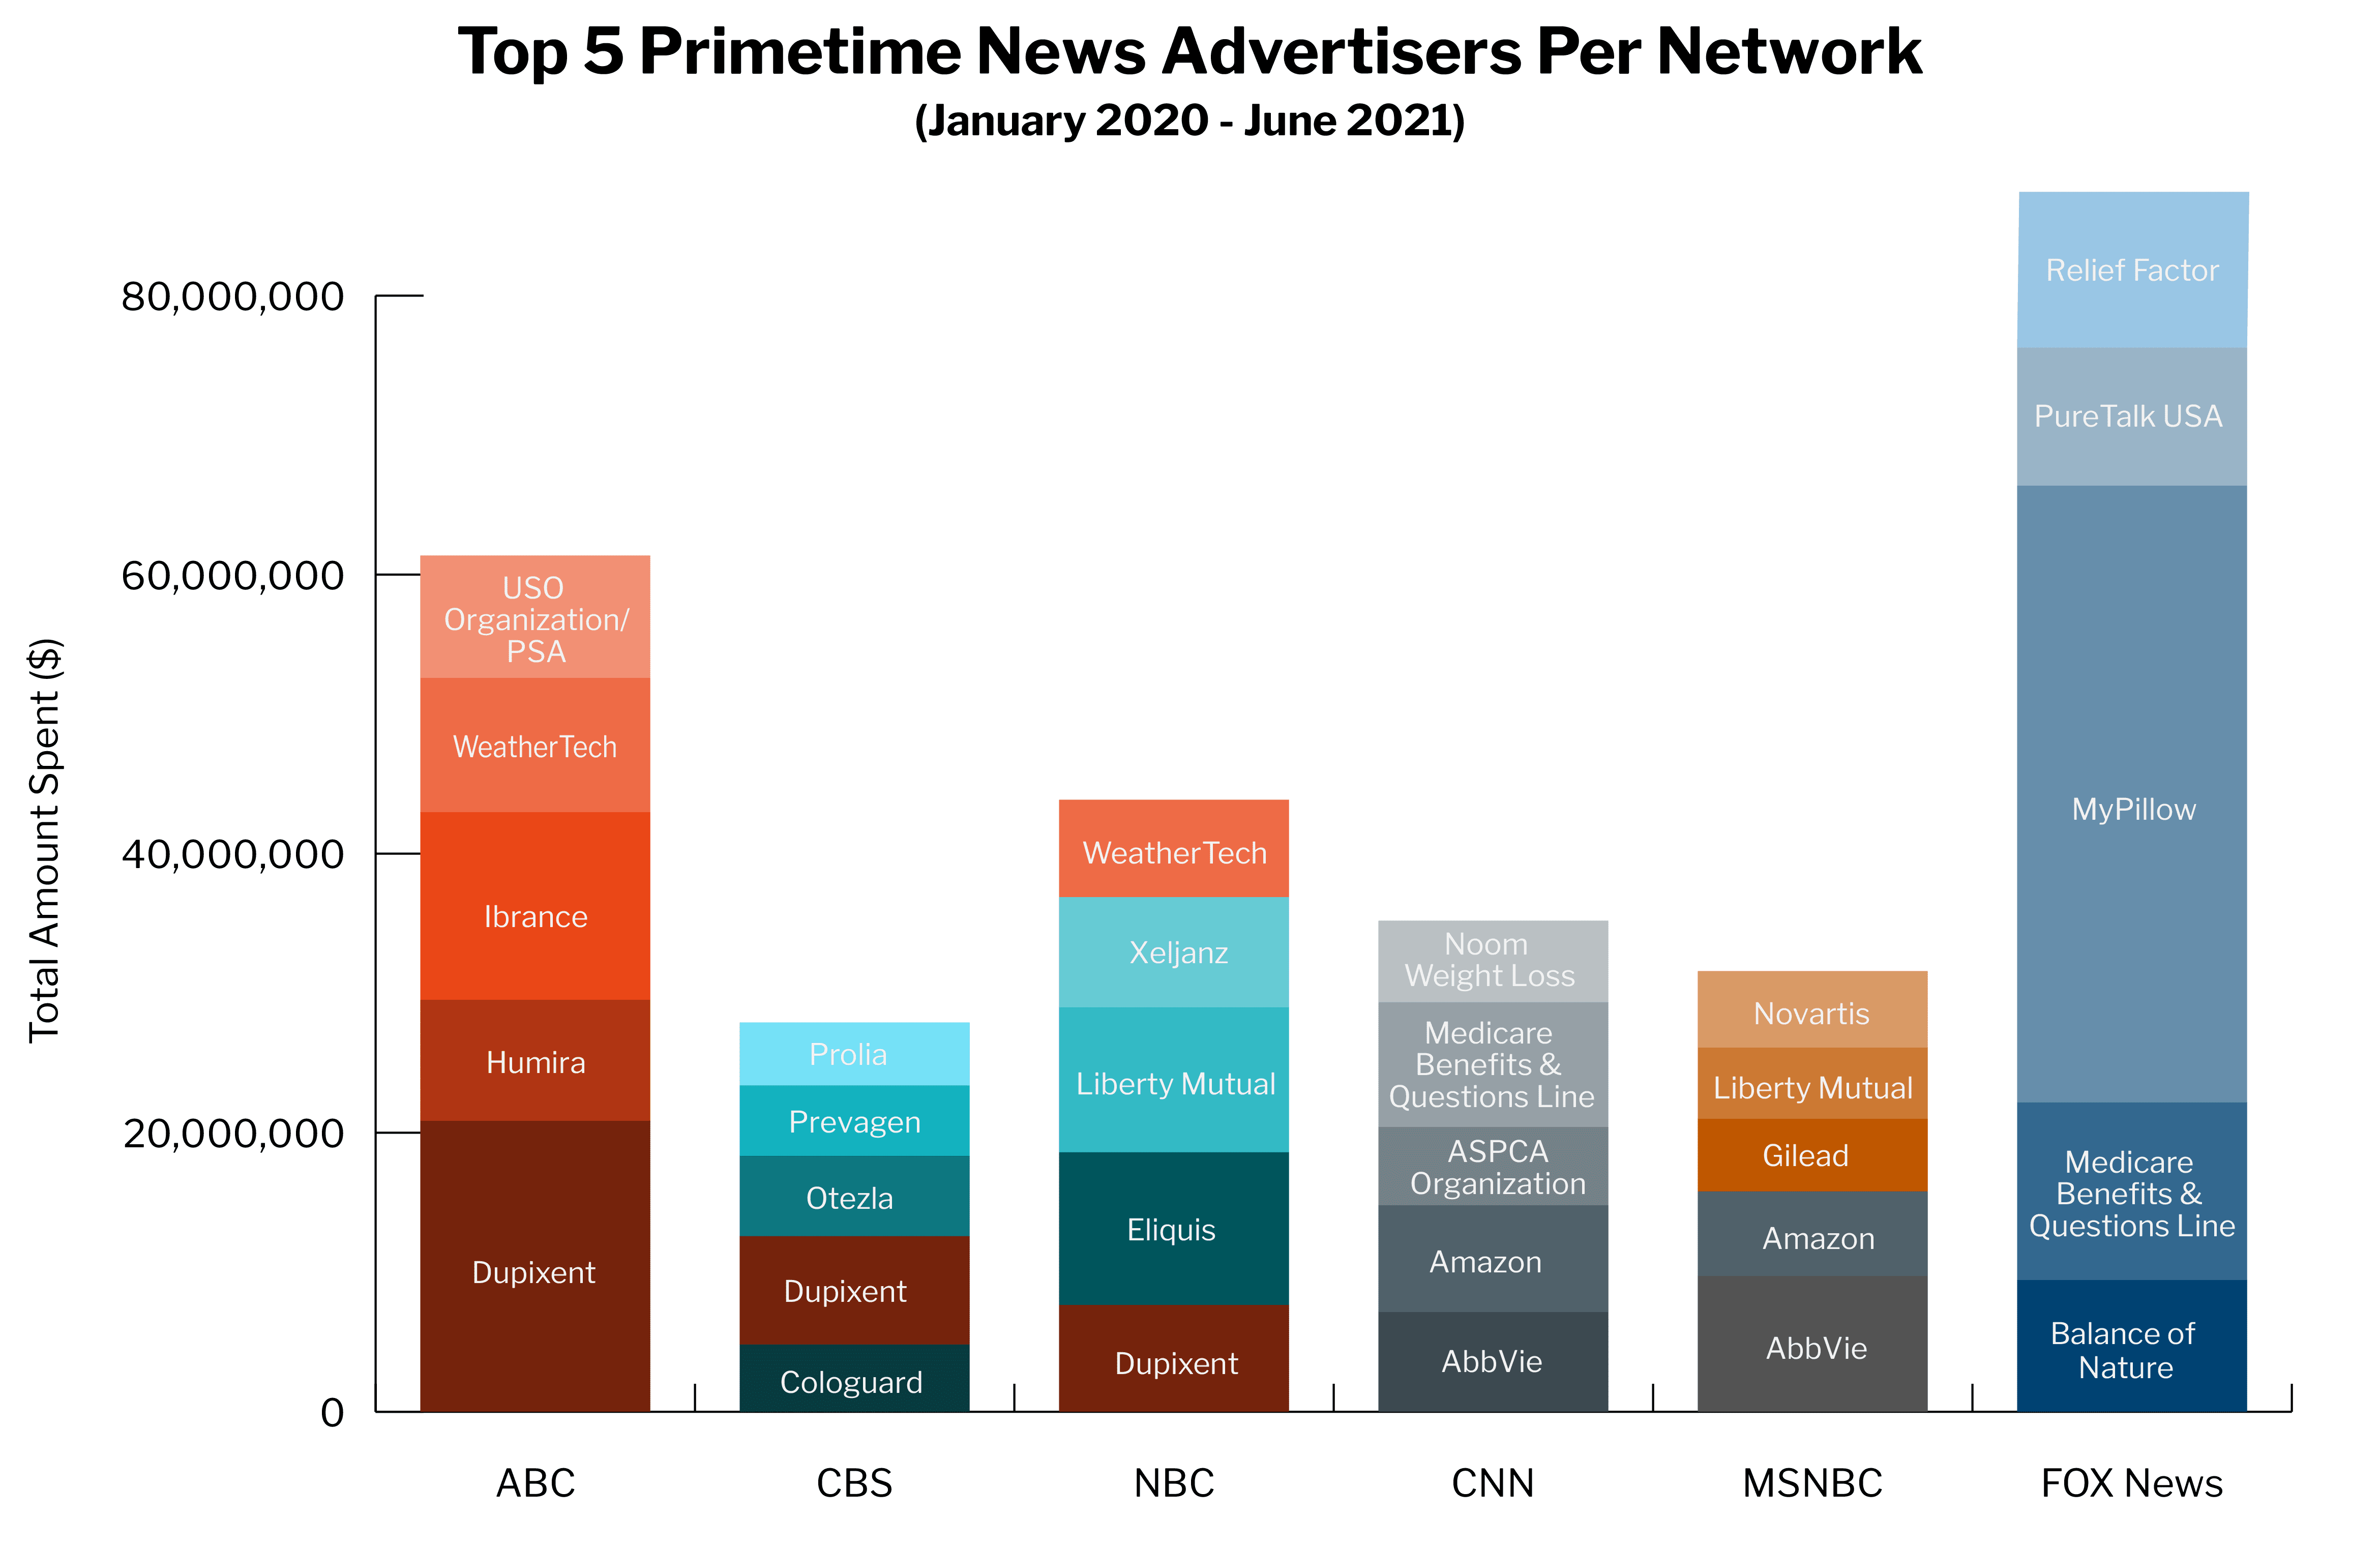
Note: Y-axis levels of spending vary across networks.
Looking at how spending varied over time for each station’s top five advertisers, several brands spent similar amounts on certain channels. For instance:
- Between January 2020 and June 2021, immunosuppressant drug Humira spent similar amounts each month on ABC, as did supplement Prevagen on CBS. Biopharmaceutical company AbbVie’s spending also remained fairly constant on CNN.
- Between October and December 2020, Amazon spent similar amounts on CNN ($1.8M) and MSNBC ($1.5M). WeatherTech also spent similar amounts on ABC ($1.9M) and NBC ($2.1M) during this timeframe.
Other brands varied over time. For example:
- Prescription medicine Dupixent began to spend more on broadcast news advertising in July 2020 and continued to spend until December 2020, possibly coinciding with allergy Brand spending was highest on NBC in August, on CBS in September, and on ABC in December.
- The Medicare Benefits & Questions Line started to spend more on advertising in September and showed peaks in November on CNN and Fox News, overlapping with the open enrollment period from October 15 through December 7.7
- Biopharmaceutical company AbbVie and global healthcare company Novartis had peak spending on MSNBC in November.
- MyPillow had high levels of spending on Fox News from March 2020 to February 2021, with notable peaks in April, June, and October.
- Some brands spent less around the time of the election compared to other months, such as prescription medicine for bone health Prolia on CBS and insurance company Liberty Mutual on NBC.
HEALTHCARE ADVERTISERS
We also examined the advertising behavior of healthcare-related organizations.8 Our definition of these organizations included healthcare entities that were likely to be invested in the public health outcomes, such as clinics and hospitals, health advocacy groups, medical research organizations, health insurance companies, pharmaceutical companies, and government agencies like the CDC. Advertisers like fitness centers, weight loss programs, or specific medications, vitamins, supplements, or other products unrelated to COVID-19 were not included in this definition. For a full list of organizations that were included or excluded from our definition of healthcare-related organizations, please see the method section of this report.
Healthcare advertisers spent $307M on nightly network news programs and primetime cable news programs. Fox News received the most money from healthcare advertisers ($94.7M) and CBS received the least ($15.5M). Among the broadcast networks, ABC received the most advertising dollars from healthcare providers ($29.7M).
As with spending across all brands, healthcare advertisers spent a fairly consistent amount on the broadcast nightly news programs. Spending on primetime cable news programming peaked in October and November of 2020, especially on Fox News.
The top five healthcare advertisers per network spent a total of $132M across the six networks. Fox News earned the most ($37M), with Medicare Benefits & Questions Line as the largest advertiser ($12.7M). CBS earned the least ($8.7M) from its top five healthcare advertisers. Among the broadcast networks (ABC, CBS, NBC), ABC earned the most from its top five healthcare advertisers ($19M), with the Centers for Disease Control and Prevention (CDC) as the largest advertiser ($5.7M).
There was variation in how advertisers spent across the networks:
- The S. Department of Health & Human Services and Bausch & Lomb paid for advertisements on the three broadcast networks.
- Fluzone High-Dose and com paid for ads on CBS and NBC.
- AbbVie spent advertising dollars on CNN, MSNBC, and Fox News.
- The Medicare Benefits & Questions Line and Shriners Hospitals For Children paid for advertising on Fox News and CNN.

THE STRUCTURE OF NEWS ADVERTISING
We looked for clusters of advertisers that had similar spending habits to understand how the brands advertised across the networks.
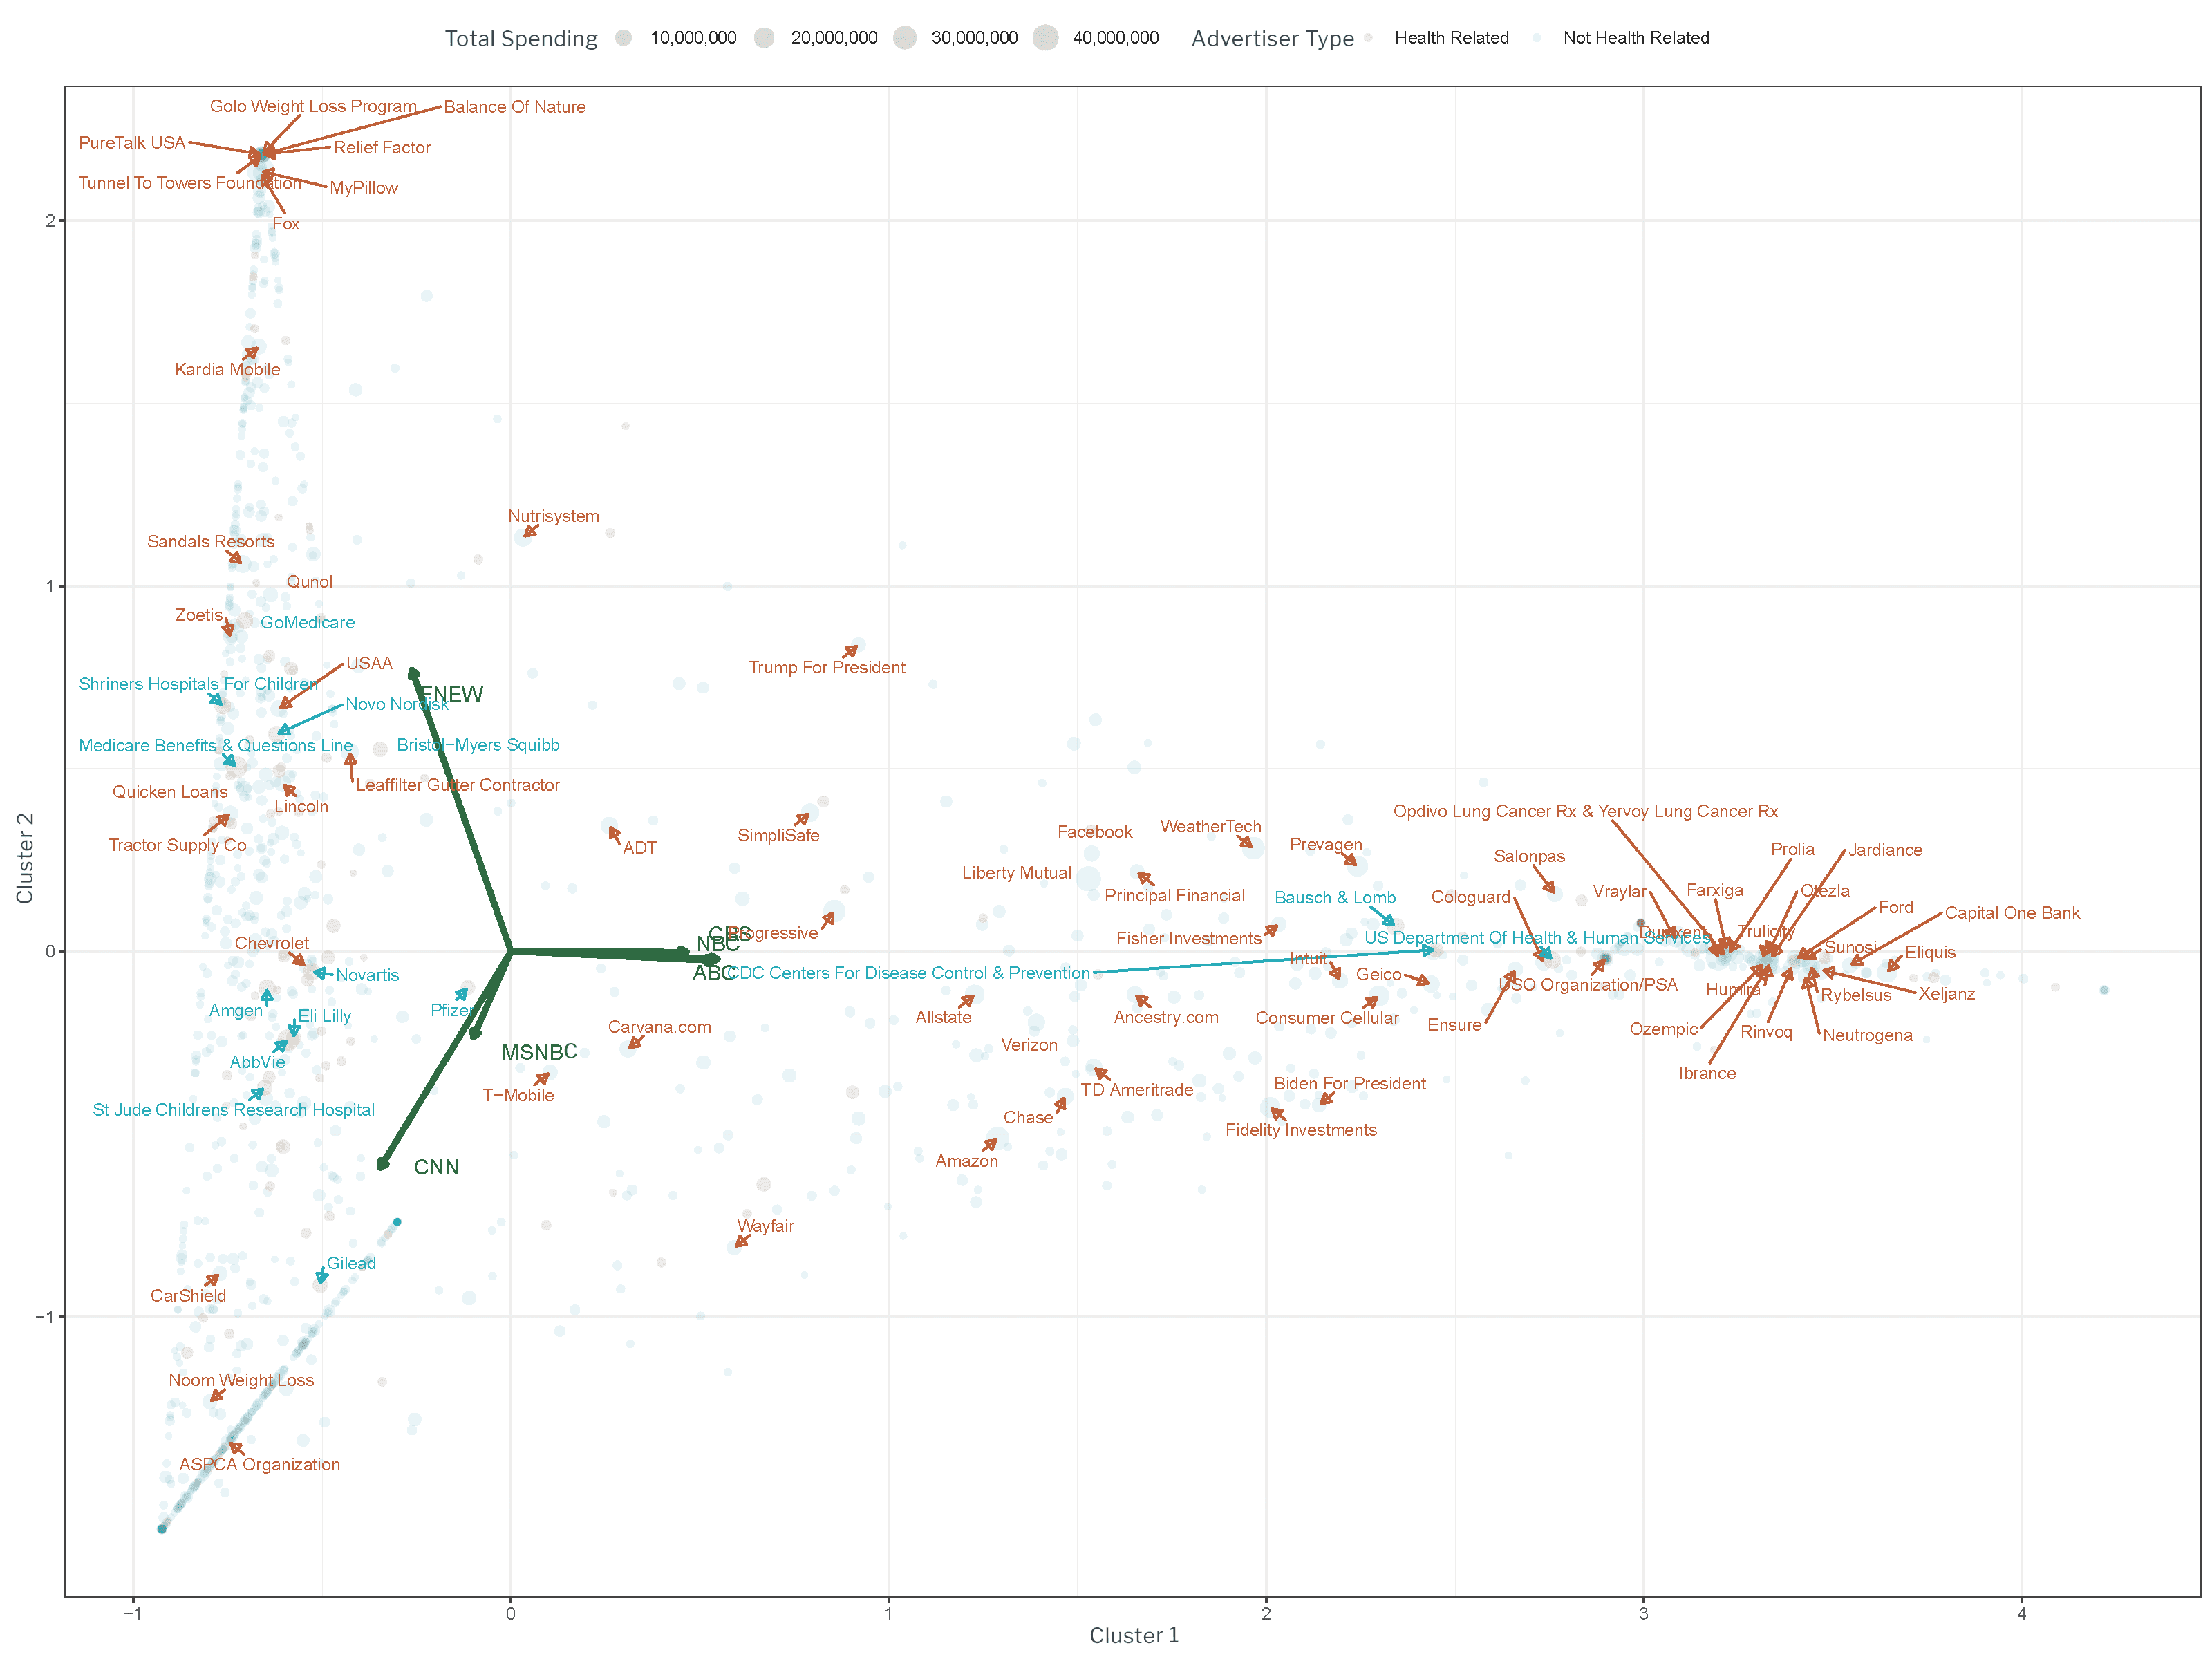
The figure, which shows the relationship between advertisers and networks, includes several notable findings:
- The most important distinction is between the broadcast news and cable news When looking from left to right (along the x-axis), the cable news networks are further to the left and the broadcast news networks further to the right. This means that there are meaningful differences in ad spending across these networks.
- The second most important distinction is between CNN / MSNBC and Fox News, which can be seen by looking from the top to the bottom of the chart (along the y-axis). The chart shows that Fox News advertising is different from CNN and MSNBC advertising.
- Advertisers that are among the top 5% of brands in terms of ad spend are labeled in the chart and all other advertisers in the dataset are shown with a corresponding There is a clear cluster of advertisers that spent predominately on broadcast news (e.g., Capital One Bank and anticoagulant medication Eliquis), some spent primarily on Fox News (e.g., GOLO weight loss program and supplements, Relief Factor, and Balance of Nature), and others primarily spent on CNN and MSNBC (American Society for the Prevention of Cruelty to Animals (ASPCA) and Noom weight loss program).
- Healthcare advertisers are marked in orange and others are in blue. Overall, the patterns observed for healthcare advertisers are similar to those in other sectors.
Overall, this report shows that advertising behavior varied over the course of 2020 and in the first half of 2021. For example, we see heightened cable news advertising spending around the election. Yet we find little evidence that advertisers in general changed their behavior in response to the events that occurred during this time frame.
METHOD
Data were provided by Kantar Media/CMAG between January 1, 2020 and June 30, 2021 on CNN, Fox News, and MSNBC between 5pm and midnight and the nightly news programs on ABC, CBS, and NBC.
Kantar Media/CMAG tracks advertising on national broadcast and cable networks, providing a cost estimate for each spot and the spot count based on the number of times a creative has appeared.
To visualize the advertisers across the networks, we used PCA (Principal Component Analysis), a dimensionality reduction technique. This technique is commonly used to explain the variance observed in a dataset and reveal underlying factors that drive such variation. To perform PCA analysis, we first generated a matrix of six columns and 1651 rows, where the columns correspond to the broadcast and cable news networks and rows correspond to the brands. Each entry in this matrix represents the proportion of dollars the brand spends on that particular network. In other words, values across columns for each row sum up to one. This matrix is then scaled and centered before applying principal component analysis. A key to making sense of the projected data is the semantic interpretation of the new axes (the principal components). To do so, we plotted the biplot of the corresponding model. Here both the features (how much a brand invests ad dollars on a particular network) and brands themselves are visualized to assist in the interpretation. Our PCA analysis shows that the first two principal components explain 54% of variance in brand ad investment strategies.
As we describe in the text, we isolated healthcare advertisers for analysis. Under the definition used in this report, the following types of organizations were identified as healthcare-related: clinics, doctors’ offices, government agencies involved in healthcare, health advocacy organizations, health insurance companies, hospitals, medical research centers, pharmacies, pharmaceutical companies, public service announcements related to health, telehealth companies, urgent care centers, and vaccine-related advertisers. Under the definition used in this report, dental products, fitness/weight loss classes, food products branded as healthy, skincare products, or specific medications, supplements, vitamins, or other products unrelated to vaccines or COVID were not included as healthcare-related advertisers. More details about our categorization of healthcare advertisers and alternative categorizations can be found here.
Thank you to the funders that make the Center for Media Engagement’s work possible: Mark Gibson, CEO Capital Markets, JLL Americas; The William and Flora Hewlett Foundation; the John S. and James L. Knight Foundation; and Democracy Fund.
SUGGESTED CITATION:
Budak, C., Kim, Y., Murray, C., Muddiman, A., and Stroud, N. J. (March, 2022). Advertiser spending on primetime news throughout the coronavirus pandemic. Center for Media Engagement. https://mediaengagement.org/research/ad-spending-on-primetime-news-coronavirus
- Ted Johnson. (December 24, 2020). Cable news networks see big gains in viewership during tumultuous 2020. Deadline. https://deadline.com/2020/12/ratings-cable-news-networks-2020-1234660751; News programs see ratings soar during coronavirus pandemic. (March 25, 2020). Associated Press. https://www.marketwatch.com/story/news-programs-see-ratings-soar-during-coronavirus-pandemic-2020-03-25 [↩]
- As the Pew Research Center notes, license (affiliate) fees and advertising are the two main sources of revenue for cable news, https://www.pewresearch.org/journalism/fact-sheet/cable-news/. Pew also considers only advertising when discussing economics for network news programming https://www.pewresearch.org/journalism/fact-sheet/ network-news [↩]
- Joe Ferullo. (August 8, 2021). Confused about COVID: Too many news outlets prioritize hype over accuracy. The Hill. https://thehill.com/opinion/technology/566900-confused-about-covid-too-many-news-outlets-priori-tize-hype-over-accuracy [↩]
- Philip Bump. (November 8, 2021). The unique role of Fox News in the misinformation universe. Washington Post. https://www.washingtonpost.com/politics/2021/11/08/unique-role-fox-news-misinformation-universe [↩]
- Michael M. Grynbaum. (January 9, 2021). As Trump reels, Fox News has a message for viewers: Stick with us. The New York Times. https://www.nytimes.com/2021/01/09/business/media/fox-news-trump-tv.html [↩]
- See Gollwitzer, A., Martel, C., Brady, W. J., Pärnamets, P., Freedman, I. G., Knowles, E. D., & Van Bavel, J. J. (2020). Partisan differences in physical distancing are linked to health outcomes during the COVID-19 pandemic. Nature Human Behavior, 4, 1186–1197. doi: 10.1038/s41562-020-00977-7; Jurkowitz, M., & Mitchell, A. (2020). Cable TV and COVID-19. Pew Research Center. https://www.journalism.org/2020/04/01/cable-tv-and-covid-19-how-ameri- cans-perceive-the-outbreak-and-view-media-coverage-differ-by-main-news-source; Kaiser Family Foundation. (November 8, 2021). COVID-19 misinformation is ubiquitous. https://www.kff.org/coronavirus-covid-19/press-release/covid-19-misinformation-is-ubiquitous-78-of-the-public-believes-or-is-unsure-about-at-least-one-false-statement-and-nearly-at-third-believe-at-least-four-of-eight-false-statements-tested; Simonov, A., Sacher, S. K., Dubé, J.-P. H. & Biswas, S. (2020). The persuasive effect of Fox News: Non-compliance with social distancing during the Covid-19 pandemic. NBER working paper. doi: 10.3386/w27237 [↩]
- https://www.medicare.gov/blog/medicare-enrollment-period-2020 [↩]
- Two coders evaluated 20% of the unique advertisers in the dataset to evaluate reliability. The two coders were reliable (Krippendorff’s alpha = 0.89). [↩]