


The Problem
Public trust in the news media has been in decline for the past 40 years.1 This is a problem for news organizations and the public alike. News organizations face not only skeptical audiences, but also competition from a proliferation of outlets peddling false information. The public must sift through the multiplicity of news outlets, stories, and journalists and decide what can be trusted.
Key Findings
Study results indicate that the presence of these Trust Indicators affected how participants evaluated a news webpage created for the purposes of this study. Results show that:
- Evaluations of the news organization were higher when indicators were present.
- Evaluations of the reporter who wrote the article were higher when indicators were present.
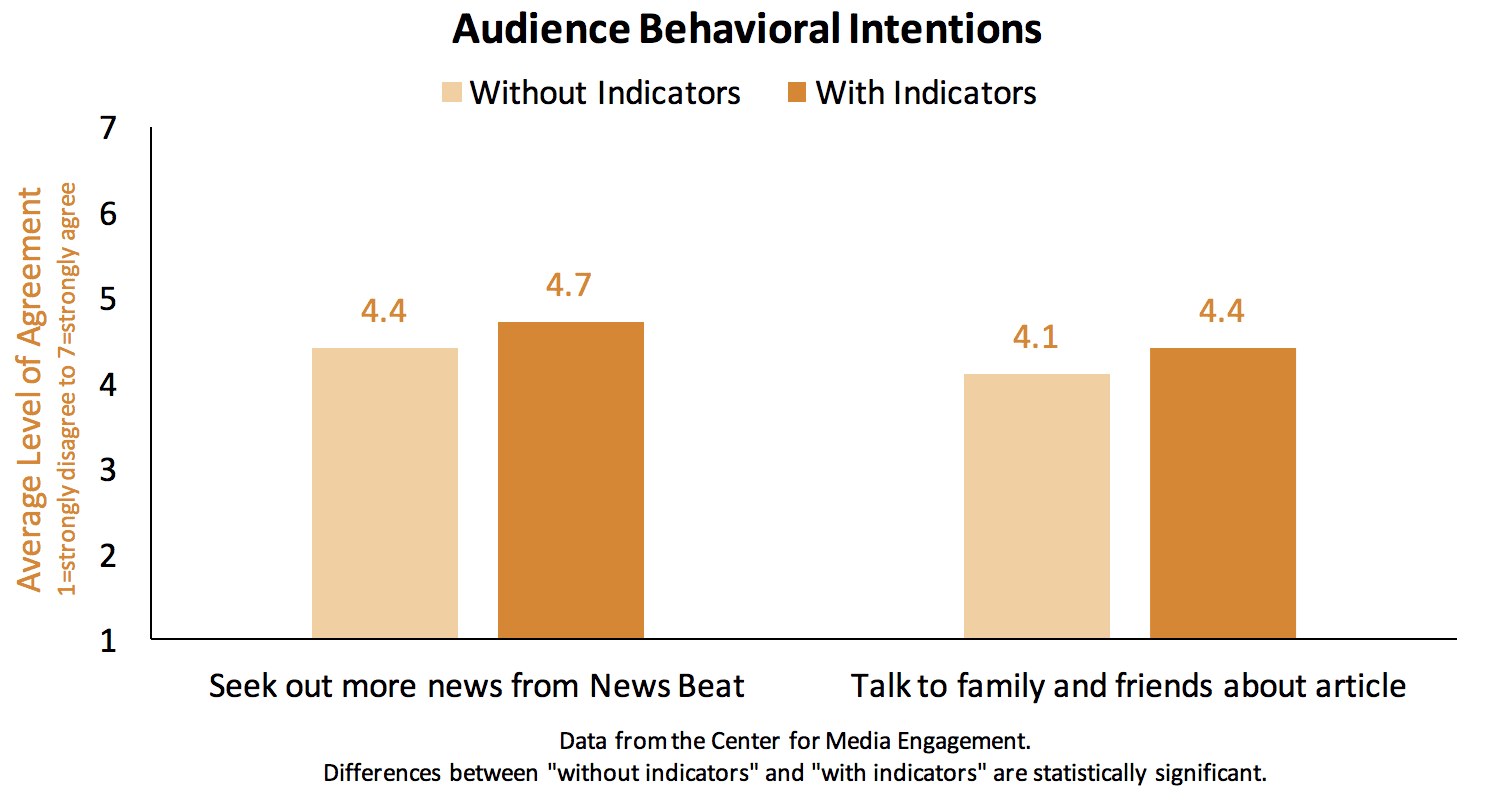
- Audience intentions to seek out more news from the news organization and visit with others about the article increased with the presence of the Trust Indicators.
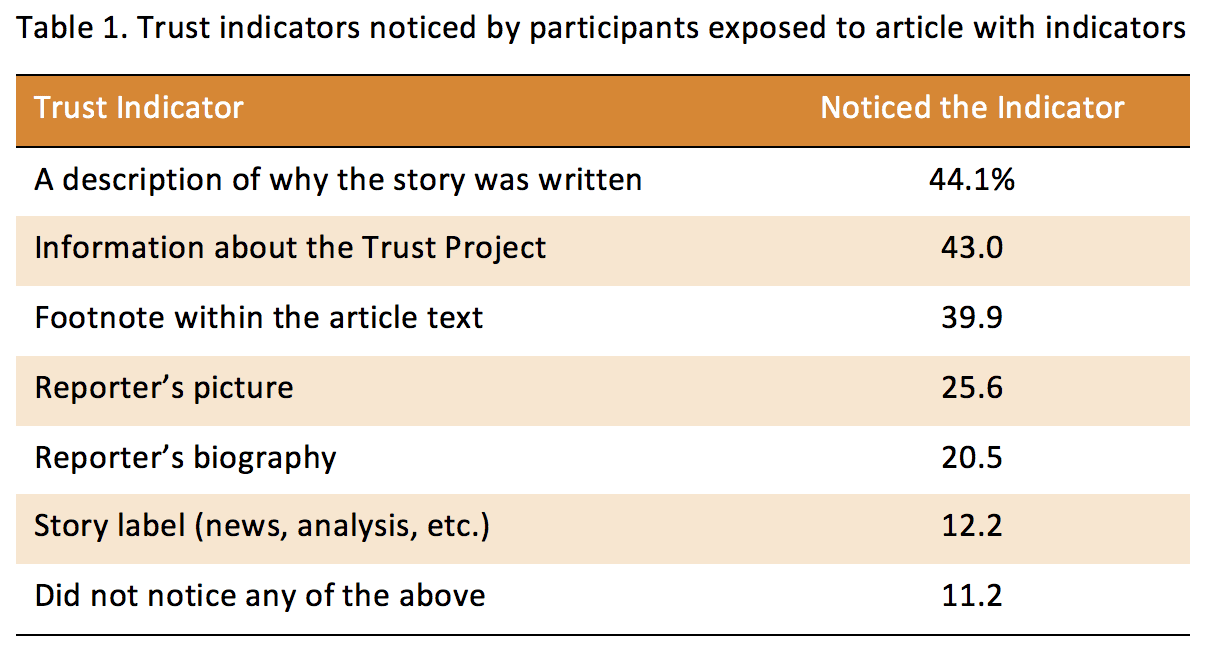
- The most frequently noticed indicators were the description of why the story was written (noticed by 44%) and information about the Trust Project (noticed by 43%).
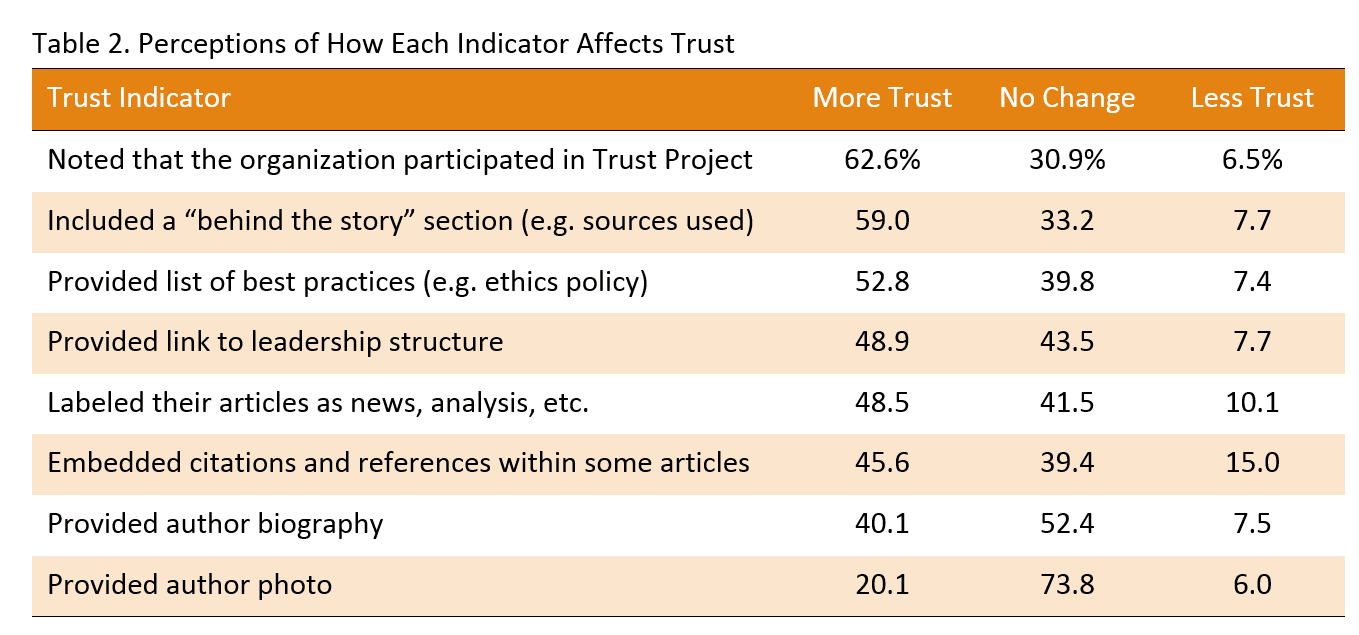
- A majority of participants thought that noting a news organization was participating in the Trust Project would increase their trust (63%), as would including a “Behind the Story” section (59% thought it would increase trust) and providing a list of best practices such as ethics, diversity and corrections policies (53%).
Implications for Newsrooms
Today, many question the veracity of the news that they consume, and it is not hard to blame them for their skepticism. Trusted news organizations shutter, while new, untested outlets pop up. Add to this mix “news” websites that are created with the express purpose of spreading misinformation. What’s more, there is a steady cry of “don’t trust the media” coming from politicians and others. With all of this confusion, news consumers can find themselves befuddled and distrustful.
Our findings suggest that news organizations have ways to signal trustworthiness to their audience. The Trust Indicators tested in our experiment led participants to feel a greater sense of trust in the news. Although we tested the indicators together, as opposed to one indicator at a time, questions appearing near the end of our survey revealed that trust seems most likely to be gained when a news outlet is open about its reporting practices and standards. Sharing why and how a story was written and parting the curtain on the organizational leadership structure are a few of the tested ideas that show promise. As newsrooms grapple with ways to win over doubting audiences, we find the study results encouraging.
As with any study, this one is not without its limitations. As we already noted, we don’t know which indicator, or combination of indicators, was responsible for the observed effects. Future research will have to disentangle their effects. More importantly, we note that the results are for a mock news site that was unknown to the study participants. It’s not clear how people will respond to the Trust Indicators on more familiar news sites. It is important to note, however, that audiences don’t always pay attention to the media brand when consuming news.2 The results here, however, demonstrate that Trust Indicators can affect what people think about the news.
The Study
The Center for Media Engagement at the University of Texas at Austin conducted an experiment, funded by the Trust Project, to test ways in which trust in online news might be affected by the presence of several transparency-related indicators. Our findings, detailed in this report, suggest that news outlets can take steps to improve the public’s trust.
In the experiment, 1,183 U.S. adults read an online news article (about politics, science, or the arts) that contained, at random, either “Trust Indicators” or no Trust Indicators. The Trust Indicators are news transparency standards designed by the Trust Project, an international consortium of news organizations “collaborating… to build a more trustworthy and trusted press.”3 The Trust Indicators were created to make it easier for people to assess the credibility of the news. The Trust Indicators we tested were:
- The reporter’s picture and job title, with a link to a biography, expertise, languages spoken, contact information, and recent work;
- A label indicating that the article was “analysis” (as opposed to “opinion,” “news,” “review,” or “advertiser content”), with a link to Trust Project-defined article types;
- Footnotes within the article text that offered source material;
- A “Behind the Story” section that described why and how the article was written, including sources and a reference to best practices; and
- Information about the news organization’s participation in the Trust Project, with a link to best practices policies on ethics, diversity, corrections, ownership, etc.
EVALUATIONS OF NEWS ORGANIZATIONS HIGHER WITH INDICATORS PRESENT
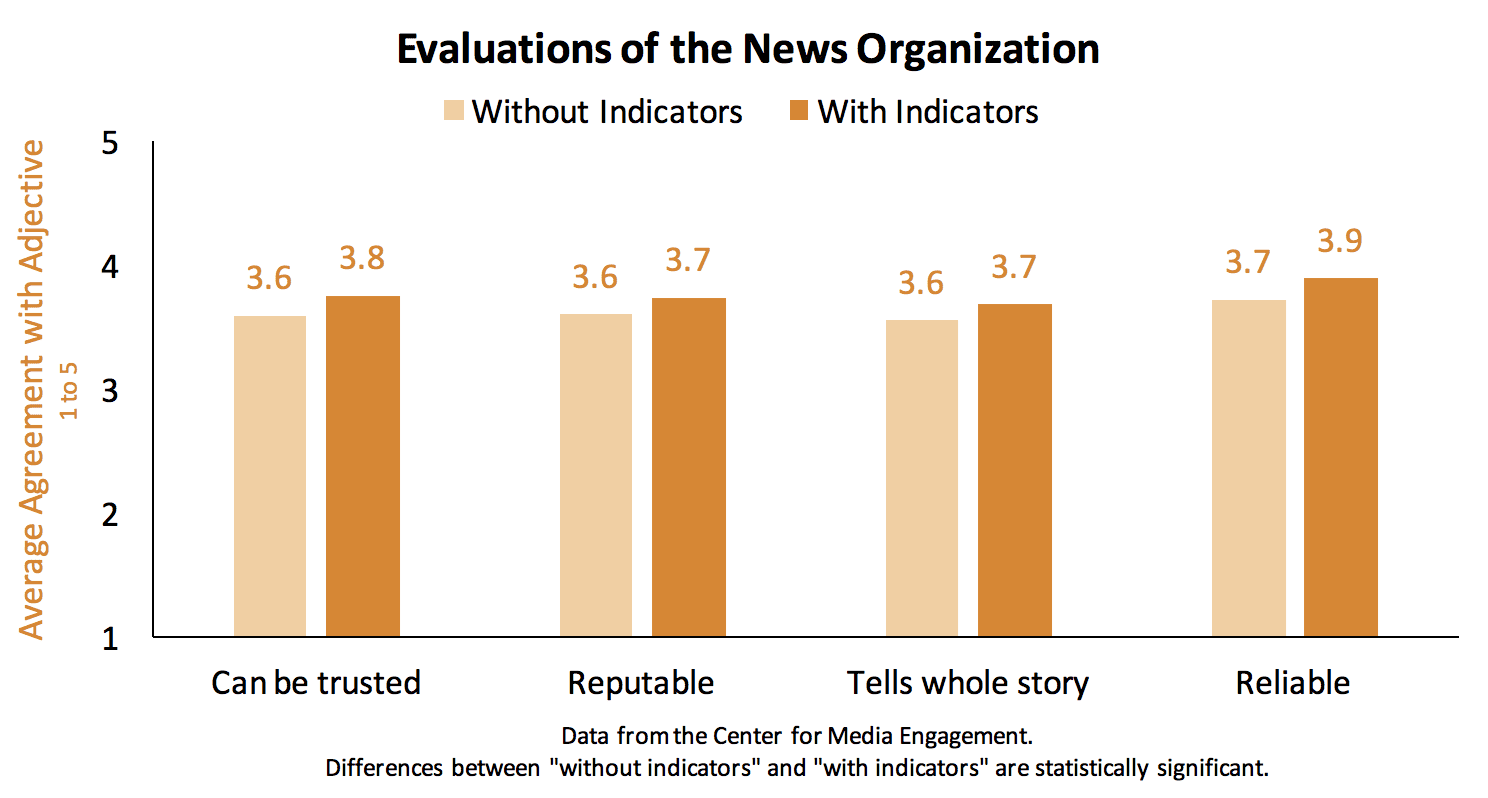
All of the articles read by survey respondents were published by The News Beat, a fictitious news organization we created for use in our experimental studies (please see the method section below for more details). After reading an article, respondents were presented with 15 sets of adjectives (e.g., reputable/not reputable) used to describe The News Beat. Regardless of article topic, those who read articles with indicators had more positive evaluations of the news site than those who read articles without indicators.
Although the differences were not large, statistical tests were significant in four instances.4 Readers of articles with indicators felt the news organization could be trusted more and was more reputable than readers of articles with no indicators. Those who read articles with indicators also had a stronger sense that the news outlet told the whole story and was more reliable than those who read articles without indicators. There were no statistically significant differences for the other 11 adjective sets.5
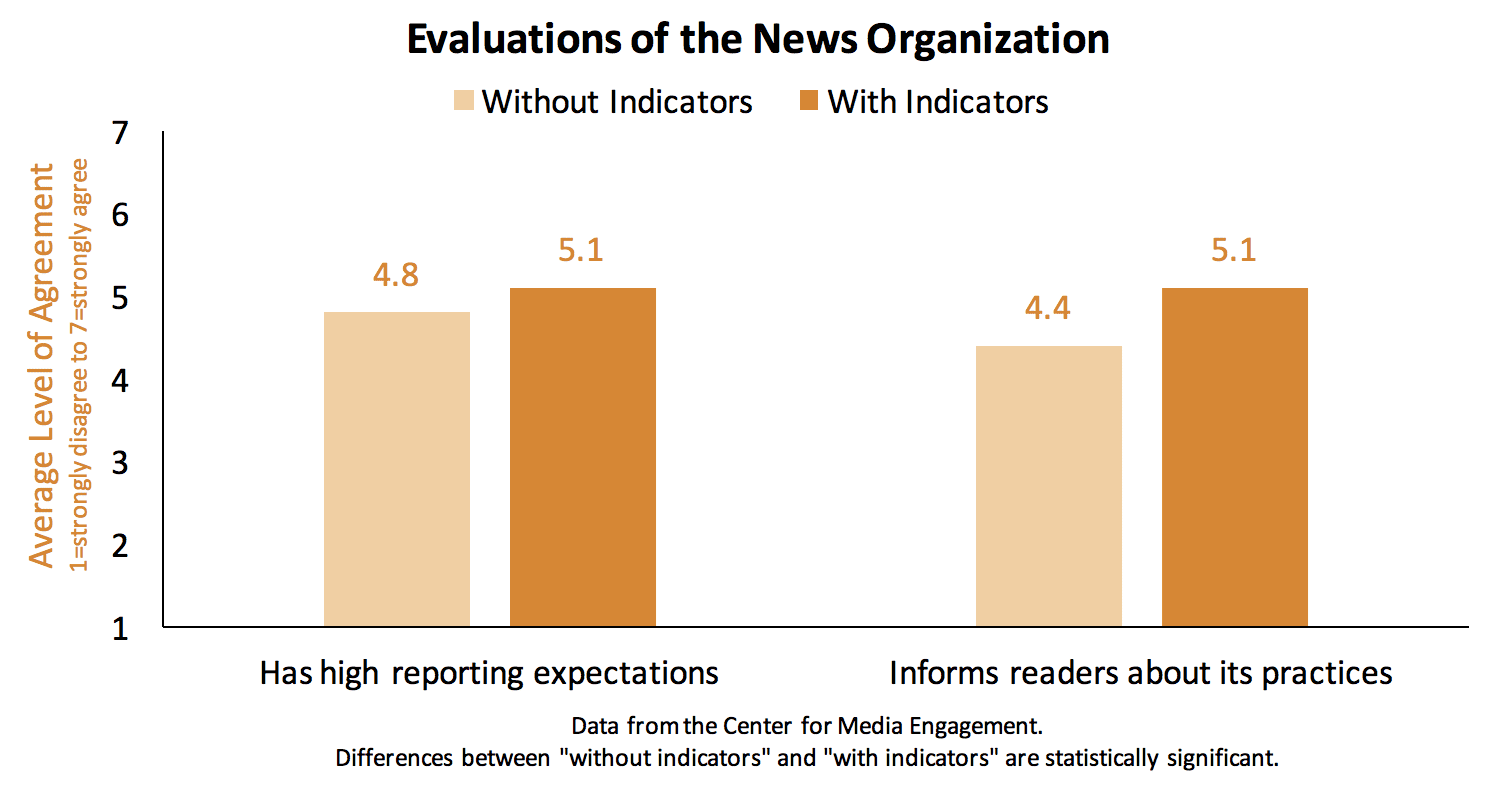
In addition, study participants were asked how much they agreed or disagreed with several statements related to the news organization. Again, participants who saw the indicators gave the news organization significantly higher marks than those who did not see indicators. This was the case when asked if “The News Beat has high expectations for its reporting” and if “The News Beat informs its readers about its reporting practices.”6
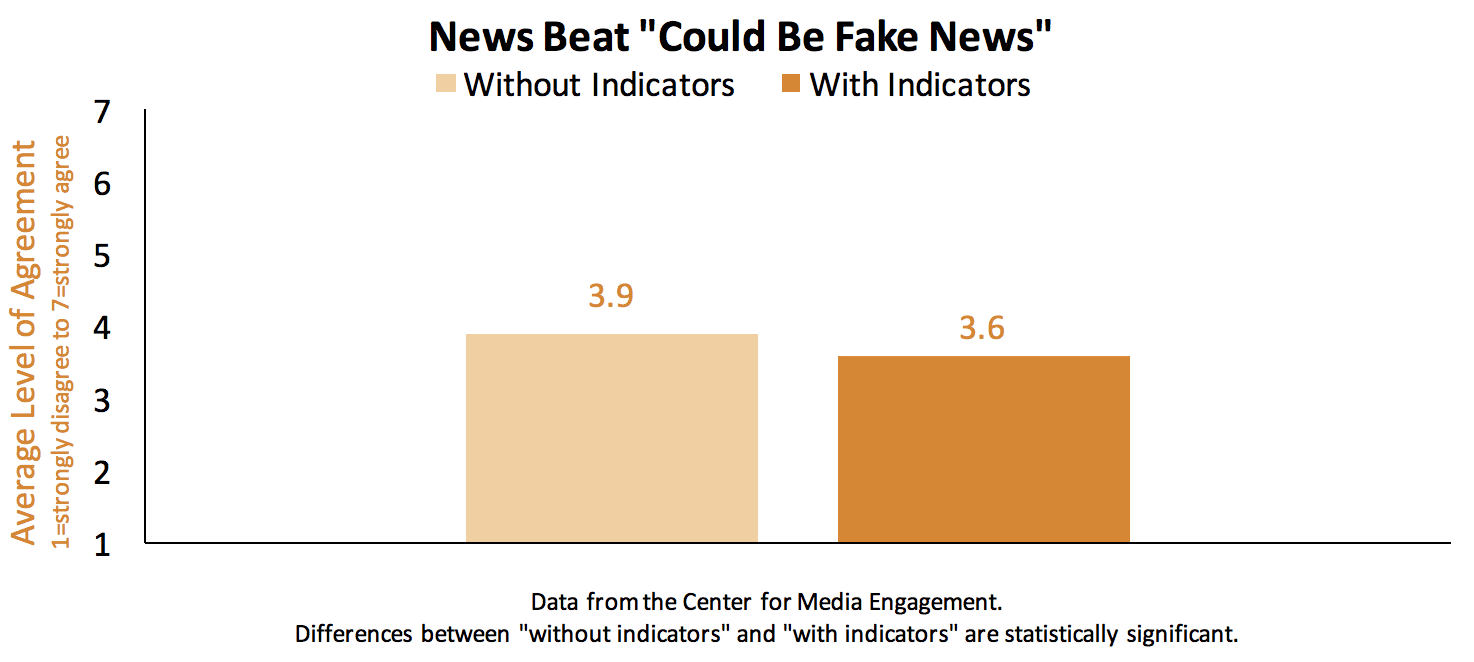
We also asked if “The News Beat could be fake news.” Again, the news organization fared better (indicated in this instance by lower scores) when evaluated by those who saw articles with Trust Indicators compared to those who saw articles without Trust Indicators.7
EVALUATIONS OF REPORTER HIGHER WITH INDICATORS PRESENT
In the survey, two questions were asked about the reporter who wrote the article: whether the reporter carefully researched the article and whether the reporter was well-qualified to write the article. When Trust Indicators were present, survey participants gave the reporter higher evaluations than when Trust Indicators were not present.8
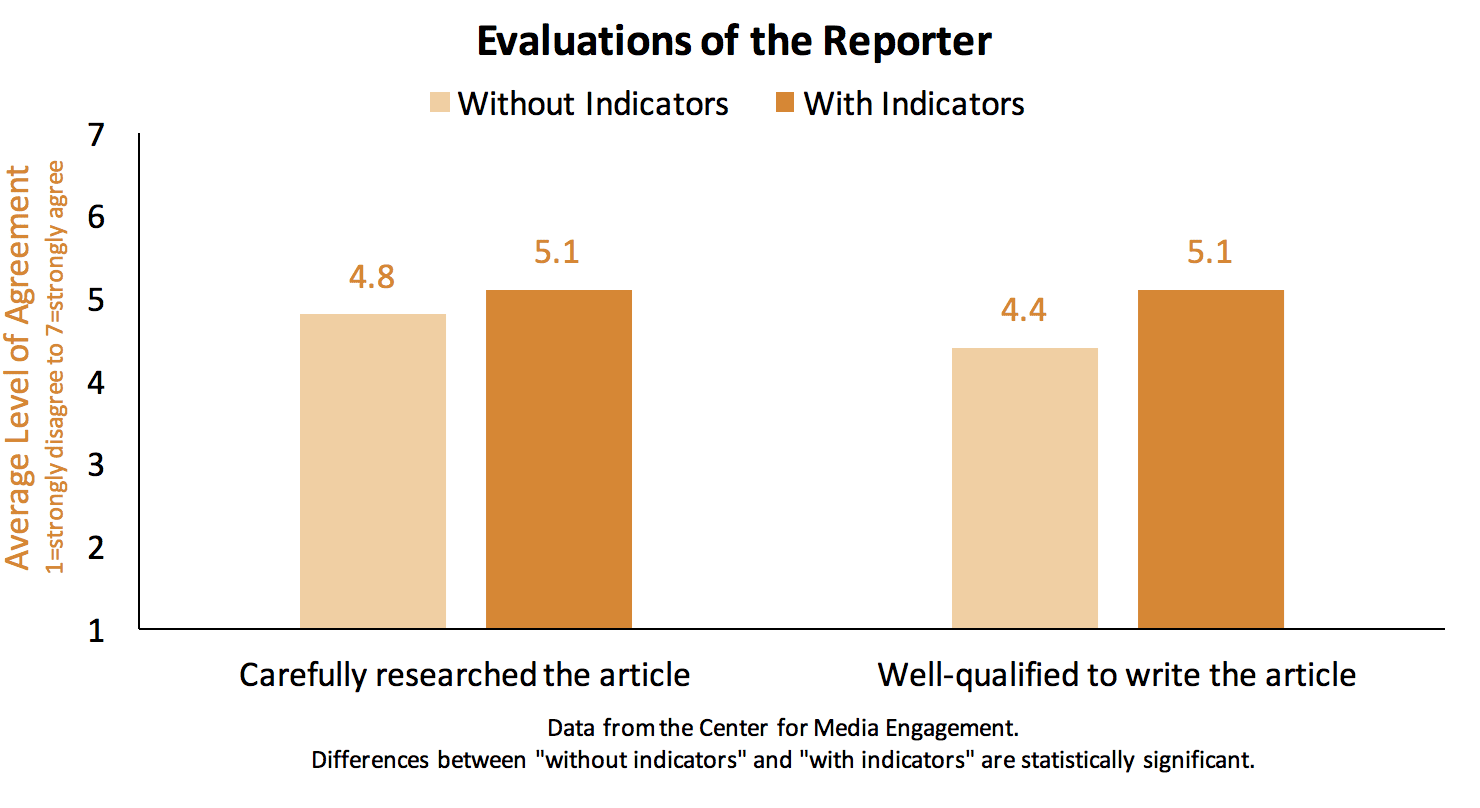
Please note that the same name (and the same picture and biography for articles with Trust Indicators) for the reporter were used for all articles in the study.
BEHAVIORAL INTENTIONS AFFECTED BY PRESENCE OF TRUST INDICATORS
Survey participants were asked about the likelihood that they would seek out news from The News Beat in the future, as well as talk to family and friends about the article they had just read.9 Participants exposed to articles with Trust Indicators were more likely to respond that they would turn to The News Beat in the future compared to participants exposed to non-indicator articles. The same was true for intentions to talk to family and friends about the article.
We also asked participants how likely they would be to share the article on a social media site and read more articles from the reporter and site, but none of the responses to these questions were significantly different depending on whether the Trust Indicators were present.
Near the end of the survey, after explaining the different Trust Indicators to all the participants and giving them some information about the Trust Project, we asked all participants about their willingness to pay for a membership or subscription to a news organization if they knew the organization was participating in the Trust Project. Although the majority indicated that a news organization participating in the Trust Project would not affect their willingness to pay, 33% of respondents responded that participation in the Trust Project would make them somewhat more or much more willing to pay.

The survey vendor used for this experiment gives people points for participating in studies, and these points can later be redeemed for cash or gift cards. We asked all participants, after explaining all of the Trust Indicators, if they would be willing to donate the reward points that they would receive for taking our survey to the Trust Project. To this yes/no question, 15% of respondents indicated that they would be willing to donate their reward points. (To those who agreed to donate their reward points, we thanked them for their generosity, but told them that we would not actually be collecting their points.)
SOME TRUST INDICATORS WERE NOTICED MORE THAN OTHERS
We presented study participants with a list of Trust Indicators and asked them if they noticed each indicator on the article they had just read. Among those who were exposed to articles with indicators, the most recognizable indicator was the description of why the article was written (called “Behind the Story” in the article), with 44.1% of participants noticing this feature. The indicator noticed the least was the article label, with only 12.2% noticing. See Table 1 for full results.10 We also include screen captures of each element at the close of this report for reference.
NOT ALL TRUST INDICATORS HAVE THE SAME TRUST-ENHANCING IMPACT
Near the end of the survey, all participants were given a detailed description of each trust indicator and asked, “if you learned that a news organization was [using a particular trust indicator] – would this: make me trust the news organization more; make me trust the news organization less; or wouldn’t affect my trust.” As seen in Table 2 below, some indicators appear to have a greater ability to improve trust than others. Please note that two of the rows below, “provide a list of best practices” and “provide a link to its leadership structure,” are both part of the Trust Project’s “Best Practices” Trust Indicator, as is the “provide information about the Trust Project” attribute mentioned at the beginning of this paper.
As shown in Table 2,11 62.6% said that indicating that a news organization participated in the Trust Project would make them trust the news organization more. This is compared to only 20.1% believing that their trust would increase if a photo of the author accompanied articles.
TRUST INDICATORS
“Trust Indicators” is the name given to the variety of transparency features tested in our experiment. Designed by the Trust Project, an international consortium of news organizations hosted by Santa Clara University’s Markkula Center for Applied Ethics, the Trust Indicators are news transparency tools created with the goal of making it easier for people to assess the credibility of the news. The indicators detailed below were chosen in consultation with the Trust Project and their network of journalists and scholars. Below, in no particular order, is a brief description and image of each Trust Indicator used in our study.
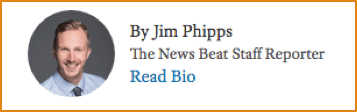
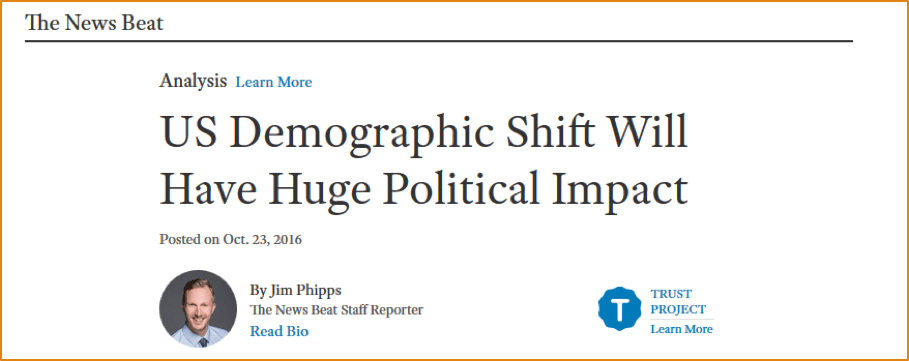
The reporter’s picture and job title, with a link to further information. The picture was a standard headshot of a reporter. The biography gave a one-paragraph narrative of the reporter’s education and job experience, along with a list of recent stories he had written for the news organization, contact information, location, languages spoken, and areas of expertise. On articles with indicators, the reporter’s name, picture, and title were always shown (Screenshot 1), and the comprehensive author information appeared after the user clicked on “read bio” (Screenshot 2). Study participants exposed to an article without indicators saw only the reporter’s name and title.
Screenshot 1. Reporter’s picture and job title.
Screenshot 2. Comprehensive author information expands open after user clicks “Read Bio.”

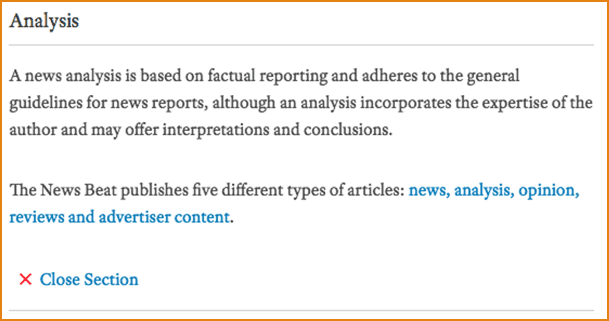
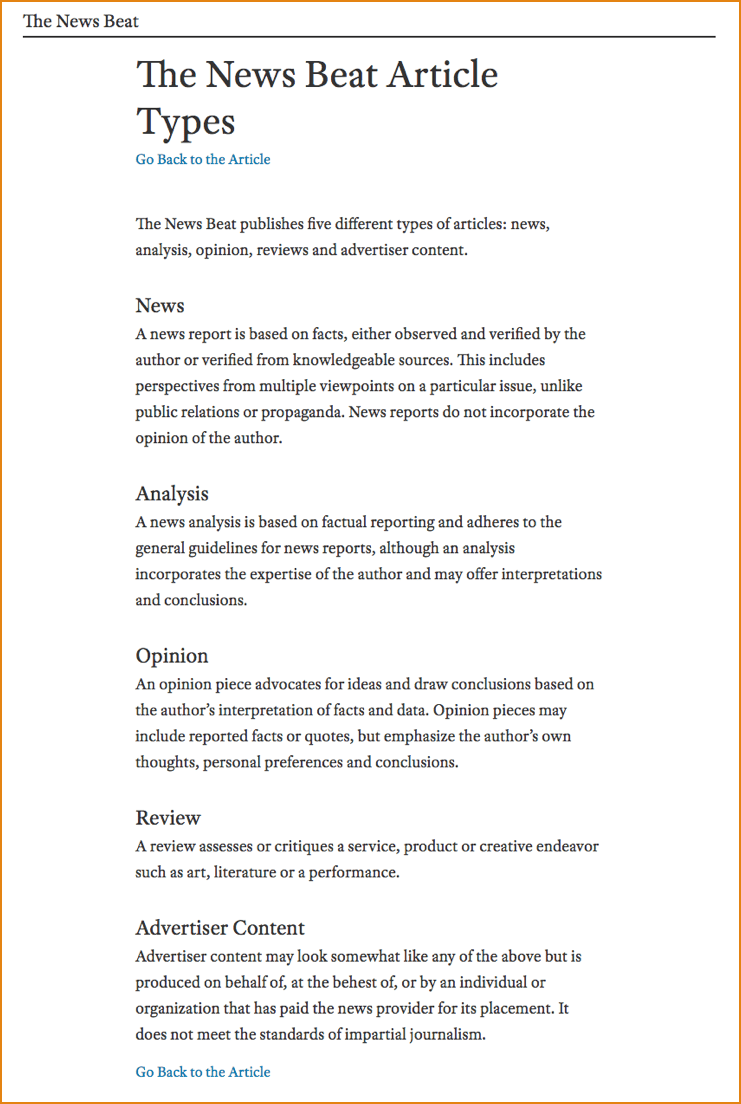
A label indicating whether the article was news, analysis, a review, opinion or advertiser content, with a link to additional information. This one-word label appeared above the headline on the article page (Screenshot 3). Next to the label were the words “Learn More.” When this was clicked, a definition of the label appeared, along with a description of all types of news content available on The News Beat (Screenshot 4). Each of the different content types could be clicked on, taking a user to a new page with Trust Project-supplied definitions for all content types (Screenshot 5). Study participants exposed to an article without indicators saw no label.
Screenshot 3. Story label.
Screenshot 4. Expanded story label information after user clicks “Learn More.”
Screenshot 5. Users can see detailed definitions of all story types.
Footnotes within the article text that offered source material. Footnotes appeared as small blue numbers within gray circles in the article text (Screenshot 6). Each article with indicators contained two footnotes. When clicked on, a small text box expanded below the footnote, revealing text and a working hyperlink (Screenshot 7). Study participants exposed to an article without indicators saw no footnotes.
Screenshot 6. Footnotes.
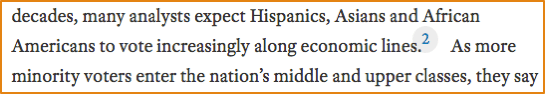
Screenshot 7. When clicked on, footnotes expanded within the article text.

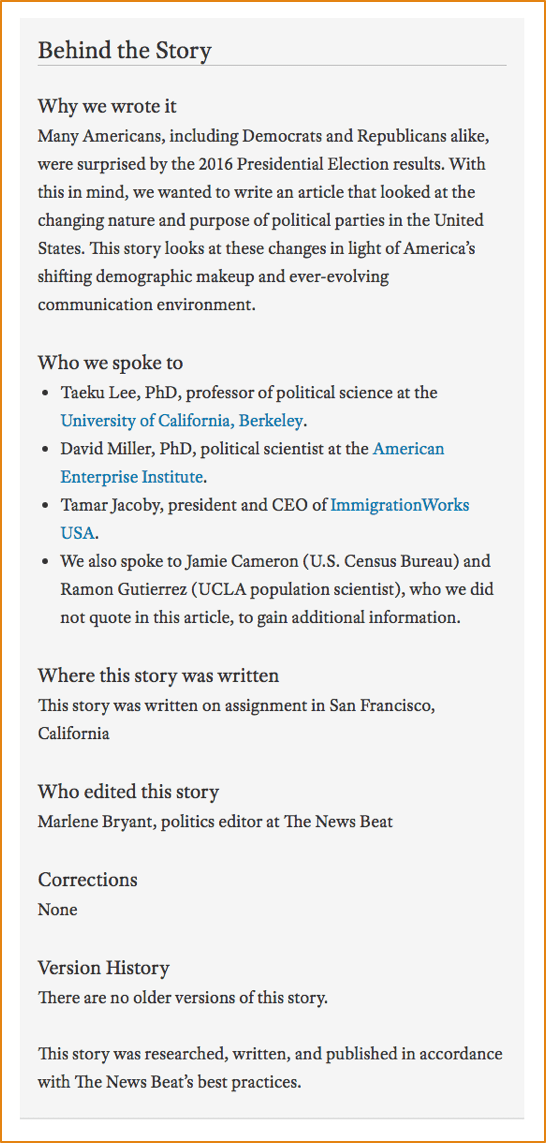
A “Behind the Story” section. After the article text, near the bottom of the page, was a section in a gray box entitled, “Behind the Story” (Screenshot 8). Within this section were the following subheadings: why we wrote it, who we spoke to, where this story was written, who edited this story, corrections, and version history. In addition, there was a sentence describing the Trust Project. Each subheading was filled out with pertinent text and hyperlinks. Study participants exposed to an article without indicators did not see a “Behind the Story” section.
Screenshot 8. Behind the Story section.
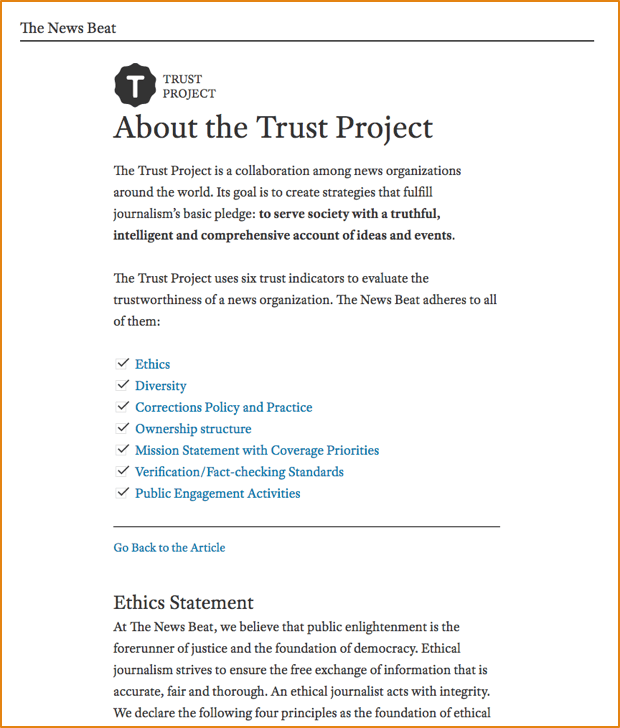
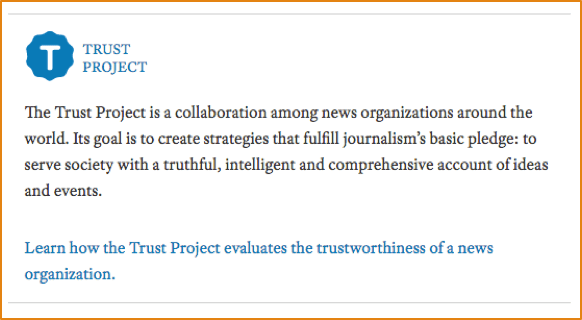
Information about the news organization’s participation in the Trust Project. Information about the Trust Project appeared in two places on the article page with indicators: Near the top of the page between the headline and article photo, and near the bottom of the page between the article text and “Behind the Story” section. At the top of the page, a blue, letter “T” logo was visible, along with the words “Trust Project” and “Learn More” (Screenshot 9). When any of these elements were clicked on, users were taken to a new webpage that gave details about the Trust Project, including a list of best practices to which The News Beat adhered, and descriptions related to: ethics, diversity, corrections policy and practice, ownership structure, mission statement with coverage priorities, verification/fact-checking standards, and public engagement activities (Screenshot 10). The Trust Project information near the bottom of the article page also contained the logo and the words “Trust Project.” Additionally, there were several sentences that gave details about the Trust Project and invited the reader to learn more (Screenshot 11). When clicked on, the logo and “learn more” elements led to the same Trust Project details page just described. Study participants exposed to an article without indicators saw no information about the Trust Project on the news article page.
Screenshot 9. Trust Project information at the top of the article page.
Screenshot 10. Detailed Trust Project information.
Screenshot 11. Trust Project information near the bottom of the article page.
Methodology
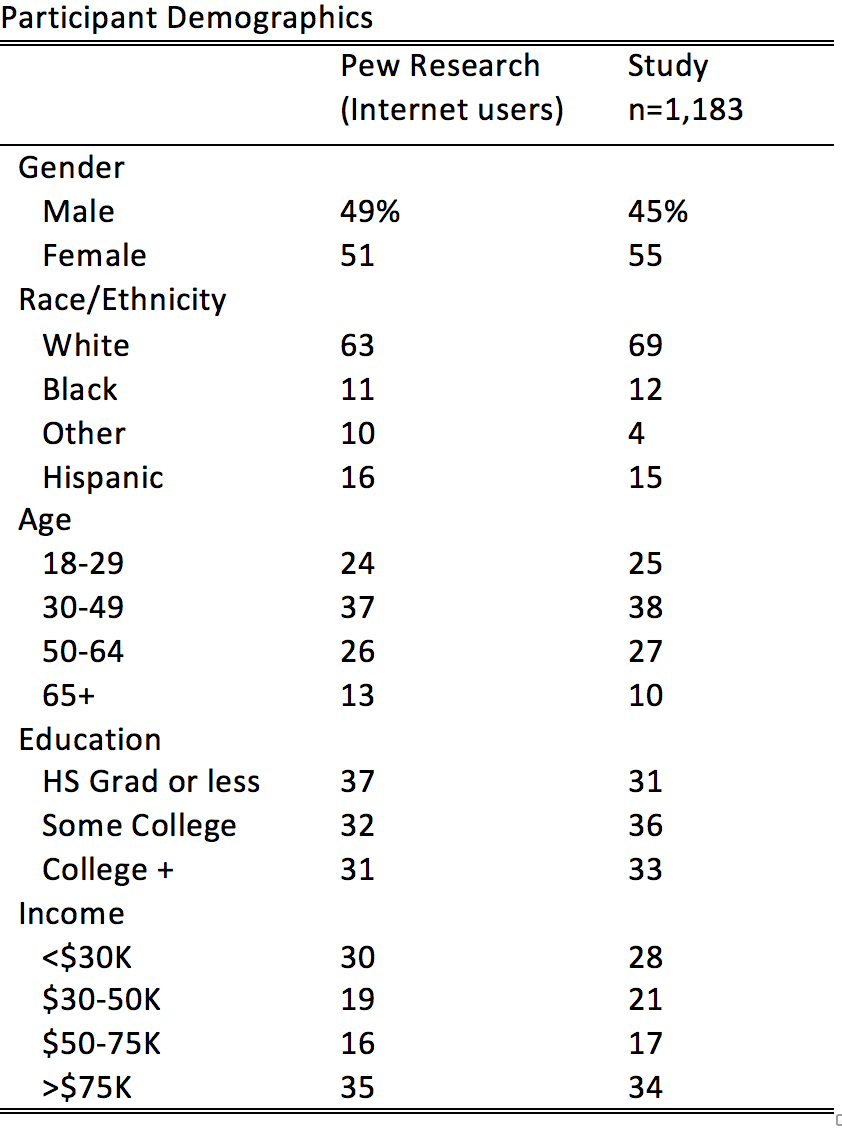
A survey-based experiment was conducted in order to test the effects of Trust Indicators. Respondents were recruited via Survey Sampling International (SSI), which administered the online survey to a national sample of U.S. adults during August-September 2017, resulting in a sample size of 1,183 used for data analysis.12 To recruit participants, SSI uses a variety of invitations, including emails, text messages, telephone alerts, banner ads and other online messaging. Although respondents were not randomly selected, they were demographically diverse and representative in the sense that the demographics of the SSI panel members completing this study were selected to match demographic targets from a nationally representative, random sample survey conducted by the Pew Research Center (see Participant Demographics chart below).13 In our experiment, survey respondents were randomly assigned to read one news article (about politics, science, or the arts) from The News Beat, a fictitious news website created by the Center for Media Engagement for the purposes of our experimental studies.14
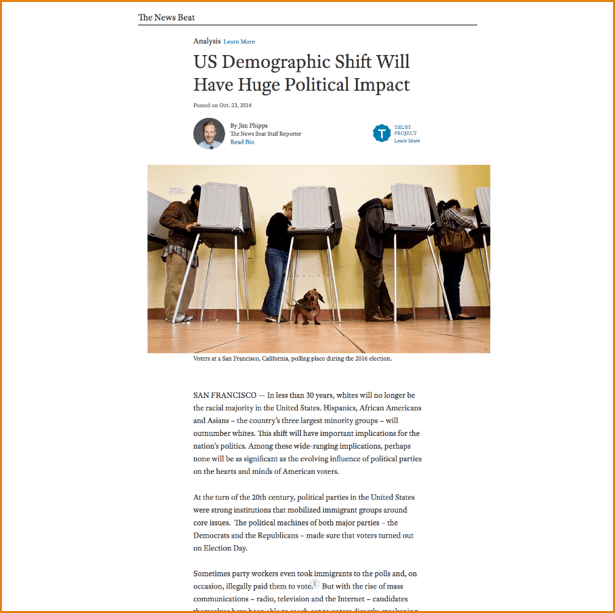
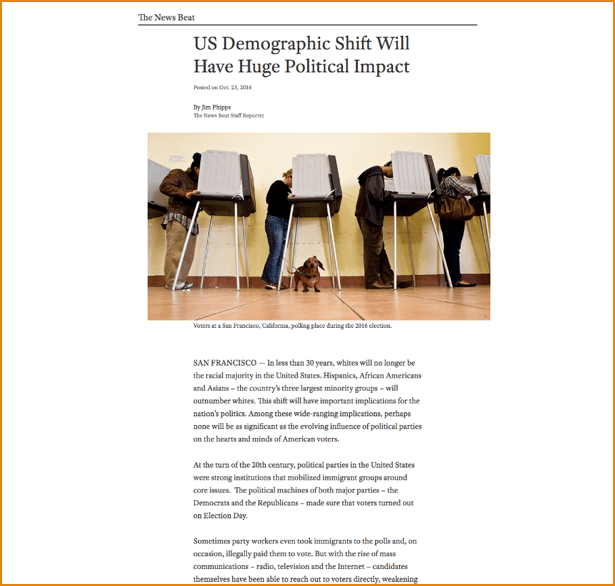
After answering several screening questions (to verify that respondents were age 18 or older and residents of the United States), all participants were asked to read one news article and then answer several questions about the article. Each participant read either a news article that contained Trust Indicators (Screenshot 12) or an identical news article that did not contain any Trust Indicators (Screenshot 13). The text for each article came from a real news article that appeared in U.S. online news publications. The text was edited for length, such that the word count for the three articles ranged from a minimum of 642 words (politics article) to 650 words (arts article). Further, we changed the authors of the original, real articles to be the same author – “Jim Phipps” – in each of the articles used in our study.
Screenshot 12. The News Beat with Trust Indicators
Screenshot 13. The News Beat without Trust Indicators
After reading the article, participants were asked a series of identical questions used to gauge their opinions about the article they read, The News Beat, and other news-related topics. Participants were also asked several questions to gauge their opinions about the topics which they read. Whether or not a respondent was exposed to Trust Indicators had no effect on topic-related opinions.
Note that we conducted analyses to evaluate whether any of the effects of the Trust Indicators differed depending on whether people saw an arts, science, or politics article. In no instance did we find any differences in the effects of the Trust Indicators across the topics.15 This means that we have no evidence that the Trust Indicators work on some articles differently than others.
SUGGESTED CITATION:
Curry, Alex and Stroud, Natalie Jomini. (2017, December). Trust in online news. Center for Media Engagement. https://mediaengagement.org/research/trust-in-online-news
- Gallup has been tracking trust in the U.S. news media since 1972, and has found a consistent decline in news trust during that time. Gallup’s most recent poll, although showing an upswing in trust by Democrats, still shows that overall trust in the news media is still far below what it was in decades past. For more information, please see. [↩]
- Research published in the Reuters Institute Digital News Report 2017 “found that roughly two-thirds (of the 3,000 people surveyed in the study) remembered the path through which they found the news story (Facebook, Google, etc.), but less than half could recall the name of the news brand itself when coming from search (37%) and social (47%). Respondents were more likely to remember the brand if they had a previous connection with it or used it as a main source” (p. 16). [↩]
- See thetrustproject.org/faq for more information. [↩]
- Can be trusted/cannot be trusted, t(1173) = -2.71, p = 0.007; reputable/not reputable, t(1167) = -2.57, p = 0.01; tells the whole story/does not tell the whole story, t(1172) = -2.14, p = 0.03; reliable/not reliable, t(1169) = -3.05, p = 0.002. [↩]
- The other 11 adjective sets were: enjoyable/unenjoyable, interesting/uninteresting, informative/uninformative, clear/confusing, credible/note credible, accurate/inaccurate, easy to navigate/difficult to navigate, not biased/biased, fair/unfair, has integrity/does not have integrity, and does not have an agenda/has an agenda. [↩]
- “The News Beat has high expectations for its reporting,” t(1176) = -3.74, p < 0.001; “The News Beat informs its readers about its reporting practices,” t(1179.91) = -9.47, p < 0.001. Results were not significantly different for the following statement: “The News Beat only told one side of the story.” [↩]
- “The News Beat could be fake news,” t(1172.52) = -3.19, p = 0.001. [↩]
- “The News Beat reporter carefully researched this article,” t(1179.39) = -3.11, p = 0.002; “The author of this article was well-qualified to write it,” t(1180) = -3.24, p = 0.001. [↩]
- Likelihood that a participant would: “seek out news from The News Beat in the future”, t(1180) = -3.06, p = 0.002; “Talk to family and friends about this article,” t(1177) = -2.13, p = 0.03. Participants were also asked about the likelihood that they would “share the article on Facebook, Twitter, or other social media,” “read more articles by this author,” “read more articles from this site,” and “read another story from The News Beat;” responses to these four items were not statistically different based on whether respondents saw the Trust Indicators. [↩]
- We also asked participants if they noticed the comment section (all of the articles contained a working comment section) and a Facebook “like” button (none of the articles contained a Facebook “like” button). Of participants exposed to the articles with indicators, 54.4% indicated that they noticed a comment section, and 12.4% indicated that they noticed a Facebook “like” button. We also asked participants who were not exposed to articles with indicators if they noticed any of the indicators; they responded thusly: reporter’s picture (noticed by 5.1%); information about the Trust Project (13.4%); story label (10.2%); a description of why the story was written (18.5%); a comment section (57.1%); footnotes within the article text (11.4%); Facebook “like” button (11.4%); reporter’s biography (7.2%); “none of the above” (21.4%). [↩]
- The exact question wording was as follows: If you learned that a news organization was … (1) labeling their articles as news, analysis, opinion, reviews, or advertiser content – and defining each of these for its readers, (2) providing its online readers with a comprehensive biography of the author who wrote a particular article, (3) providing its online readers with a photo of the author who wrote a particular article, (4) providing its online readers with a list of best practices (such as an ethics policy, diversity statement, and corrections policy) to which its staff adheres when it reports stories, (5) embedding, within some of its online articles, citations, and references to outside sources of information, (6) including a “behind the story” section with many of its online articles, and this section included an explanation of why the story was written, the sources that the authors consulted, who edited the story, and if there were any corrections or changes, (7) making available on its site a link to its leadership structure, including information about its funding, owners, executive officers, editors, and other organizational decision makers, (8) All of the strategies you’ve read about to this point are part of the “Trust Project.” If you learned that a news organization was participating in the “Trust Project” which is “…a collaboration among news organizations around the world. Its goal is to create strategies that fulfill journalism’s basic pledge: to serve society with a truthful, intelligent and comprehensive account of ideas and events, would this make me trust the news organization more, make me trust the news organization less, wouldn’t affect my trust. [↩]
- A total of 1,423 participants began our survey, but some responses were not used in the analysis. The survey was intended for American adults, so those who did not meet age or residency requirements were removed (n=25). Others were removed because they: indicated they were unable to view the article webpage (n=68), gave identically-valenced responses to a series of Likert-type questions (n=25), took the survey more than once (n=14), left unintelligible responses to open-ended questions (e.g., “Chuck Norris can you please follow”), or did not finish the survey (n=39). In addition, we had a manipulation check that asked respondents, immediately after they viewed the article, to identify the topic of the article they read. Those who failed this multiple choice question (n=42) were also not included in the data analysis, leaving us with 1,183 useable cases. There were no differences based on whether respondents saw the Trust Indicators. [↩]
- In the “with indicators” condition, there were 52.1% women and in the “without indicators” condition, there were 58.7% (χ2(1) = 5.16, p < .05). We re-ran all of the analyses with sex as a control variable. In only one instance did the result change (“How interested or uninterested would you be in paying $5 to $10 per month for The News Beat?” did not show a significant difference between the conditions after controlling for sex). In no instance was there a significant interaction between sex and the experimental condition. We also asked participants to share their political party identification: 36.2% identified as Democrat, 26.9% as Republican, 34.5% as independent, and 2.4% as “other.” There were no party ID differences based on whether respondents saw the Trust Indicators. [↩]
- The politics article was titled “US Demographic Shift Will Have Huge Political Impact,” the science article was titled “What The New Superbug Means For The Fight Against Antibiotic Resistance,” and the arts article was titled “Copycake: When Food Art Ideas Get Swiped.” [↩]
- To do this analysis, we ran ANOVAs with the main effects of the Trust Indicators and article topic (i.e., politics, science, the arts) and then examined whether there were any significant interactions between the two variables. In no instance was the interaction statistically significant. [↩]