


Correction: This version of the report corrects an earlier version which misidentified locations mentioned by local outlets. The updated version corrects the maps and corresponding findings in the “Philadelphia Locations Mentioned by Media Outlets” section. The updates do not change the main conclusions of the report.
SUMMARY
Local news is a democratic staple, and working to create a healthy local media ecosystem is a goal for many cities. Figuring out what gaps exist – whether certain areas receive less coverage relative to others or whether certain topics are of interest to the public but are rarely mentioned in the media – can be helpful in guiding new ideas. The Center for Media Engagement, with funding from The Lenfest Institute and Independence Public Media Foundation, analyzed over 60,000 local media articles across 86 sites and the perceptions 1,500 Philadelphians have about their local media. These two analyses, and the comparison between them, allowed us to examine where there are gaps in the news ecosystem.
We found that the most populous areas are not always covered most frequently. Issues like crime and safety or sanitation and trash removal emerged as consistently important topics for Philadelphians, yet these issues weren’t always evaluated as being adequately covered. We hope that this report can help to guide new initiatives in Philadelphia’s news landscape.
KEY TAKEAWAYS
The Center for Media Engagement, with support from The Lenfest Institute for Journalism and Independence Public Media Foundation, analyzed the Philadelphia media ecosystem from the perspective of the people who live there and the type of journalism that is produced. Just over 1,500 Philadelphians, distributed across the city, shared their thoughts about the most important issues facing their neighborhoods and how local media are covering these issues and their communities. Over 60,000 articles from 86 local news sites were analyzed for the topics covered and locations mentioned.
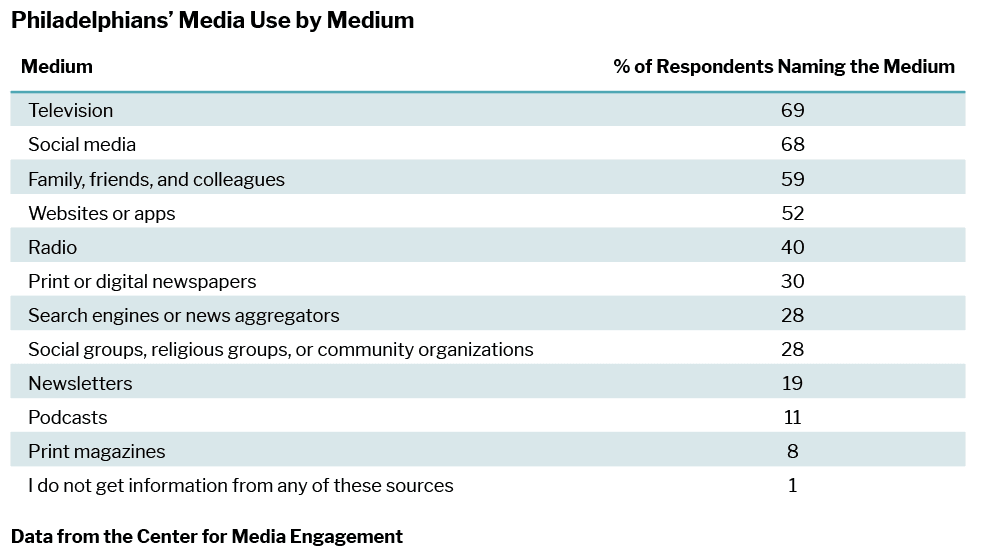
The results showed clear patterns of media use and beliefs about the media. Television and social media were the most used sources of information about Philadelphia, with 69% of Philadelphians mentioning television and 68% mentioning social media. Overall, Philadelphians thought that local media did slightly better than average in representing their neighborhoods.
In our analysis, we looked for signs of gaps in the media ecosystem that could be addressed in the years to come.
Coverage Gaps
Coverage gaps occur when the media cover a topic or region less often than expected. These gaps represent opportunities for more, or new, coverage. There was evidence of coverage gaps in Philadelphia:
- Based on Census data, the most populous regions are North Philly and Northeast Philly. Yet the most frequently mentioned locations in the news media were in South Philly / Center City and North Philly.
- Sanitation, trash removal, and cleanliness were mentioned as important issues by 34% of Philadelphians and yet were mentioned in only 3% of the articles we reviewed.
Perceived Gaps
Perceived gaps occur when the public is dissatisfied with some aspect of media coverage. Several appeared in our analysis.
Philadelphia residents – regardless of where they lived – gave local media mediocre ratings on a wide range of questions about how well the media represent them and their neighborhoods. Some parts of Philly gave the media lower ratings:
- People in Southwest Philly, North Philly, Lower Northeast Philly, and West Philly were more likely than other parts of Philly to agree that stories about their neighborhoods were too negative.
- People in West and Southwest Philly had the most negative assessments of what they thought the media thought of their neighborhood. Yet those in Southwest Philly were also more likely to want to volunteer to report on a public meeting and expressed the greatest interest in talking to a journalist.
Across the city, people felt that there weren’t local media organizations that offer solutions to problems facing my community. This sentiment was held more strongly by women, younger Philadelphians, and Republicans. In general, younger Philadelphians and Republicans felt less represented by the media.
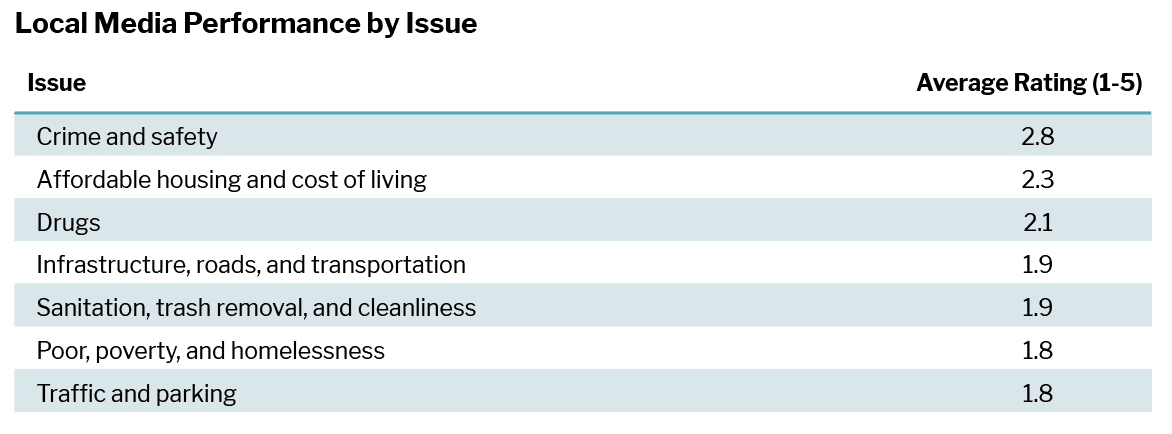
Residents gave local media below average ratings for its issue coverage, with the following issues garnering the lowest performance ratings: infrastructure, roads, and transportation; sanitation, trash removal, and cleanliness; the poor, poverty, and homelessness; and traffic and parking. All of these issues were under-covered relative to the frequency with which Philadelphians identified them as issues facing their community.
Use Gaps
Several outlets that target particular areas or that highlight issues that the respondents said were important do not seem to be widely used, creating the presence of use gaps.
- For example, respondents rarely mentioned West Philly Local (a media source that more frequently referenced West Philly than other outlets) when given the opportunity to name local media outlets that they used. When asked if “there aren’t enough stories about my neighborhood in the news media,” West Philadelphians typically indicated only modest agreement.
- As another example, The Philadelphia Citizen covered a high percentage of issues that the public found important, yet was infrequently mentioned when people were given the opportunity to name additional media outlets that they used.
Targeted studies to understand these use gaps would be a useful next step. It could be that people use these outlets more frequently, but they weren’t top of mind after people reported on their use of other Philadelphia sources. Or it could be that people are unfamiliar with these sources or for some reason don’t use them.
IN-DEPTH FINDINGS
The Center for Media Engagement, supported by The Lenfest Institute and Independence Public Media Foundation, conducted a survey of 1,526 Philadelphians in partnership with survey firm SSRS and gathered over 60,000 digital articles from local Philadelphia media outlets in the summer of 2022.
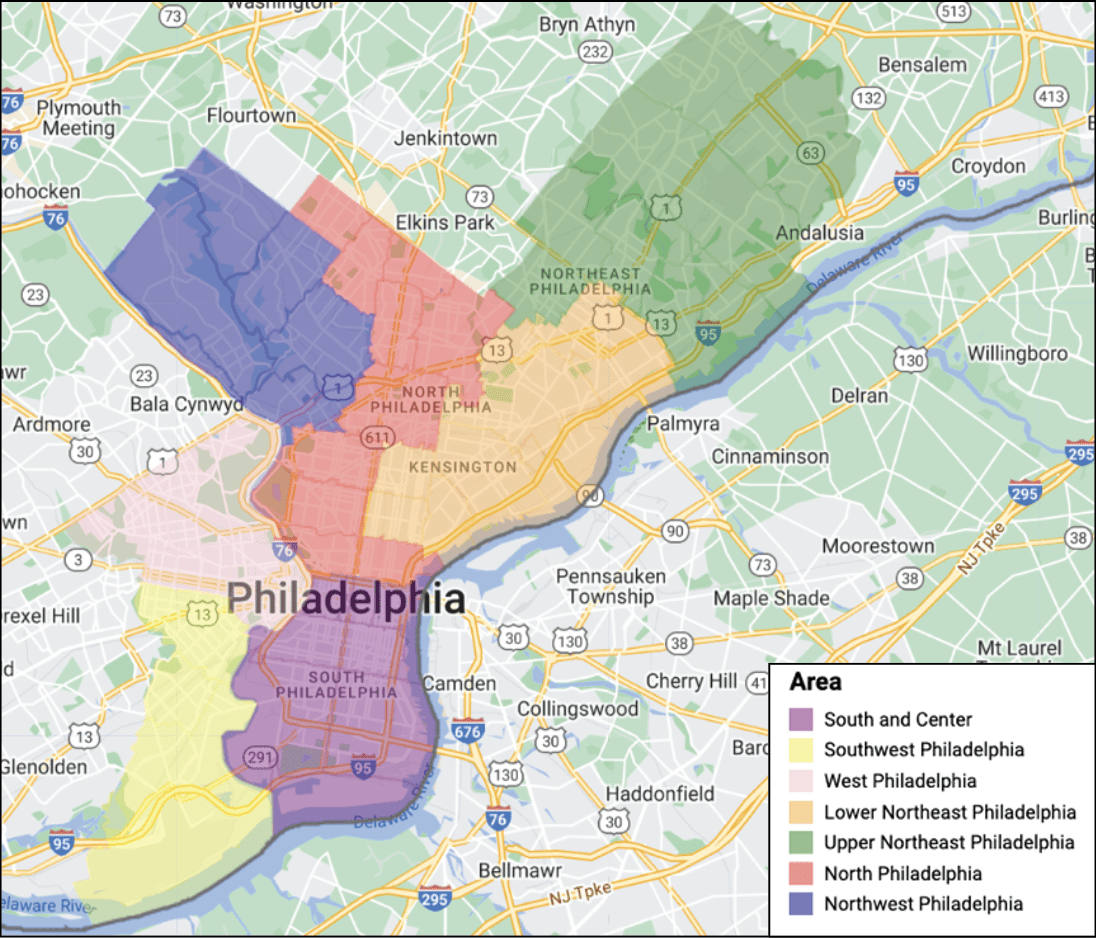
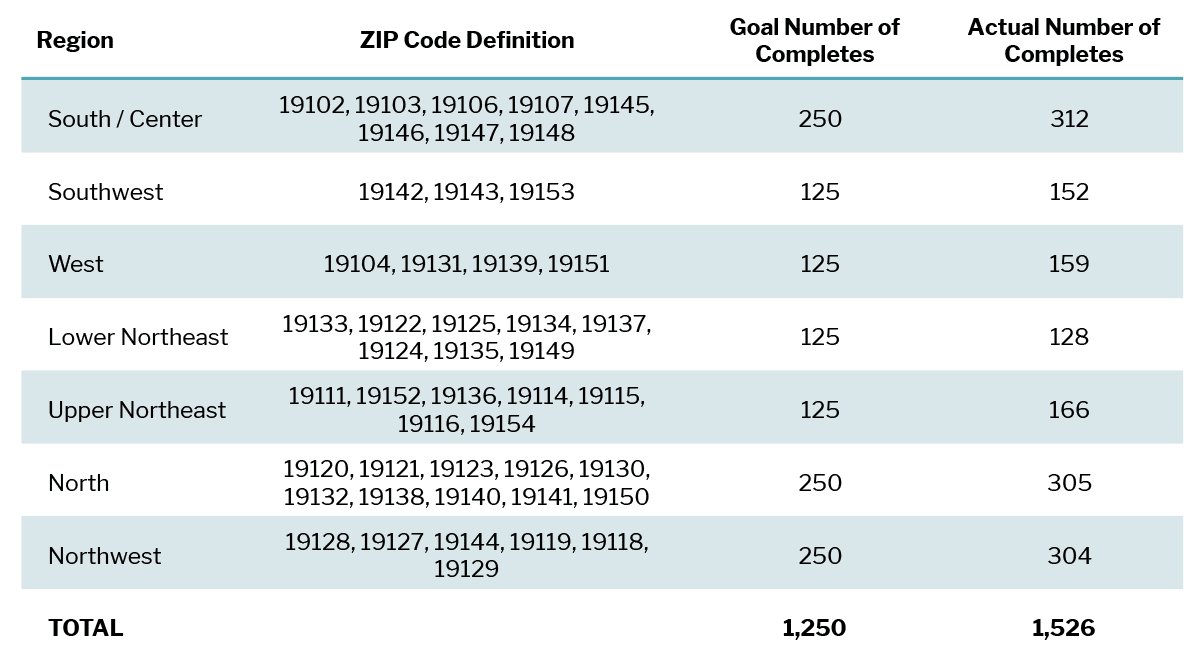
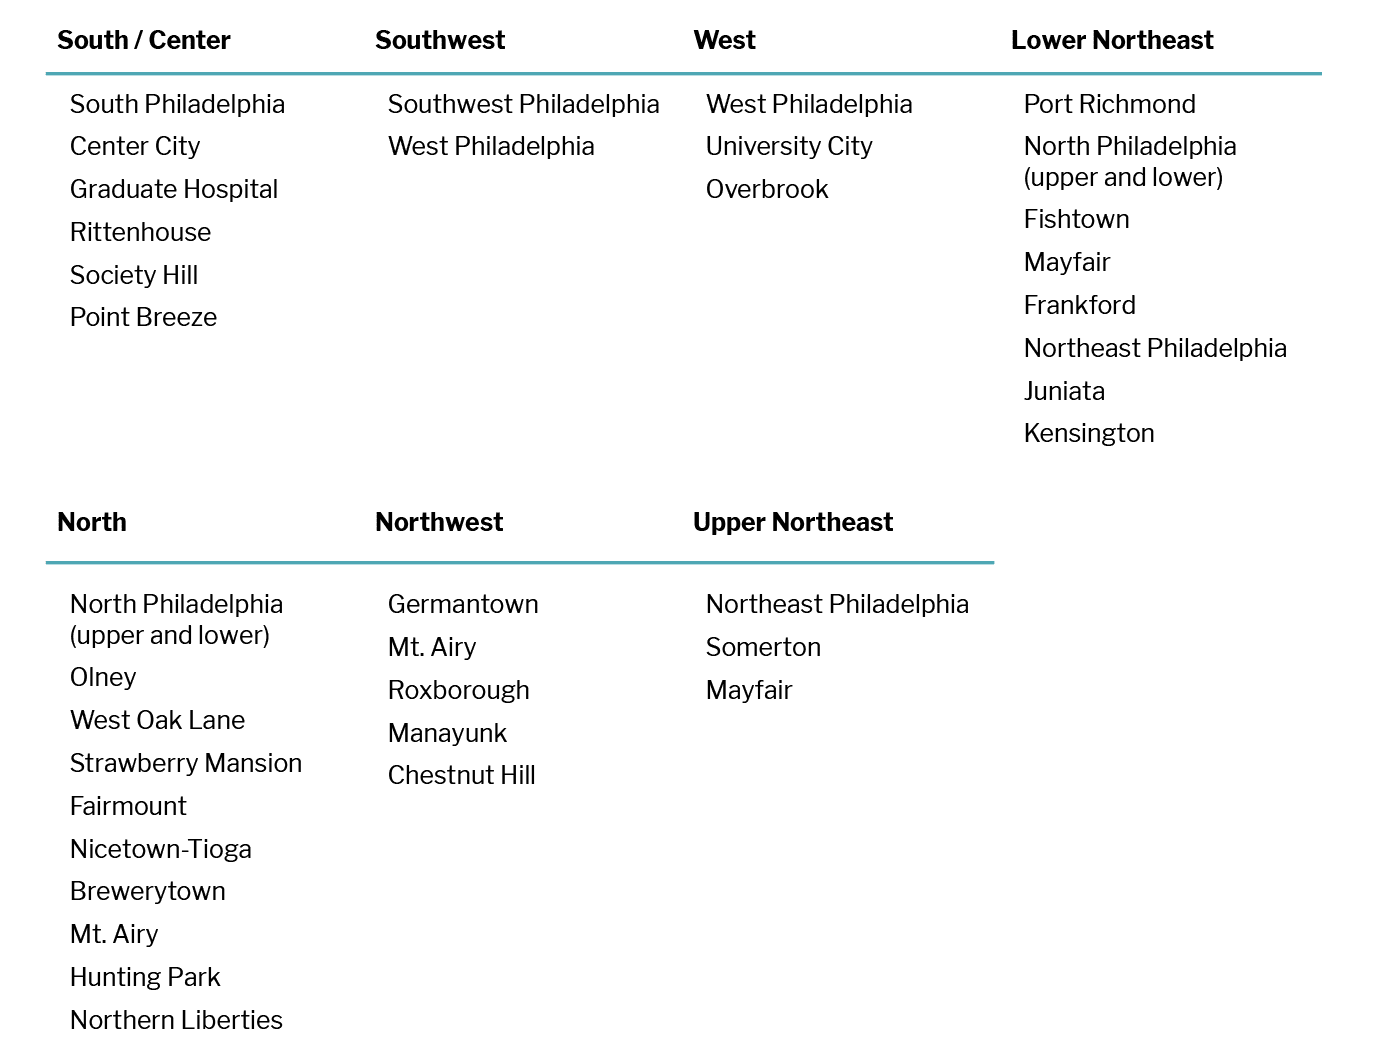
To understand differences across the city, we divided Philadelphia into seven regions as pictured in the map below. We note here that the sample sizes for West Philly, Southwest Philly, Upper Northeast Philly, and Lower Northeast Philly are approximately half of the sample sizes for South Philly / Center City, North Philly, and Northwest Philly.1 Smaller sample sizes mean that the margin of error is larger and differences between regions will be statistically significant less often. In the text, we note when there are significant differences across the regions.
Most Important Issues
Philadelphians were asked to report the most important issues facing their neighborhood. Crime and safety were mentioned by 70% of respondents – the most frequently mentioned issues.
Sanitation, trash removal, and cleanliness was the next most frequently mentioned category, with 34% of respondents stating that these were important issues facing their neighborhood. This was followed by traffic and parking (25%), drugs (19%), infrastructure (19%), and poor, poverty, and homelessness (13%).

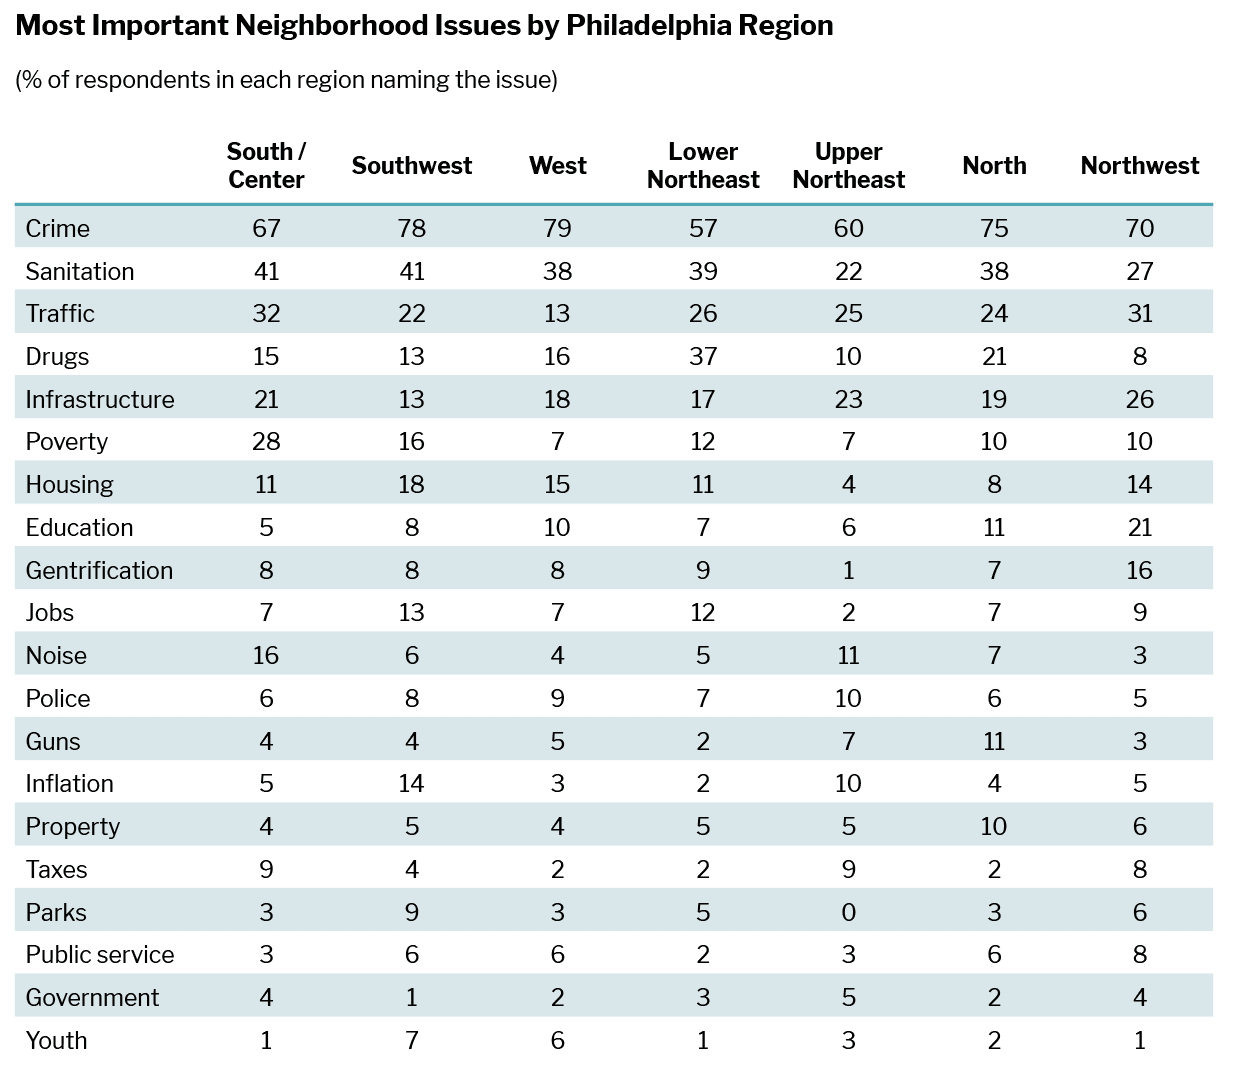
The next chart shows what issues people mentioned most frequently depending on where they lived.
Crime and safety were the most frequently mentioned issues regardless of where people lived. More people mentioned these issues in West Philly (79%), Southwest Philly (78%), and North Philly (75%) than in Upper Northeast Philly (60%) and Lower Northeast Philly (57%), but crime and safety dominated public concern throughout the city.
Sanitation, trash removal, and cleanliness were the next most commonly mentioned issues. Throughout most areas of Philly, sanitation, trash removal, and cleanliness were mentioned by between 38% and 41% of residents, with exceptions including Upper Northeast Philly (22%) and Northwest Philly (27%).
Traffic and parking were mentioned more often by those living in South Philly / Center City (32%) and Northwest Philly (31%) than by those living in West Philly (13%).
Drugs were mentioned most often by those in Lower Northeast Philly (37%) and least often by those in Northwest Philly (8%).
We also examined what additional factors, beyond where people lived, might have affected the issues they nominated as important. We looked at gender, age, race, education, income, years spent living in Philadelphia, years spent in the same neighborhood, living situation (rent, own, mortgage, or other), number of adults in the home, number of children in the home, and partisanship. Several of these other factors mattered, but none did a great job of helping to predict what issues people believed were important.3 We summarize the results:
- Crime and safety. We asked Philadelphians whether they lived in a place where they paid rent, paid a mortgage, owned their home, or had some other living arrangement. Those with some other arrangement were more likely to say crime and safety were important issues facing their neighborhood compared to those renting.
- Sanitation, trash removal, and cleanliness. Other factors beyond where people lived did not help to predict whether people named these issues as important for their neighborhood.
- Traffic and parking. Those who spent fewer years in Philly, those who identified as white, and those who spent more years in their neighborhood were more likely to see traffic and parking as important issues facing their neighborhood.
- Drugs. Younger and Hispanic Philadelphians were more likely to identify drugs as an important issue facing their neighborhood. Those who rented their home, compared to those who had a mortgage or owned their home, also were more likely to name drugs as an important issue.
- Infrastructure, roads, and transportation. Other factors beyond where people lived did not help to predict whether people named infrastructure, roads, and transportation as important issues facing their neighborhood.4
- Poor, poverty, and homelessness. Stronger Democrats were more likely to name these issues as important and those identifying as Asian were less likely.
- Affordable housing and cost of living. Those paying a mortgage were less likely than renters to name affordable housing and cost of living as important issues facing their neighborhood.
- Education. Those with more education and those who had more children in their home were more likely to name education as an important issue facing their neighborhood.
- Police reform, brutality, and defunding. None of the variables, including where people lived, predicted whether people named police reform, brutality, and defunding as important issues facing their neighborhood.
- Gentrification and neighborhood revitalization. Those who had lived in their neighborhood longer and those with more adults in the home were more likely to name gentrification and neighborhood revitalization as important issues facing their neighborhood.
For the first three issues that they named, Philadelphians were asked to reflect on how good of a job the local media did in covering the issue from 1 (very poor job) to 5 (very good job). Local media coverage of crime and safety received the highest rating, earning a 2.8 out of 5 which is between an “acceptable job” and a “poor job.” Other categories were closer to a “poor job.”
We had sufficient sample size to analyze whether people’s thoughts about media coverage of crime and safety varied depending on where they lived in the city. There were no differences. Regardless of where people lived, they gave similar ratings.
Other factors predicted what people thought about local coverage of crime: households with more kids and those paying a mortgage (vs. those renting) gave the media poorer ratings on its coverage of crime and safety.
Issues Mentioned in Local Media
We scraped 62,826 articles from 86 local media websites during the same time period as we surveyed Philadelphia residents. We analyzed whether the media talked about the same issues that our respondents did.
We first looked at the 49 news sites where we scraped 100 or more articles. We calculated the average percentage of articles per outlet that mentioned each issue. As articles often mentioned words related to more than one issue, the percentages add to more than 100.
In the media coverage, crime and safety was mentioned most often, appearing, on average, in 33% of the articles per outlet. This was followed by government functioning and corruption (31%), and education and schools (27%).
We compared the issues the public named as important to their neighborhoods to how often terms related to those issues were used in the media. We use this comparison to identify issues that the public thinks are important that are receiving little local media coverage.
Note that a one-to-one correspondence between the issues mentioned by the media and the issues prioritized by the public is not desirable. In Philadelphia, for instance, 70% of the public mentioned crime and safety as important issues facing their neighborhoods. It is unlikely, however, that the public would want 70% of the local news coverage to focus on these issues. A better standard, we propose, is to look at the relative prioritization of the issues by the public and by the media.
If the media cover an issue more frequently than the public response, it does not necessarily indicate that the media is over-prioritizing the issue. Residents were asked about important issues facing their neighborhoods and local media is responsible for covering issues beyond local neighborhoods. If neighborhood issues important to the public are rarely covered, however, this indicates that there are issues for which additional coverage could be helpful.
It also is important to note that media coverage can influence what the public thinks is important and that this report only examines the amount of coverage. Media coverage of crime and safety, for instance, could over-emphasize the danger to residents and make them think that the issue is more important than it should be. Some research suggests that this happens.5 Nonetheless, the comparison provides some indication of issues that may warrant more coverage if they were frequently identified by the public as important for their neighborhoods and infrequently mentioned in coverage.
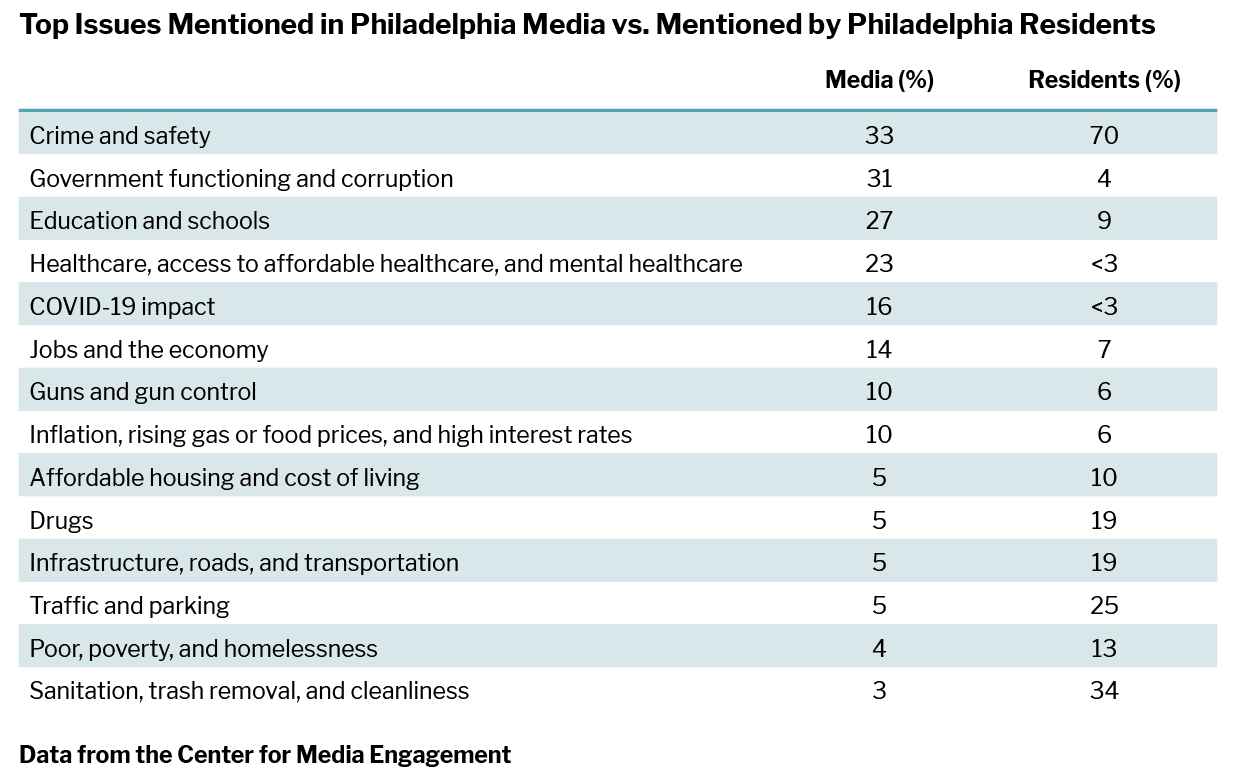
In the following table, crime and safety were most often mentioned as important issues facing people’s neighborhoods (70% of Philadelphia survey respondents) and words related to crime and safety appeared more often than other issues in local media (on average, 33% of articles per outlet).
We identified several issues that were mentioned more frequently by Philadelphia residents than by local media, suggesting opportunities for more coverage.
- Sanitation, trash removal, and cleanliness, for instance, were mentioned as important issues by 34% of Philly residents. Related terms were used in an average of 3% of the articles per outlet.
- Traffic and parking were identified by 25% of residents and appeared in an average of 5% of articles per outlet.
- Drugs and infrastructure, roads, and transportation were each mentioned by 19% of residents and appeared in an average of 5% of articles per outlet.
- Poor, poverty, and homelessness was mentioned by 13% of residents and appeared in an average of 4% of articles per outlet.
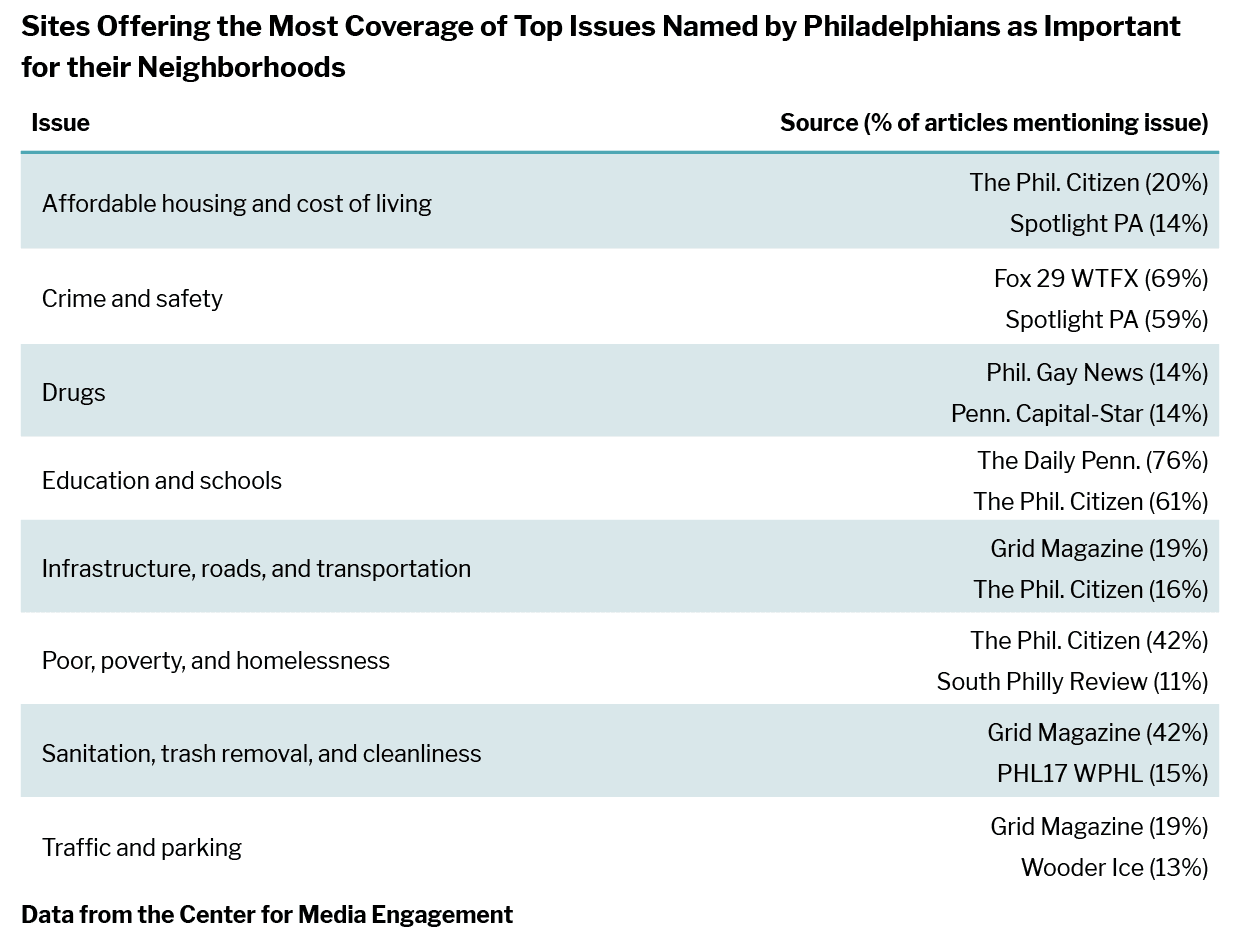
Some outlets in Philadelphia specialize in particular issues, giving the public places to turn for specific issues of interest. For the public’s top issues, we analyzed how issue mentions varied across local outlets for sites where we scraped more than 100 articles.
Fox 29 (69% of articles) and Spotlight PA (59%) had the highest percentage of articles on their site that talked about crime and safety.
Articles using words related to sanitation, trash removal, and cleanliness were most commonly mentioned in Grid Magazine (42%).
Traffic and parking were mentioned most in Grid Magazine (19%) and Wooder Ice (13%) and drugs were discussed most in Philadelphia Gay News (14%) and Pennsylvania Capital-Star (14%).
The table displays sites where we scraped more than 100 articles, yet there were some noteworthy patterns for sources publishing fewer articles. All articles scraped from The Philadelphia Obituary Project mentioned crime and safety. Around a fourth of Hidden City Philadelphia and Philadelphia Neighborhoods articles mentioned sanitation, trash removal, and cleanliness. A similar percentage of Uwishunu articles used words related to traffic and parking, nearly four in ten articles on the Kensington Voice mentioned drugs, and nearly a fifth of Naked Philly articles used words related to infrastructure, roads, and transportation. Poor, poverty, and homelessness were mentioned in a third of articles appearing on Chalkbeat Philadelphia and half of Love Now Media articles, although Love Now Media posted few articles during the time period. Affordable housing and the cost of living appeared in around three in ten articles posted by Hidden City Philadelphia and Temple News. Eight in ten articles from Temple News and every article from Chalkbeat Philly used words related to education and schools.
We also looked at patterns of coverage for issues mentioned as important by the public less frequently than those displayed in the table.
- Grid Magazine had a high percentage of articles using words related to climate change, pollution, and the environment (56%), and to parks, green space, and recreational opportunities (56%) relative to other media outlets in Philly.
- The Philadelphia Tribune had a higher percentage of articles related to inequality (33%) and race (41%).
- The Philadelphia Citizen had a higher percentage of articles using words related to guns and gun control (31%), public services and resources (17%), and police reform (5%).
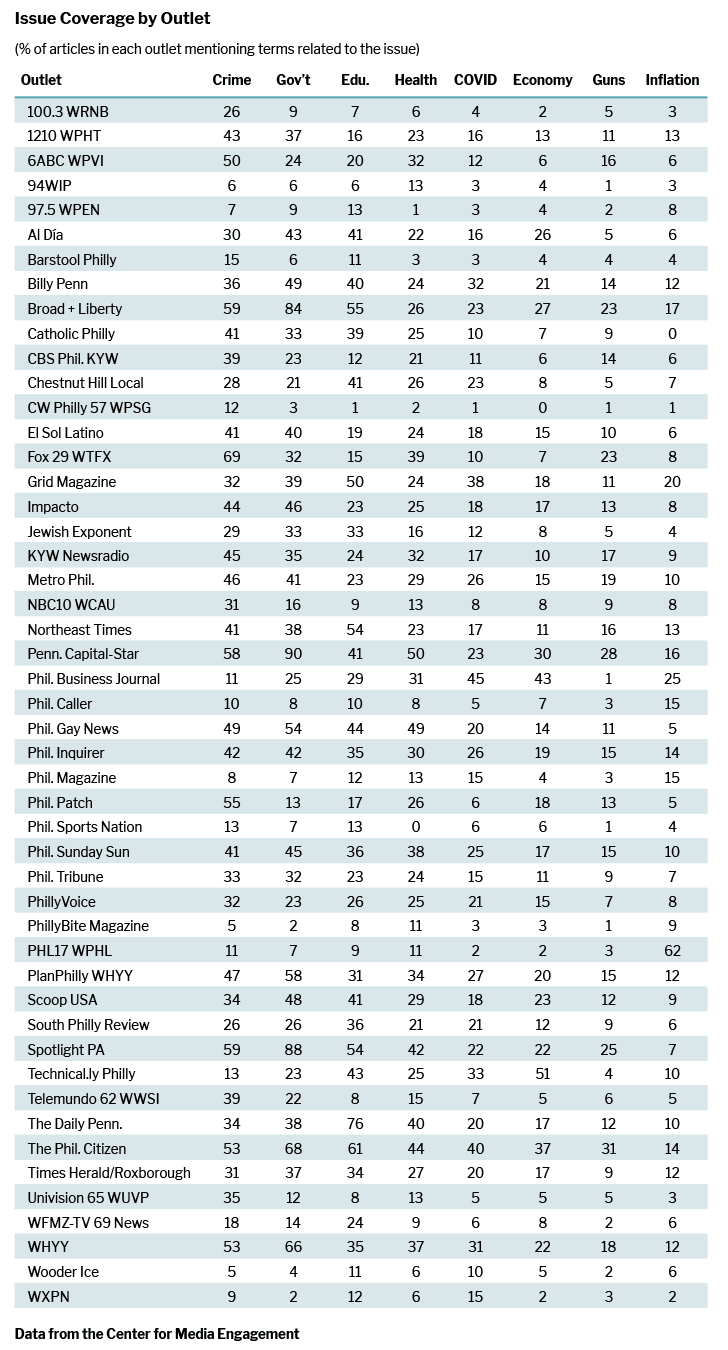
We next examined how often various outlets mentioned the eight issues appearing most frequently throughout the Philly media. Here, the data are displayed in rows. In the first row, for example, 26% of articles from 100.3 WRNB included words related to crime and safety.
Places in Local Media
We analyzed Philadelphia places mentioned five or more times throughout all of the media we scraped. We examined how often places in each of the seven regions were mentioned. As seen in the image below, locations in South Philly / Center City were the most mentioned, followed by North Philly. One way to assess the amount of coverage is to compare it with the population of the region. Based on Census data, North Philly has the most residents, followed by Upper Northeast Philly and Lower Northeast Philly.
Based on the Census comparison, Northeast Philly is covered comparatively less relative to its population size and South Philly / Center City is covered comparatively more.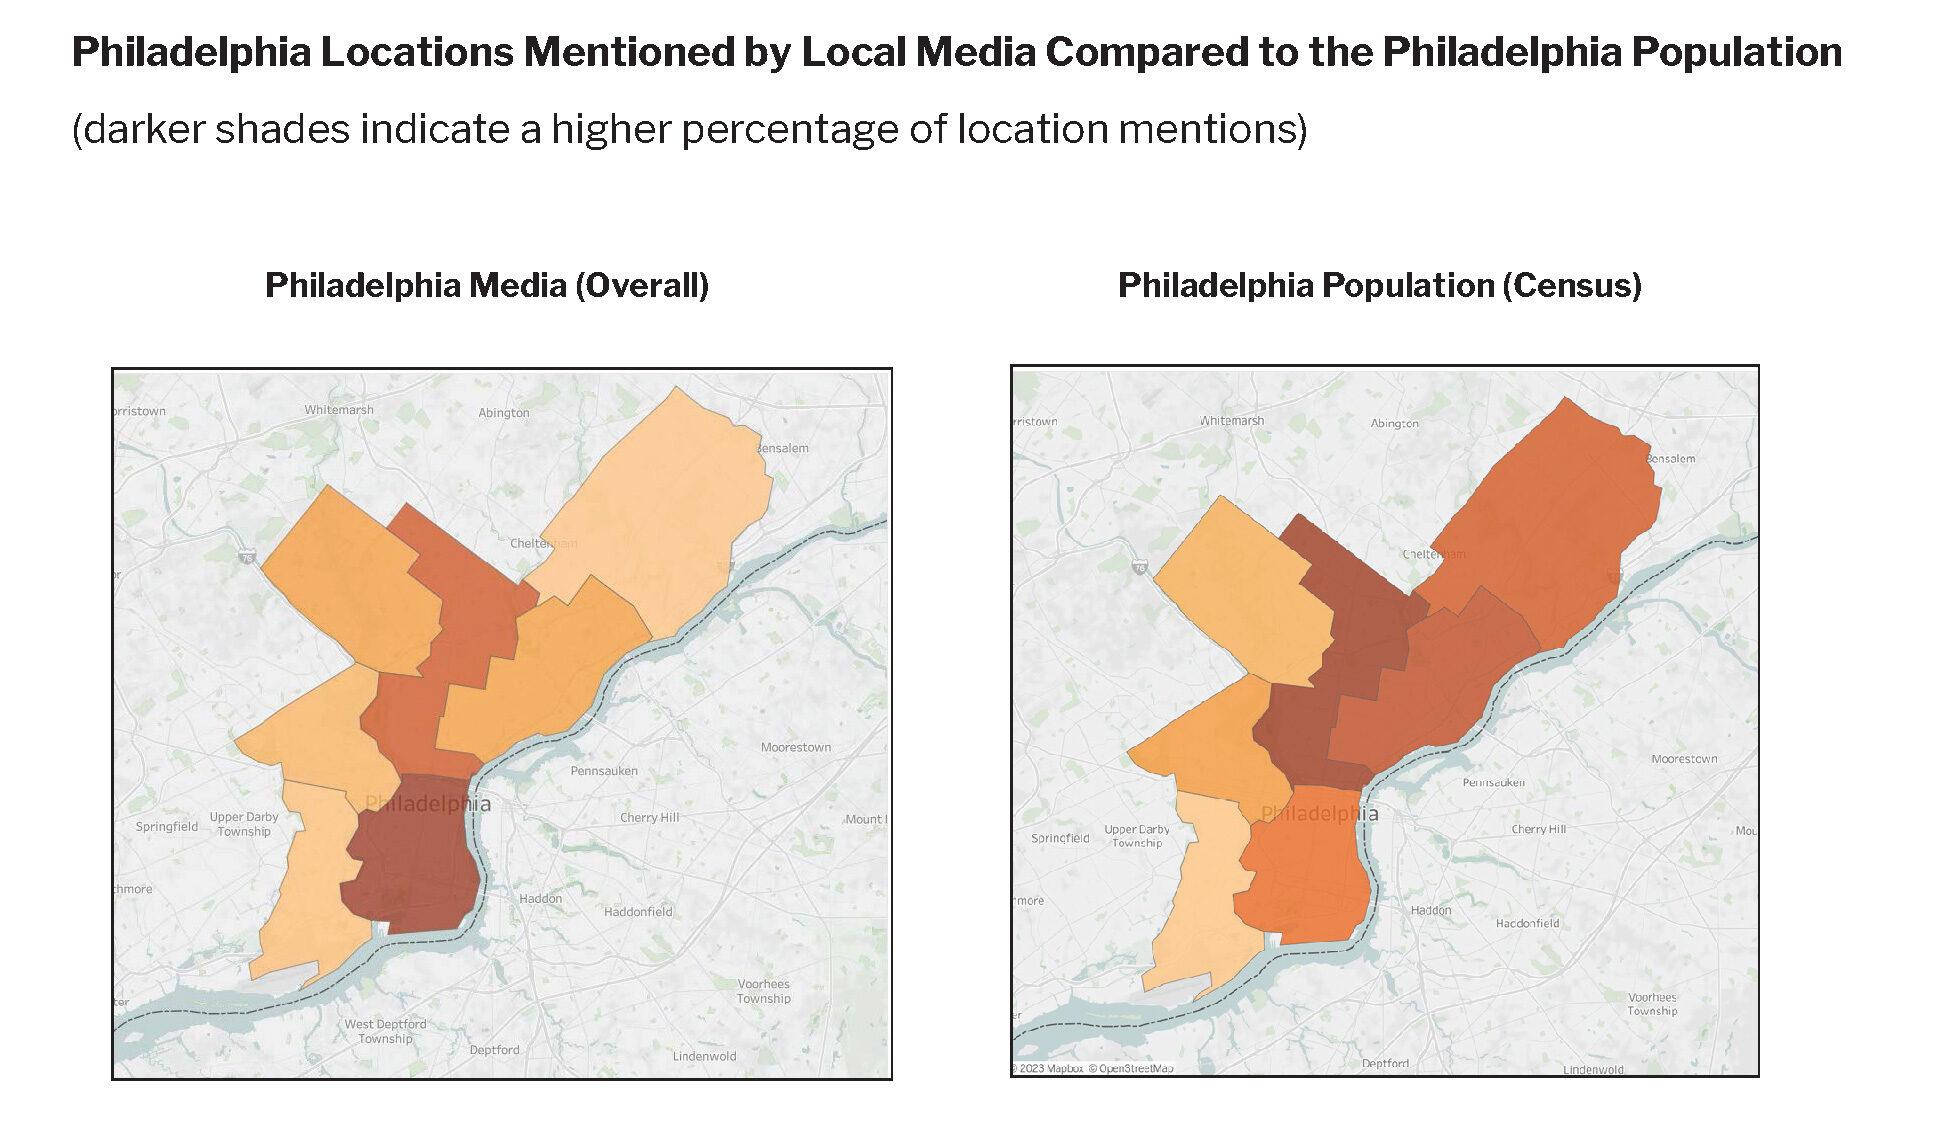
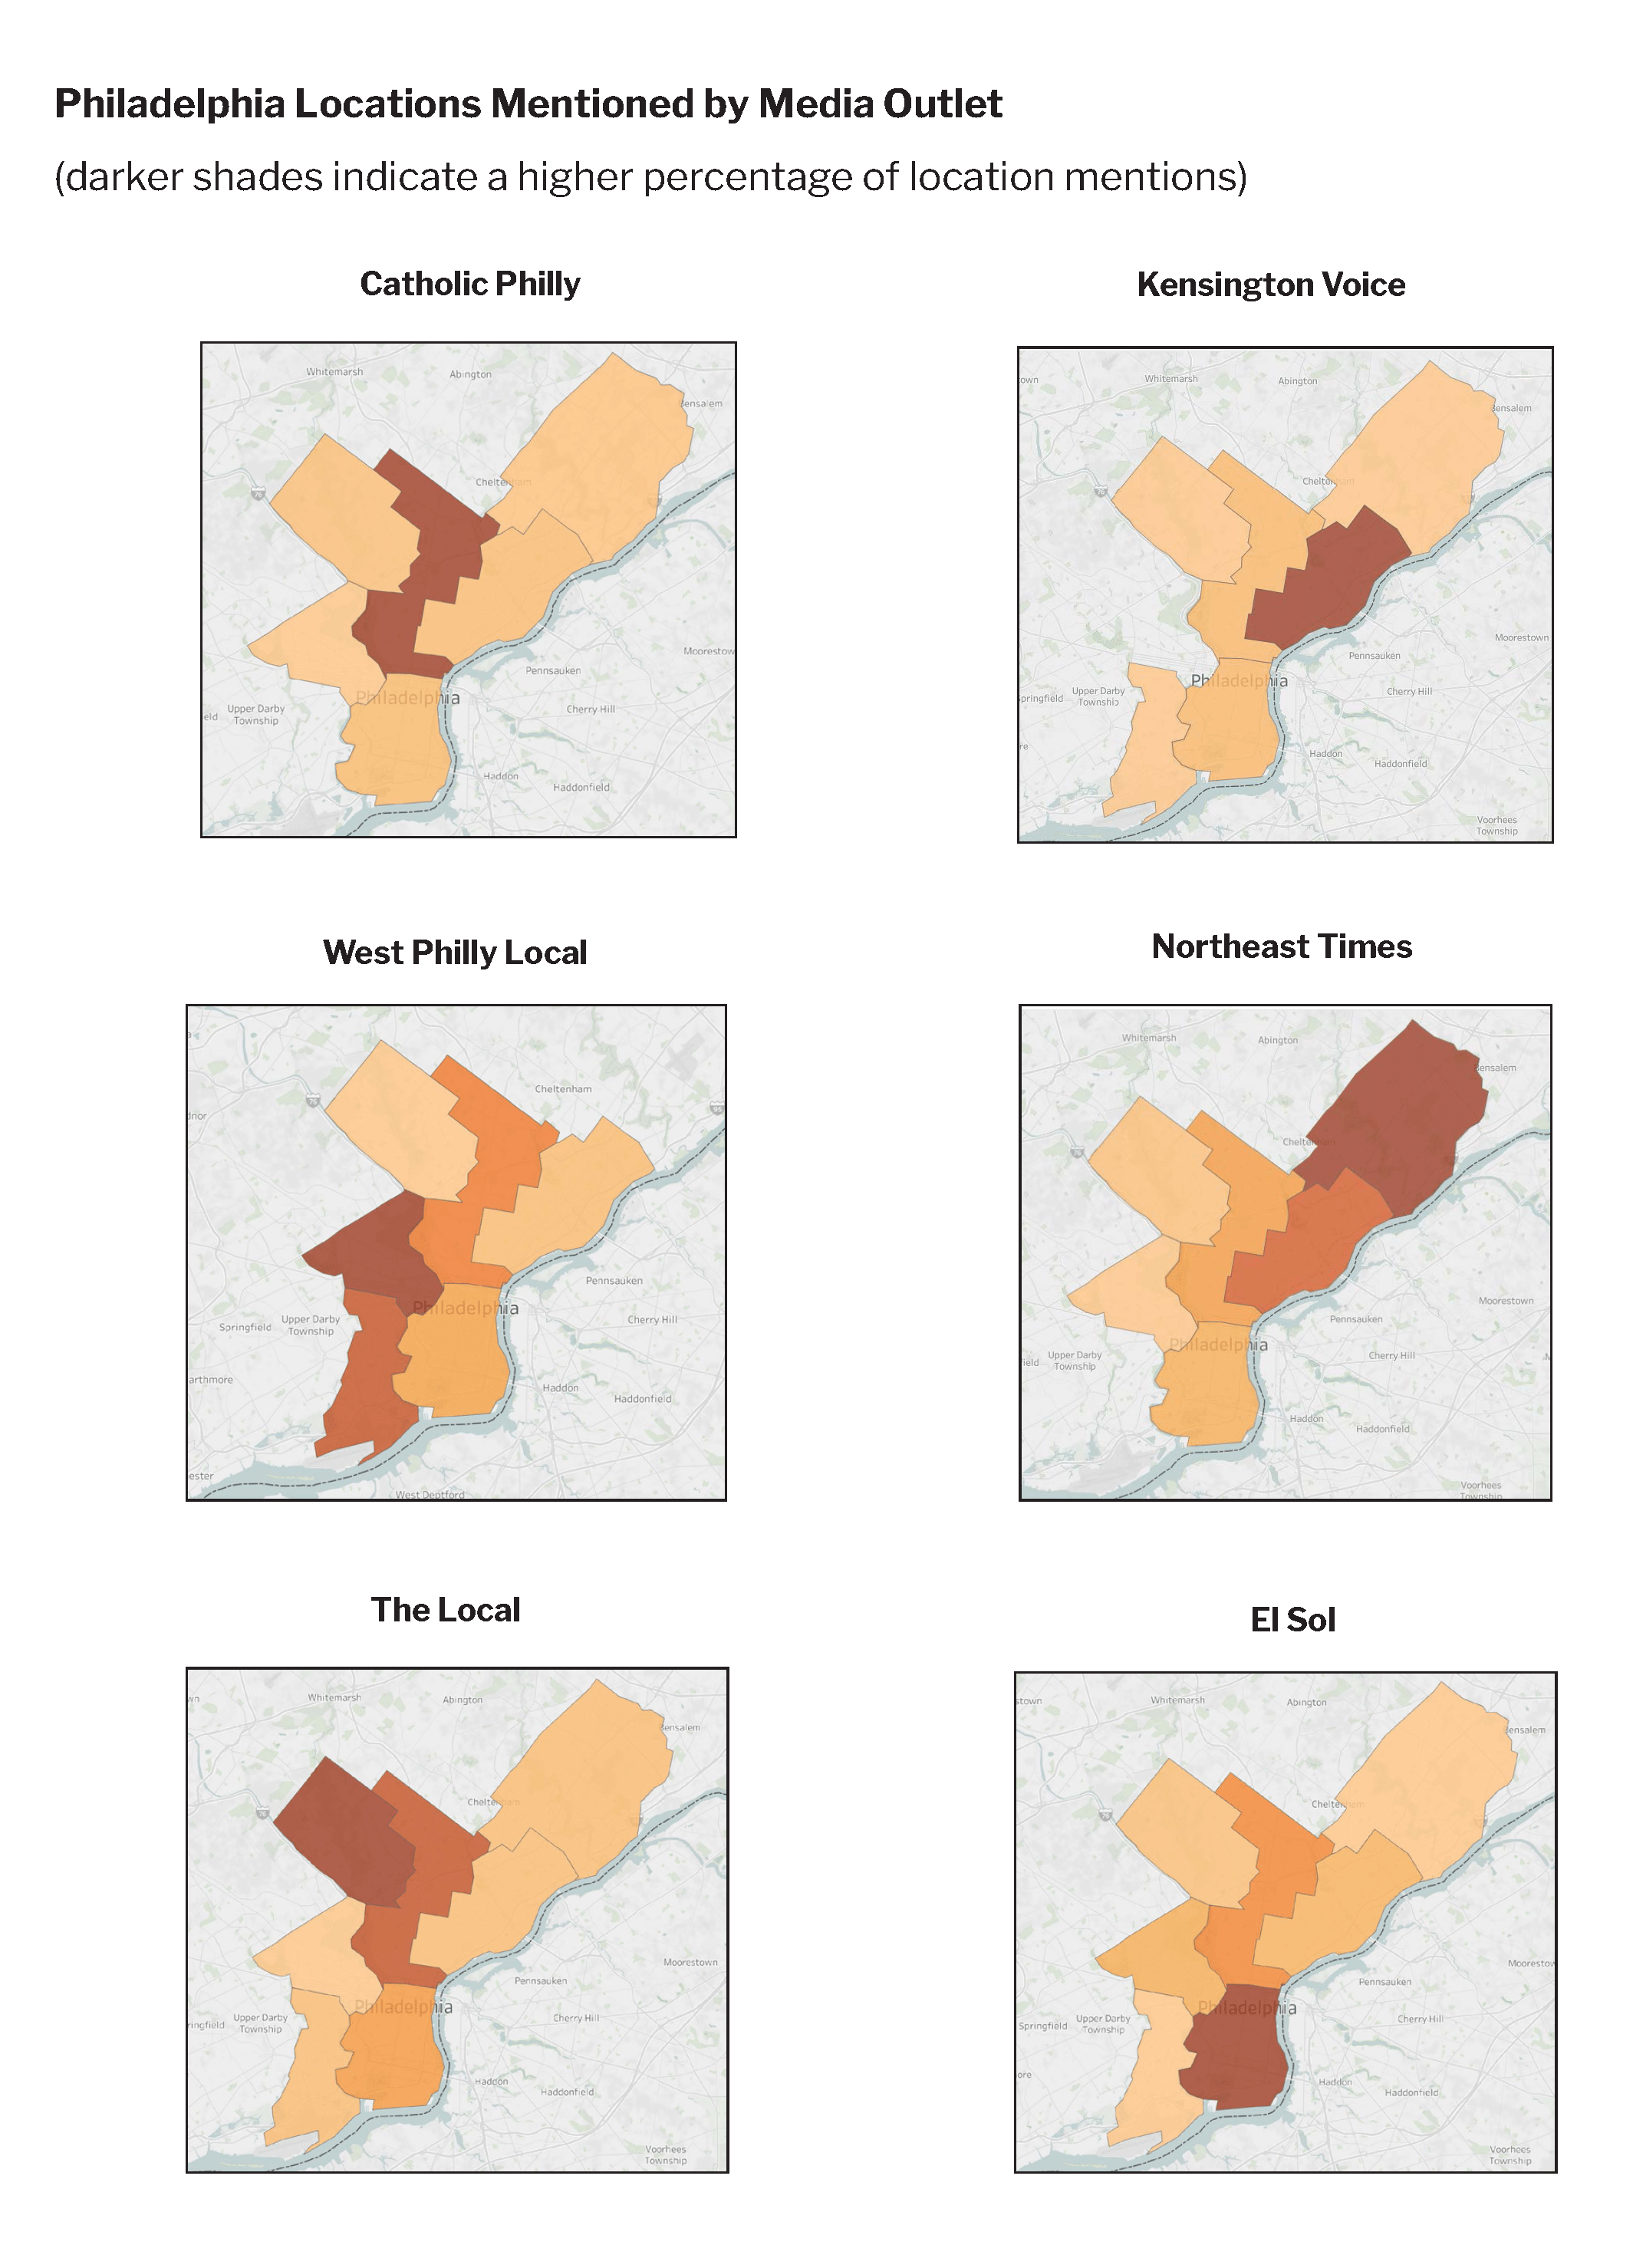
Next, we identified examples of different patterns of coverage. Catholic Philly, for example, mentioned locations in North Philly more often than other parts of the city. Kensington Voice mentioned Lower Northeast Philly more often. West Philly Local mentioned West Philly and Southwest Philly more often than other parts of the city. Coverage from the Northeast Times mentioned locations in Upper Northeast Philly and Lower Northeast Philly. The Local focused on Northwest and North Philly and El Sol reported most often on South Philly / Center City.
Local Media Use
We next analyzed where Philadelphians turn to for information about Philadelphia. Television (69%) and social media (68%) were the most popular. These sources were followed by family, friends, and colleagues (59%), websites or apps (52%), radio (40%), and print or digital newspapers (30%). All other sources of information about which we asked were named by fewer than 30% of Philadelphians.
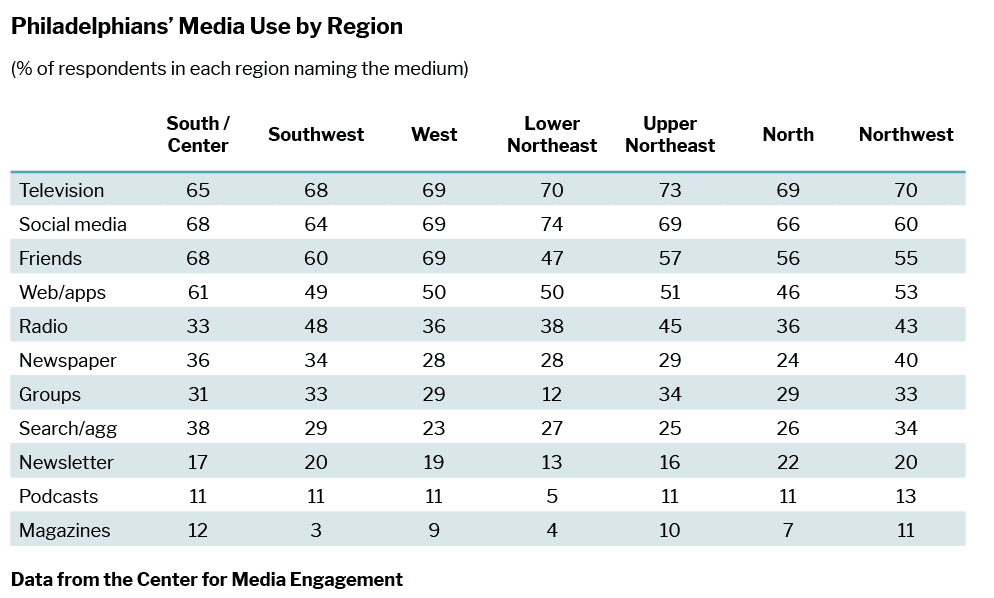
There were differences in where people got their news depending on where they lived for some, but not all, of these media types.
A similar percentage of people throughout Philadelphia got information about the city from television and social media; both were among the top three sources of information for all regions of Philadelphia.
There was more variation in the other sources. Friends, family, and colleagues were mentioned more frequently by those living in West Philly (69%) and South Philly / Center City (68%) and least frequently by those living in Lower Northeast Philly (47%).
People used websites or apps and radio with similar frequency regardless of where they lived.
Print or digital newspapers were named as frequent sources more often by those in Northwest Philly (40%) and in South Philly / Center City (36%) than by those in North Philly (24%). Those in other parts of the city fell somewhere in between.
Social groups, religious groups, or community organizations were mentioned less frequently by those in Lower Northeast Philly (12%) than those in other parts of Philly, where between 29% and 34% per region said that they used these sources.
Search engines or news aggregators were used more by those in South Philly / Center City (38%) than by those in West Philly (23%).
People used newsletters and podcasts with similar frequency regardless of where they lived. More people in South Philly / Center City reported using magazines (12%) than those in Southwest Philly (3%).
Internet and Device Use
Internet use was common in our study; 91% of our sample noted that they used the Internet or email at least occasionally. Internet use was highest among those living in South Philly / Center City (96%) and least common among those living in Upper Northeast Philly (85%).
Mobile device use for news, whether a smartphone or tablet, also was common in our sample, with 93% of Internet users reporting that they get news on these devices “sometimes” (21%) or “often” (72%).
Desktop and laptop use for news were less common, with 35% of Internet users reporting that they “often” get news from these devices and an additional 33% reporting that they “sometimes” get news from these devices. From 1 (never) to 4 (often), average desktop and laptop computer use for news was 2.8. There was some variation in desktop and laptop use for news by Philadelphia region. Internet users in Northwest Philly reported getting news on these devices an average of 3.1, followed by those in South Philly / Center City (3.0) whereas those in Lower Northeast Philly reported an average of 2.4.
Sources Used
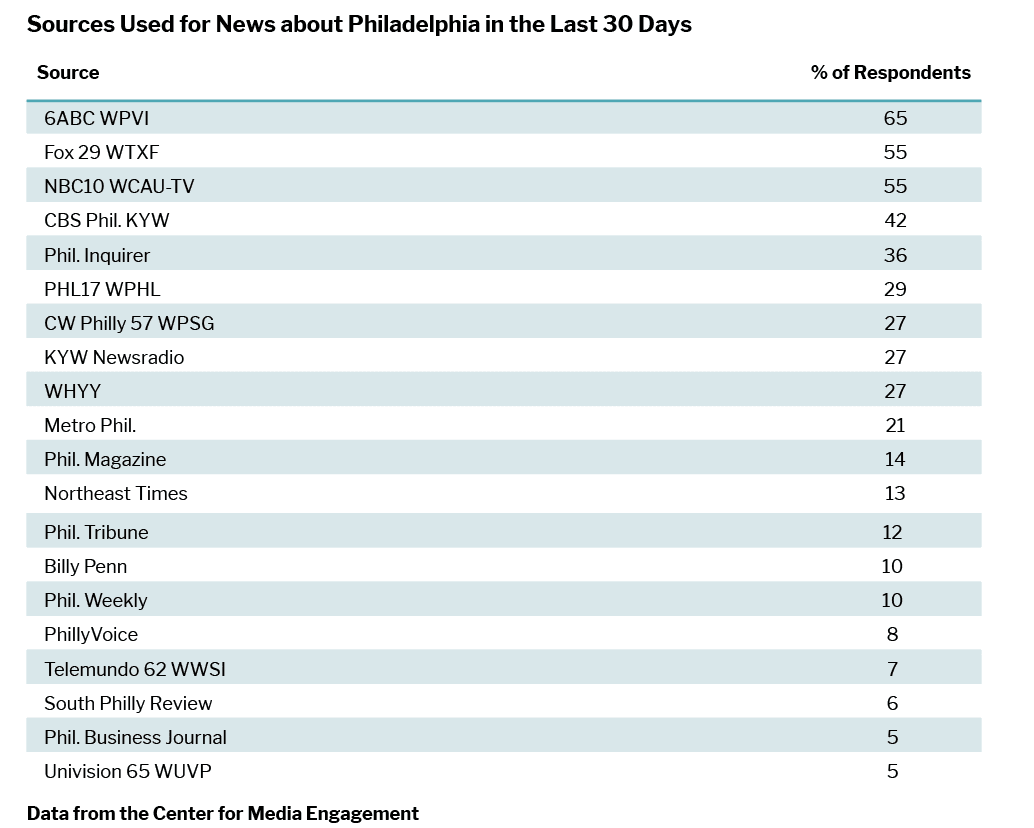
Survey respondents were asked to indicate which sources they used in the past 30 days for news about Philadelphia. On average, respondents indicated that they used five different news sources. Local television outlets were the most used source for location information.
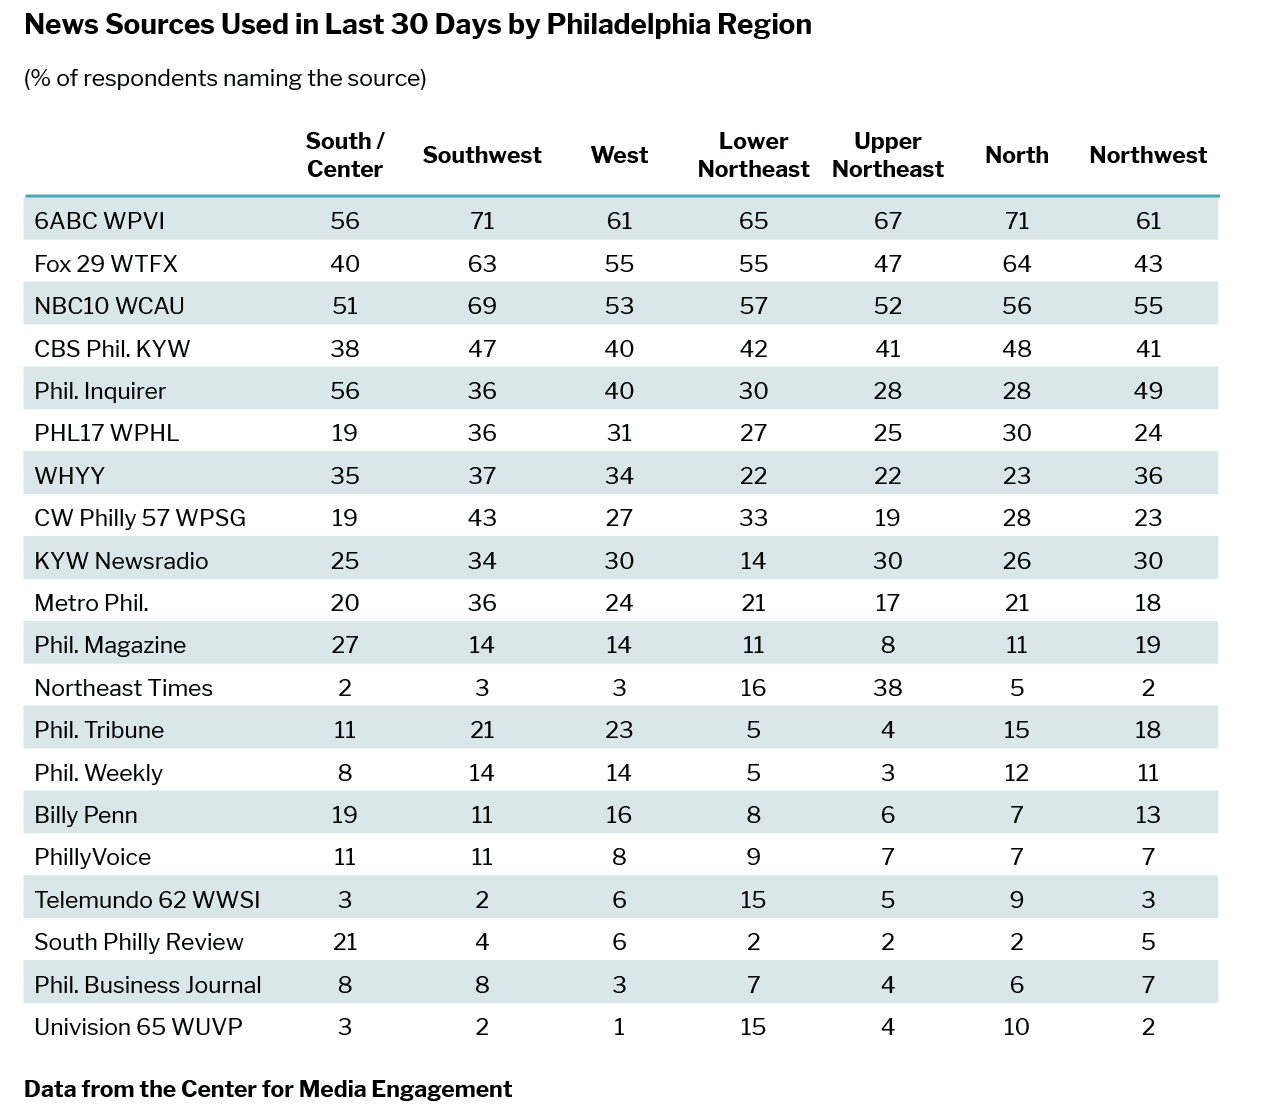
People used different sources depending on where they lived in the city. Fox 29, for example, was most used by those living in North Philly (64%) and Southwest Philly (63%) and least by those living in South Philly / Center City (40%).
Of the outlets shown in the table, two stand out for having geographically divided media use patterns. The Northeast Times had the most divided pattern: 38% of those living in Upper Northeast Philly and 16% of those living in Lower Northeast Philly used it. Fewer than five percent of those living in other regions used it.
The Philadelphia Inquirer had the second most geographically divided media use pattern. More people in South Philly / Center City (56%) and in Northwest Philly (49%) used the paper or website than in North Philly (28%), Upper Northeast Philly (28%), and Lower Northeast Philly (30%).
A similar percentage of respondents in each region used 6ABC, NBC10, and CBS Philadelphia.
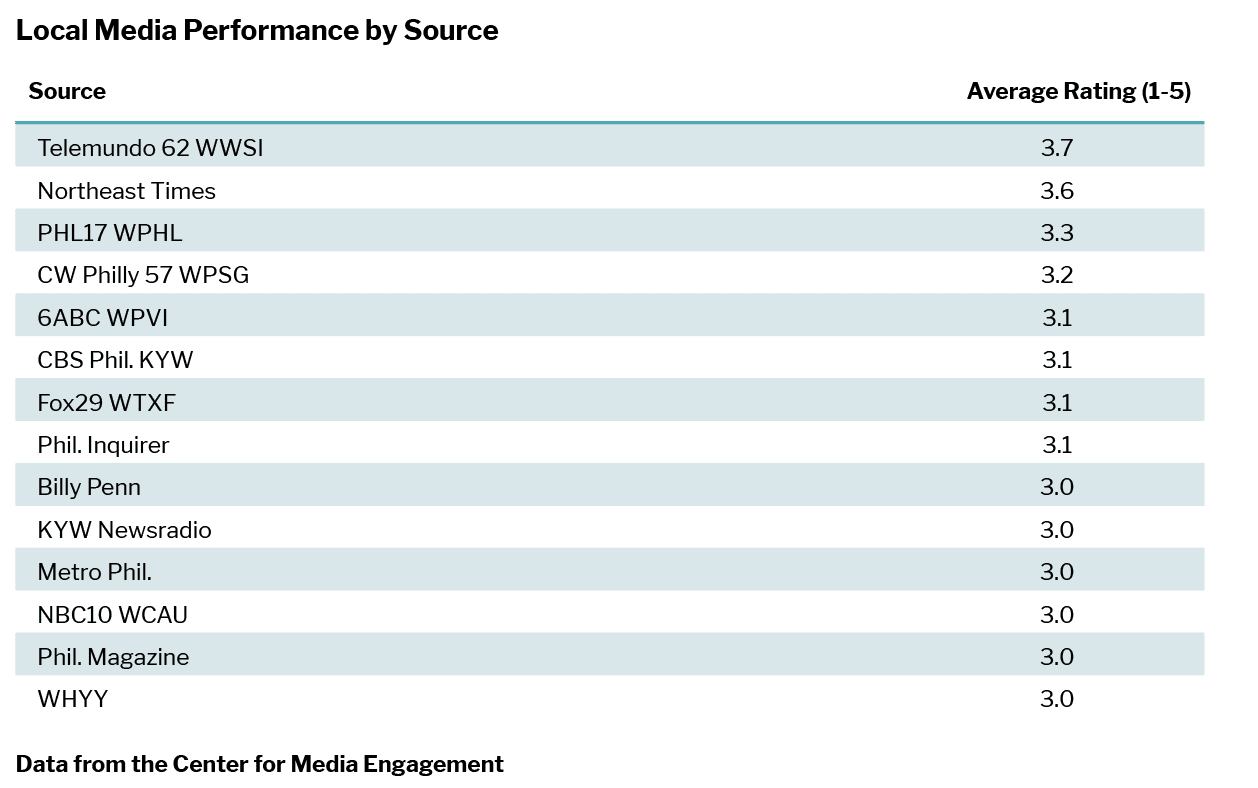
For the three sources they used most, survey respondents were asked to rate how good of a job the source was doing in covering their neighborhood from 1 (very poor job) to 5 (very good job).8 The two publications that earned the highest scores were Telemundo 62 WWSI, which serves Spanish speakers in Philly, and the Northeast Times, which serves the Northeast region in Philly.
Local Media Assessments
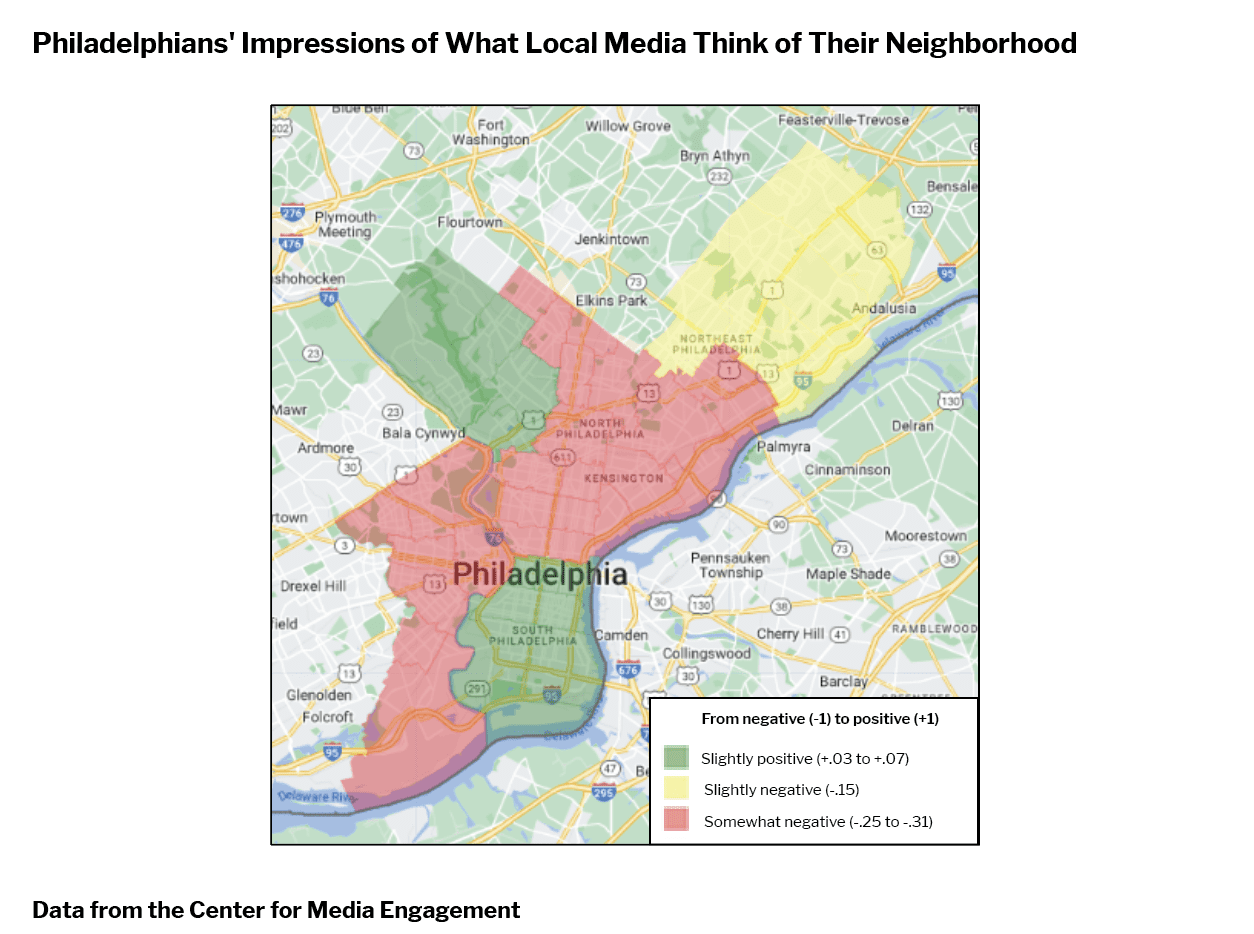
We asked people “If you were to describe the way that the Philadelphia news media thinks about your neighborhood, what two or three words would you use?” People’s responses were categorized as positive (+1), negative (-1), or neutral (0) and then we computed the average for each Philadelphia region. Those in South Philly / Center City had slightly positive assessments.10 These scores were followed by the assessments of those in Upper Northeast Philly and in Northwest Philly who had just slightly negative impressions. Those living in Southwest Philly, West Philly, Lower Northeast Philly, and North Philly perceived that the news media has a negative impression of their neighborhood.
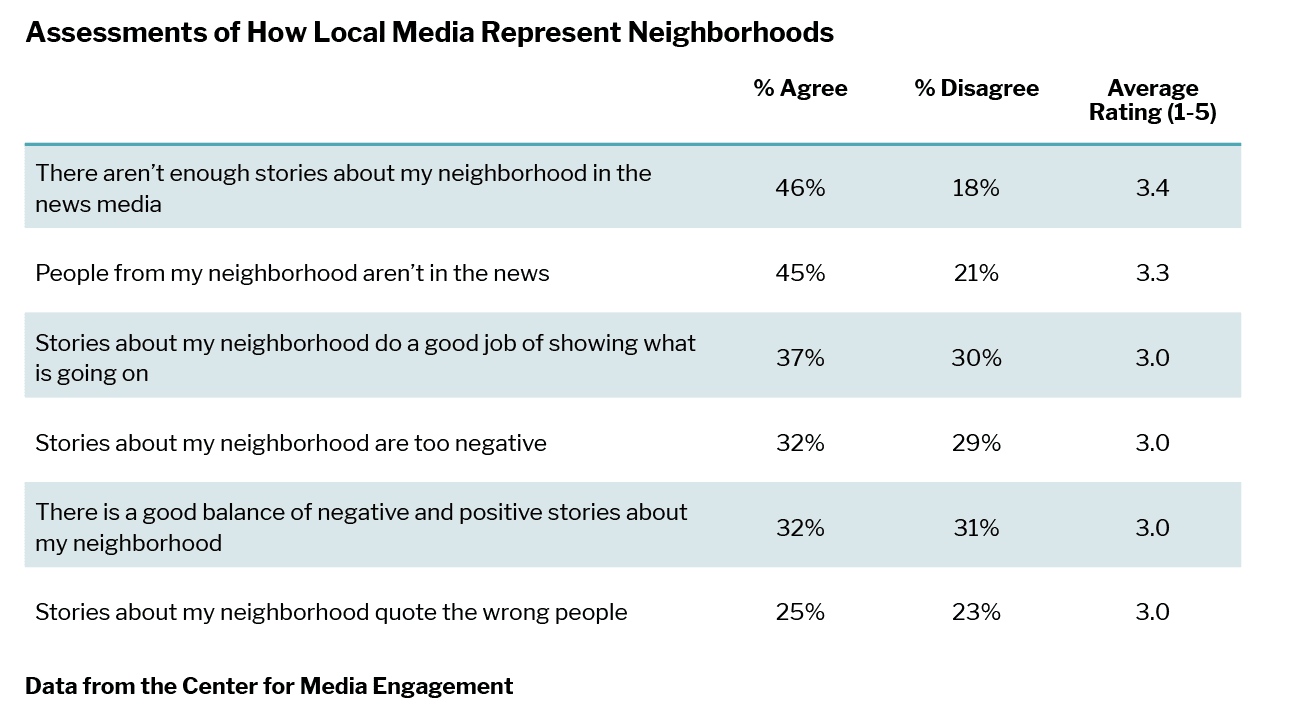
We next look at Philadelphians’ thoughts about specific aspects of the media. Philadelphians, in general, thought that local media do slightly above average in representing their neighborhood. As shown on the following table, ratings of the media tend to hover slightly above average from 1 (strongly disagree) to 5 (strongly agree).
Nearly half of Philly respondents agree that there aren’t enough stories about my neighborhood in the news media (46%) and people from my neighborhood aren’t in the news (45%). Only a quarter of respondents thought that stories about my neighborhood quote the wrong people.
For most of these questions, people didn’t answer differently depending on the region where they lived. There are two exceptions.
- When asked whether people from my neighborhood aren’t in the news, regional responses ranged from 55% of those from Upper Northeast Philly agreeing with the statement to 38% of those from West Philly agreeing.
- When asked whether stories about my neighborhood are too negative, those in Southwest Philly (43%), North Philly (39%), Lower Northeast Philly (38%), and West Philly (38%) were more likely to agree with the statement than those in South Philly / Center City (21%), Northwest Philly (20%), and Upper Northeast Philly (14%).
We also asked participants whether they thought that there were media organizations in Philly that represented them. Overall, the Philadelphia media earned average to slightly below average scores. People rated Philadelphia news organizations lowest on offering solutions to problems facing my community and only slightly higher on the other questions about representation. There were no differences by region in how represented people felt by news media organizations in Philly.

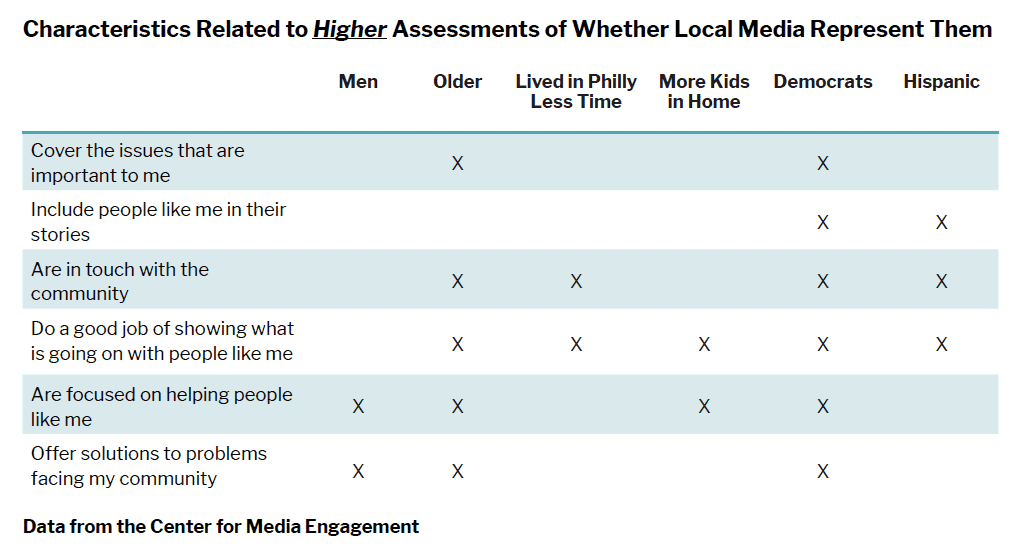
Other factors beyond where people lived influenced their responses to questions about whether they believed that the media represent them. As before, we analyzed gender, age, race, education, income, years spent living in Philadelphia, years spent in the same neighborhood, living situation (rent, own, mortgage, or other), number of adults in the home, number of children in the home, and partisanship. We show those factors in the table below that predicted two or more of the representation questions.
Older Philadelphians and those who identify as Democrats believed that local media represented them better, which means there is an opportunity to reach younger Philadelphians (the younger the respondent, the lower the assessment on average) and Republicans (the more strongly one identifies as a Republican, the lower the assessment on average).
Hispanic respondents were more likely than other respondents to believe that there were news media organizations in Philly that represented them — perhaps a reflection of the comparatively high marks that Telemundo 62 WWSI received for covering what is happening in local neighborhoods from a few pages earlier.
Men, those living in Philly for fewer years, and those with more kids in their home felt better represented. This suggests some opportunity for reaching women, long-time residents, and those without kids.11
Interacting with Journalists
Around 20% of Philadelphians have communicated with a journalist, whether in person, on the phone, or through the Internet. There’s slight variation across the city, from 14% in Upper Northeast Philly to 31% of those in Southwest Philly indicating that they had done so.
Throughout Philly, 13% reported having been to an event hosted by a news organization. This did not vary by region.
When asked whether they would be interested in talking with a journalist about issues facing their neighborhood from 1 (not at all interested) to 4 (very interested), Philadelphians’ average interest was 2.3. There was some variation by region, with those in Southwest Philly expressing the greatest interest (2.7) and those in Upper Northeast Philly (2.1) and South Philly / Center City (2.2) expressing the least interest.
When asked about volunteering to report on a public meeting at the request of their local newsroom, such as at a City Council or School Board meeting from 1 (very unlikely) to 5 (very likely), the average response was 2.9. Those in Southwest Philly indicated the greatest likelihood (3.2) whereas those in Upper Northeast Philly indicated the lowest likelihood (2.5).
Efficacy and Impact
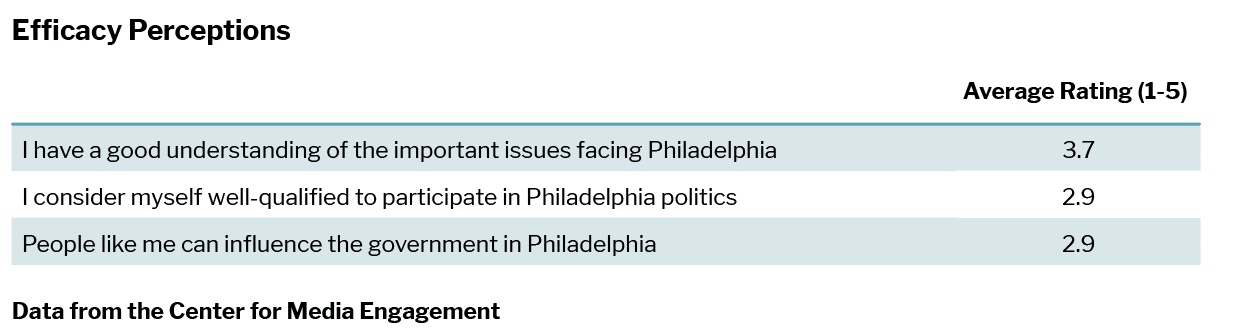
Survey respondents were asked to indicate how they felt about their abilities to participate in, understand, and affect Philadelphia politics and issues from 1 (strongly disagree) to 5 (strongly agree). The results show that Philadelphians expressed the greatest agreement with their ability to understand important issues (3.7) facing Philadelphia, but had less confidence in their qualifications to participate in politics (2.9) and in their ability to influence government (2.9).
There were differences across Philadelphia for beliefs about influencing government. Here, responses ranged from 2.7 in Upper Northeast Philly and South Philly / Center City to 3.2 in Southwest Philly.
Respondents were asked how much impact they thought that people like them can have in making their community a better place to live from 1 (no impact at all) to 4 (a big impact). On average, people thought that they would have a small to moderate impact (2.8). Those in Upper Northeast Philly (2.5) and South Philly / Center City (2.6) rated their ability lower than those in the rest of Philadelphia.
Respondents were also asked how much impact they thought that local news media have on making their community a better place to live. People thought that the local news media had a small to moderate impact (2.7). There were no differences depending on where in Philadelphia people lived.
Paying for News
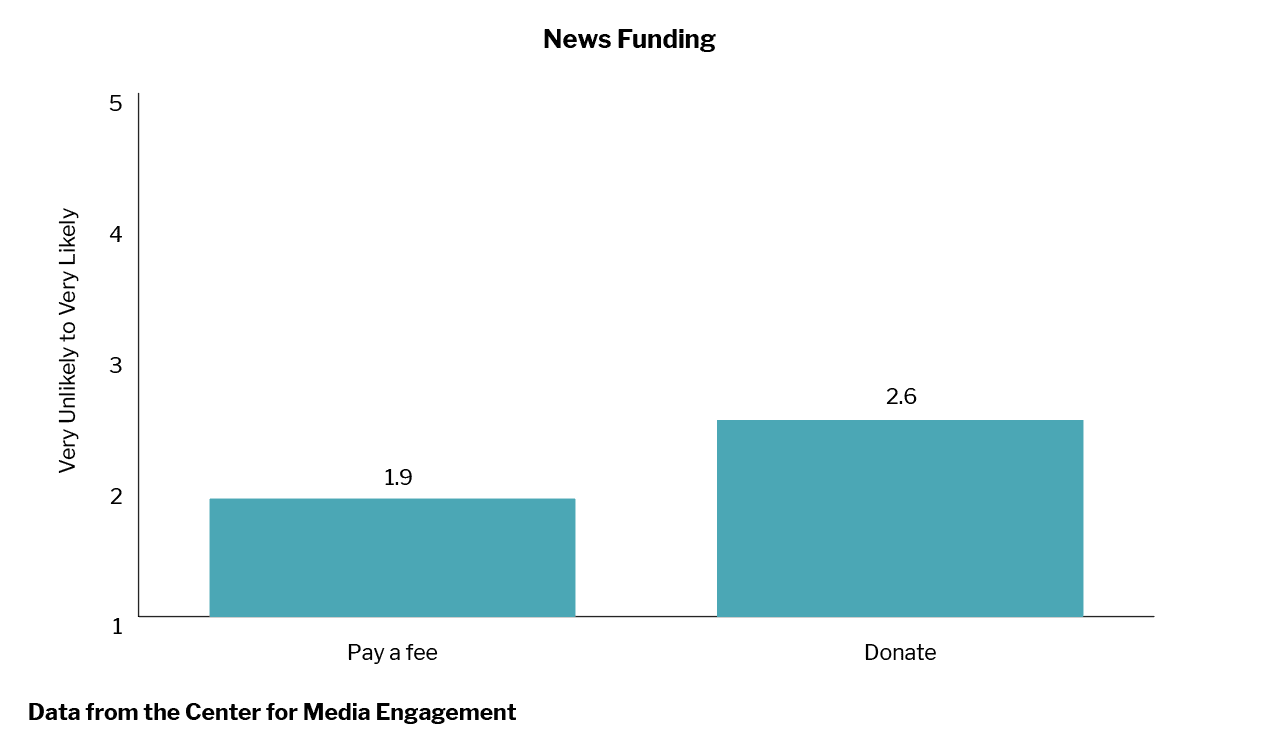
We asked half of the respondents to tell us if they would donate $10/month to support the mission of a local news organization providing news about their neighborhood online for free and for anyone to access. We asked the other half of the respondents to tell us if they would pay a fee of $10/month to access a local news organization that provided news about their neighborhood on their website. Respondents were asked to indicate how likely they would be to part with their money from 1 (very unlikely) to 5 (very likely).
On average, Philadelphians indicated that they were unlikely to pay for news. They were more likely, however, to say that they would donate their money to a local news site than they would be to pay a fee for local news. There were no differences in the responses by Philadelphia region.
Overall, 12% of Philadelphians reported that they currently subscribe or donate to a news organization. There was variation by region. The highest rates of subscription and donation were in Northwest Philly (24%) and South Philly / Center City (19%). The lowest rates occurred in Lower Northeast Philly (10%), North Philly (9%), and Upper Northeast Philly (6%).
Several additional factors predicted subscribing or donating to news. Older, more educated Philadelphians with higher incomes and who owned their own home were more likely to subscribe or donate to news. Those living in Philly for more years were less likely to do so.
When asked to name the news organization(s) to which they currently subscribe or donate, 5% mentioned The Philadelphia Inquirer, 4% The New York Times, 2% WHYY, and 1% each mentioned The Wall Street Journal and The Washington Post. Other organizations were mentioned less often.
Who Funds Philly News Outlets
To analyze who funds news outlets in Philadelphia, we looked at the websites of the news organizations included in this report and contacted outlets that did not list their funding sources up to three times by email and up to three times by mail. We obtained funder information for 23 news outlets in Philadelphia. We shared this list with staff from The Lenfest Institute and the Independence Public Media Foundation, who added funders and removed those who were not regular funders in the space. We then reviewed the websites of the recommendations, resulting in the list of frequent media funders in the city shown below.
- Barra Foundation
- Bread & Roses Community Fund
- HealthSpark Foundation
- Independence Public Media Foundation
- Knight-Lenfest Local News Transformation Fund
- Lenfest Institute
- Miami Foundation
- Samuel S. Fels Fund
- Scattergood Foundation
- Stoneleigh Foundation
- The John S. and James L. Knight Foundation
- The Philadelphia Foundation
- William Penn Foundation
- Wyncote Foundation
Political Interest
Political interest in Philadelphia was mixed. Nine percent reported having “no interest” and an additional 13% said that they have “very little” interest. Thirty-six percent had “some,” 26% “quite a bit,” and 16% “a great deal.” On average, from 1 (no interest) to 5 (a great deal of interest), Philadelphians reported a 3.3.
There is some variation by region with those in Northwest Philly (3.5) and South Philly / Center City (3.4) expressing the greatest interest in politics and those in Upper Northeast Philly expressing the least (3.0).
Civic and Political Participation
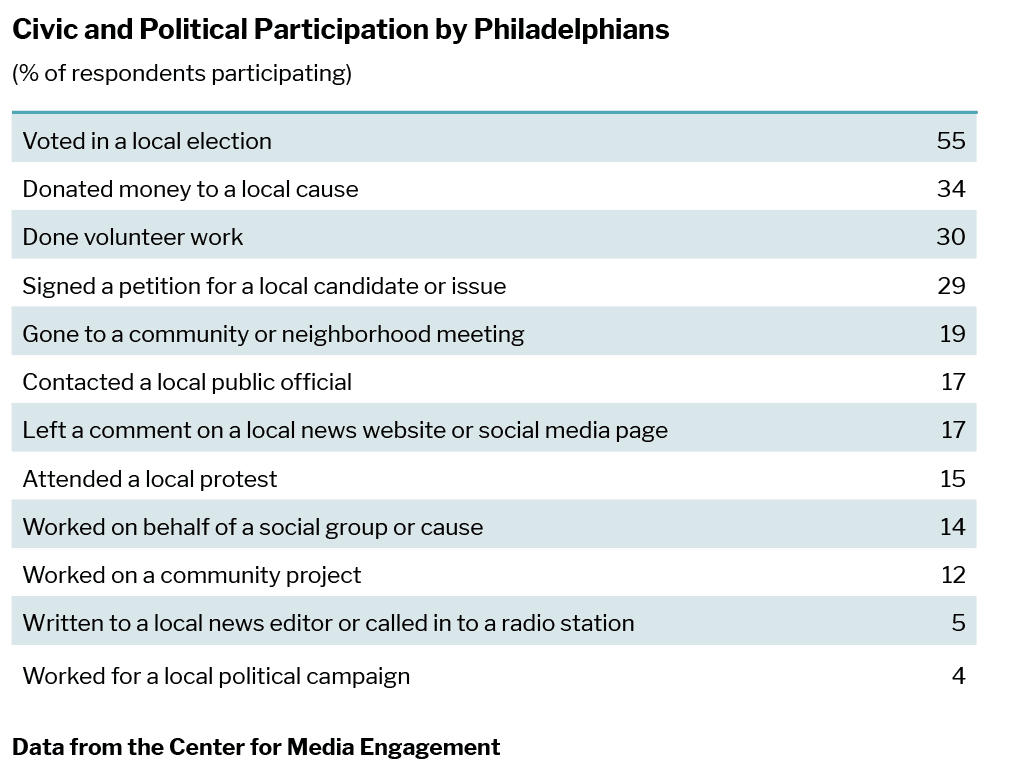
Philadelphians reported whether or not they had engaged in twelve civic and political activities. The most common activity in which they engaged was voting in a local election (55%) and the least common activities were writing to a local news editor or calling in to a radio station (5%) and working for a local campaign (4%).
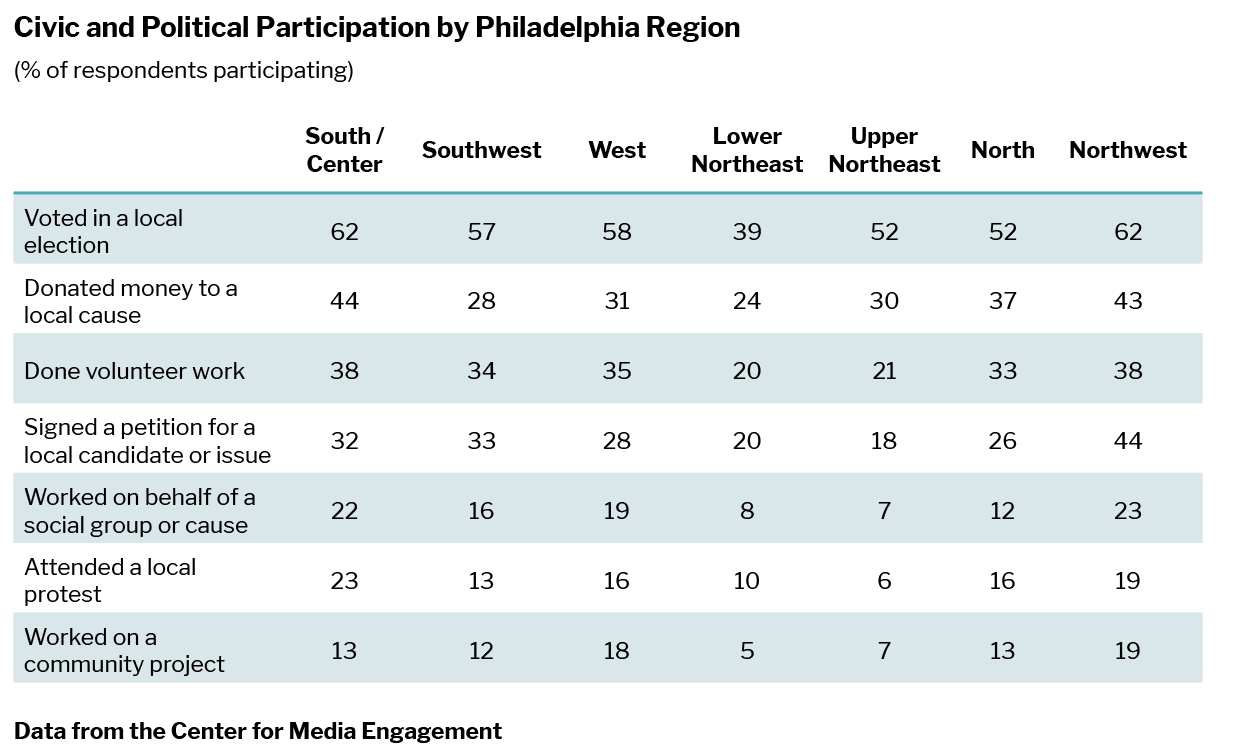
Participation in some of these civic and political activities varied by Philadelphia region. In general, when there were differences by region, those in South Philly / Center City and Northwest Philly tended to have the highest rates of civic and political participation and those in Lower Northeast Philly and Upper Northeast Philly had the lowest.
South Philly and Center City
South Philly and Center City were combined into one region in our analysis. After reviewing the results, however, we were curious whether there were meaningful differences between these two parts of Philadelphia.12 We note that the sample sizes here are small, limiting our ability to detect significant differences. There are, however, some differences worth noting.
- In many instances, those in South Philly and Center City thought similar issues were important for their neighborhoods. Two exceptions stood out:
- More people living in Center City named poor, poverty, and homelessness as important issues (52%) compared to those living in South Philly (17%)
- More people living in Center City named noise as an important issue (27%) compared to those living in South Philly (10%).
- Those in South Philly and Center City used similar media to get information about Philadelphia; a similar percentage noted that they used mediums such as television, social media, and family, friends, and colleagues.
- A similar percentage of people in South Philly and Center City used the Internet at least occasionally and people in these parts of Philly used mobile devices to get news with similar frequency. Internet users in Center City, however, used a desktop or laptop computer to get news more often (3.3) than those in South Philly (2.9), measured from 1 (never) to 4 (often).
- Use of specific news sources, such as 6ABC and Fox 29, were similar for those living in South Philly and Center City with one exception – South Philly Review, where 28% of those living in South Philly said that they used the source for news about Philadelphia in the past 30 days compared to 5% of those living in Center City.
- People living in South Philly and Center City had similar impressions of how well local media represented them and their neighborhoods.
- There were no differences in whether people had, or would like to, interact with journalists depending on whether they lived in South Philly or Center City.
- There were no differences in civic and political participation depending on whether people lived in South Philly or Center City.
METHODOLOGY
Dividing Philadelphia into Regions
It was necessary to divide Philadelphia into regions in order to have sufficient sample size to conduct the analyses. To do this, we first reviewed the demographic make-up of the city and how others had categorized various neighborhoods to come up with an initial proposal. We then shared the proposed regions at a series of community workshops conducted in January of 2021. Based on these meetings, we made a number of changes to the regions. The final seven regions are pictured below.
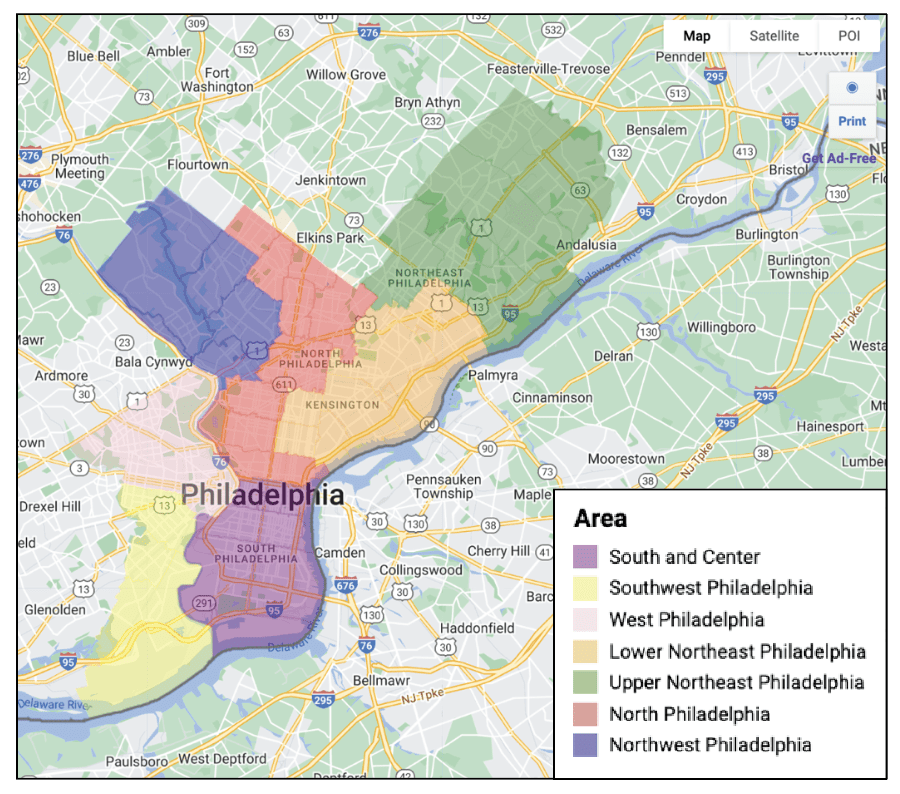
We note here that the sample sizes for West Philly, Southwest Philly, Upper Northeast Philly, and Lower Northeast Philly are approximately half of the sample sizes for South Philly / Center City, North Philly, and Northwest Philly.1 Smaller sample sizes mean that the margin of error is larger and differences between regions will be statistically significant less often. In the text, we highlight instances in which the differences between regions significantly differ.
Survey
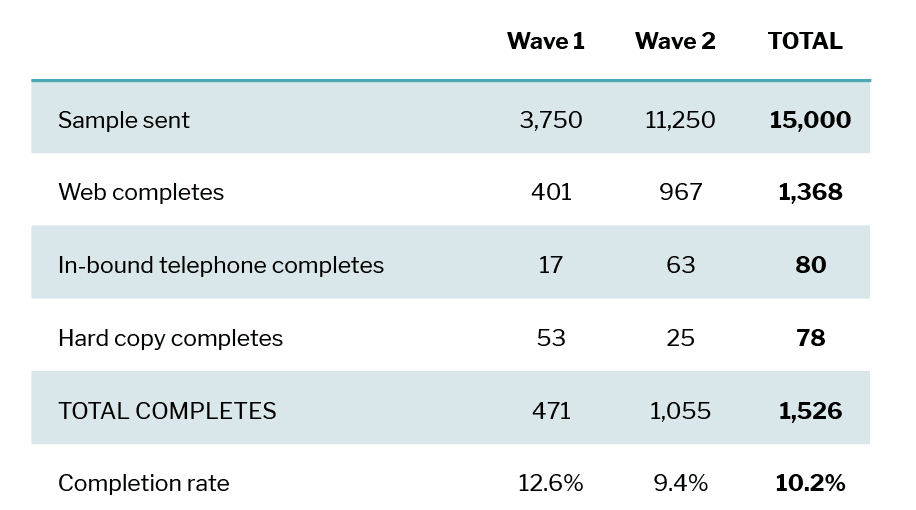
We contracted with SSRS to conduct a survey of Philadelphians. Below, we share details from the methodology as reported by SSRS. The target population was non-institutionalized adults age 18 or older living in Philadelphia County, Pennsylvania. Sampling was stratified by region according to the following table:
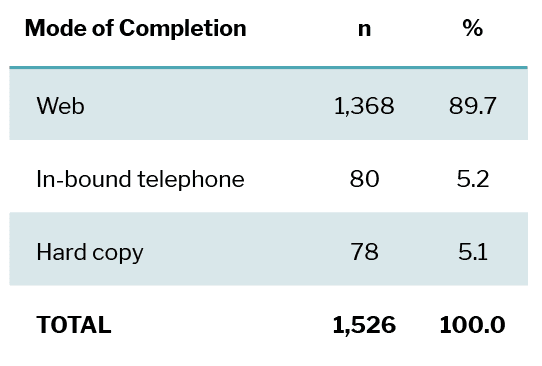
SSRS utilized an address-based sample (ABS) Mail to Web/Mail/Phone mixed-mode methodology, where SSRS mailed a representative sample of Philadelphia residents an invitation to log onto an online survey or complete and return a hard copy paper questionnaire. Respondents also had the option to make a toll-free, in-bound call to the SSRS call center if they preferred to respond that way. The number of completed interviews by mode is provided in the table below.
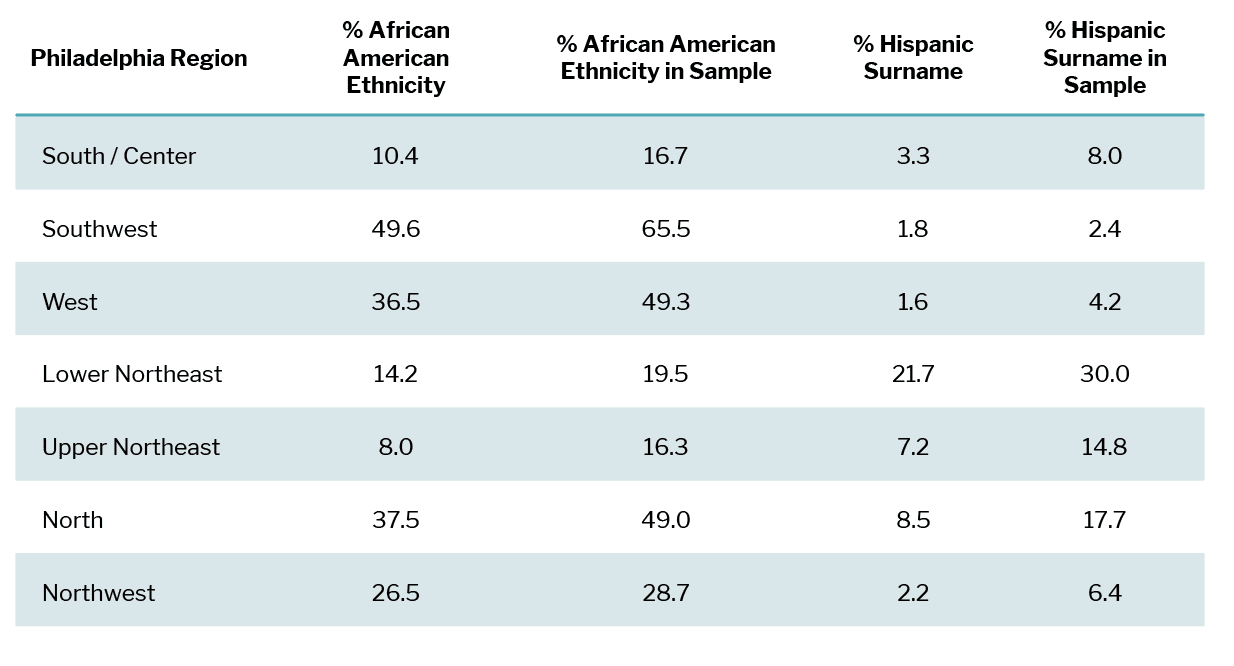
The ABS was drawn from the U.S. Postal Service Delivery Sequence File. SSRS selected a simple random sample of addresses in Philadelphia County. The sample was first stratified by region. Then, within region, the sample was stratified by ZIP code, and ZIP codes with higher incidences of Hispanic and African American residents were oversampled. SSRS’s experience informed them that hard-to-reach demographic groups such as Hispanics and African Americans are typically less likely to participate in similar studies. To account for the anticipated lower response from these groups, flags were appended to the sample frame and flagged records were sampled at higher rates to help increase sample representativeness.
ABS Mailing & Data Collection
To monitor yield and ensure quality, SSRS sent the ABS mail survey in batches. For this project, SSRS started the mailing protocol with Wave 1 batch of 25% of the sample. SSRS monitored the response to the first batch, ensured that the questionnaire and systems were working as intended, and then launched Wave 2 (remaining 75% of the sample) approximately four weeks later. This helped ensure that any critical issues were identified prior to having all the sample released. No major issues were identified when evaluating the Wave 1 sample.
Using the above design, all selected sample records were mailed a one-page study invitation letter. The text of the letter was printed in English and Spanish (two-sided). SSRS managed the Spanish translations of all study materials and the translations were checked by the Center for Media Engagement. The study was branded as the 2022 Survey of Philadelphia Residents. The invitation letterhead contained a study logo and was addressed to “Philadelphia Resident.” The text of the letter included a short web link for the survey (2022PhilaSurvey.com) and a personalized PIN to access the web survey. The letter included a $1 pre-incentive in cash (as an “exposed dollar” that respondents could see through the window in the envelope) and an offer for a $10 e-gift card payment upon completion of the survey. The $10 payment via an electronic code was disbursed immediately upon completion of the web survey and sent as cash via mail to respondents completing and returning the hard copy questionnaire or responding via in-bound telephone.
One week after mailing the initial invite letter, a reminder postcard was sent to target respondents. The postcard was fold-over style to allow for inclusion of the web link and the respondent’s personal PIN while preserving respondent confidentiality. The postcard was bilingual English and Spanish.
Two weeks after the reminders were mailed, hard copy questionnaire packets were mailed via first-class pre-sorted USPS mail. This mailing contained the following materials:
- Personalized cover letter explaining the nature of the survey
- One 12-page questionnaire booklet in English or two 12-page questionnaire booklets (one English and one Spanish) for ABS records flagged with a Hispanic surname
- Postage-paid business reply envelope (BRE)

The following table displays the completes by mode across each wave and in total along with the completion rates.
The survey’s margin of error is the largest 95% confidence interval for any estimated proportion based on the total sample – the one around 50%. For example, the margin of error for the entire sample is ± 3.4 percentage points. This means that in 95 out of every 100 samples drawn using the same methodology, estimated proportions based on the entire sample will be no more than 3.4 percentage points away from their true values in the population. Margins of error for subgroups will be larger. Maximum margins of error for the regions are ± 6.9 percentage points for North Philly, 7.3 for Northwest Philly, 9.2 for South Philly, 9.4 for West Philly, 9.7 for Upper Northeast Philly, 10.6 for Southwest Philly, and 12.4 for Lower Northeast Philly and Center City.
It is important to remember that the sampling fluctuations captured in the margin of error are only one possible source of error in a survey estimate. Other sources, such as respondent selection bias, questionnaire wording, and reporting inaccuracy, may contribute additional error of greater or lesser magnitude.
SSRS computed two sets of weights, one for the city of Philadelphia overall and second for each region. Data were weighted to be representative of residents aged 18 and older based on sex, age, education, race/ethnicity, and region. The weighted and unweighted sample demographics for Philadelphia overall are included in the table below.

Statistical analyses were conducted using Philadelphia weights or the regional weights, balanced to take the sample size into account, and the stratification of the sample by region.
Evaluating the Regional Classifications
Although we had input from the community on dividing Philadelphia into regions, we wanted to understand whether our categorizations had meaning to the study participants. Respondents were asked “What Philadelphia neighborhood do you live in?” We ordered their responses by region in order of how common they were. We only include terms mentioned by at least 10 people. For some parts of Philadelphia, there is a strong identity that matches our regional divisions, including South Philly / Center City, North Philly, West Philly, and Upper Northeast Philly. Although there was a Southwest Philly identity, there also were some in this region that identified as West Philadelphians. Those in Lower Northeast Philly did not consistently identify with this region and Northwest Philly was not a salient regional term.
Media Analysis
To analyze coverage in Philadelphia, we first created a list of Philadelphia media outlets. We began by combining lists that had been created by others. We are grateful to Dana Amihere, Victor Pickard, Rosemary Clark Parsons, Molly de Aguiar, Hannah Stonebreaker, and Lindsay Green-Barber for sharing. After combining these lists, we did our own search to see if we could identify additional outlets as well as consulted with others at The Lenfest Institute and in our community workshops to identify additional sources. In total, we identified 250 sources. We then reviewed this list, excluding news organizations that were not digital, were inactive (no articles between September 1 and December 7, 2021), had content that was not specific to Philadelphia or Pennsylvania, or was an organization that expanded beyond our definition of news. After this process, we had a list of 100 news sources.
We contracted with ScrapeHero, a web scraping company, to scrape articles posted to the websites between May 23, 2022 and July 28, 2022. They only scraped text from the sites. We monitored the ScrapeHero scraping by doing hand scraping and then examining whether the results matched. ScrapeHero ended up scraping data from 93 of the outlets, 10 of which did not have any articles during the study time period. We investigated the remaining seven sites; we were able to scrape three of them; one did not have any articles, and three were removed from the analysis for technical reasons.13 Although we made efforts to scrape the content as it was being posted, some sites scraped later in the process had not archived their content for the entire time period and, based on looking at the volume of articles over the time period, we only have more recent articles for these sites.14 In total, we have 62,826 articles scraped across 86 news sources.
Translation
We used Google Translate to translate news stories that were written in the Spanish language into English for eight news outlets: Impacto, Al Día, El Sol Latino, Kensington Voice, Pennsylvania Capital-Star, Telemundo 62 WWSI, Univision 65 WUVP, and WFMZ-TV 69 News. For validation, a Spanish native speaker manually reviewed a random subset of ten articles to see whether the stories translated by Google Translate would work for our purposes. The results of this analysis suggested that although Google Translate had errors in terms of the words chosen and the grammar of the sentence, it was able to translate words that conveyed the main topics of the articles, which is what we needed for our purposes. We decided to apply Google Translate for the news outlets that reported stories in Spanish because we did not have evidence that it changed the main topic(s) of the news articles.
We identified 14 other non-English articles: eight Chinese stories in Metro Chinese Weekly and four Russian and two German articles in Philadelphia Weekly. These were not included in the analysis.
Issues Mentioned
To analyze issue coverage in Philadelphia, we took two steps. First, we looked at which issues were mentioned by Philadelphians in response to the survey. The responses had been placed into categories by SSRS and validated by the Center for Media Engagement. We used these data to examine the media articles. First, we pre-processed the survey responses by removing stopwords, lowering cases, and lemmatizing.
We extracted words/phrases that were mentioned more than twice across the respondents. Although the issues of parking, limited parking available, and illegally parked cars were originally separated from traffic concerns, accidents, and violations, we combined them given the difficulty in parsing them. We combined these issues in the survey data and the media content data.
To identify words related to the issues, a language model was created using the CBOW (continuous bag of words) word embedding technique with uni- and bigrams in the news articles after the articles were processed in the same way as the survey responses. Words and phrases that had similarity scores exceeding 0.7 in the language model were collected for a manual review (n = 11,487). This revealed 2,213 words and phrases related to the 26 issues from the survey respondents.
We then did a second round. Using the 2,213 words and phrases, we used the same CBOW model to create another dataset of up to two similar words and phrases for each of the 2,213 words that had similarity scores higher than 0.7. We also chose the two most similar words among the 2,213 words and phrases identified in the first round. This procedure identified 1 to 4 similar words and phrases for each word or phrase used by two or more survey respondents to identify issues facing their neighborhoods.
We manually reviewed the words for whether they seemed related to the issues. After achieving reliability between coders (Krippendorff’s alpha = 0.86) and manually reviewing 5,475 additional words and phrases, 972 words/phrases for 26 issues were identified.
For these 972 words, we randomly selected 10 sentences containing the words from the media coverage. Workers on Amazon’s Mechanical Turk, an online service that allows requesters to pay people for doing small tasks, who passed a qualification task15 were asked to evaluate whether the words were related to the overarching issues. They were told:
Below, you will be asked to read five sentences and evaluate whether certain words in the sentence are related to a specific topic. For example, in the sentence “President Biden signed an executive order today,” the word “president” is used in a way that is related to the topic of politics and government. However, in the sentence “The company’s president announced his retirement today,” the word “president” is not related to politics and government.
Each word / sentence combination was rated by two mTurk workers. Words that were judged to be about the issue in at least 80% of the cases were included in the dictionaries. After manually reviewing the results, we determined that we had insufficient indicators for four topics: (1) property neglect, lack of maintenance, upkeep, (2) noise pollution, loud vehicles, neighbors, fireworks, (3) pest control, animal control, welfare, and (4) youth services, programs, curfew.
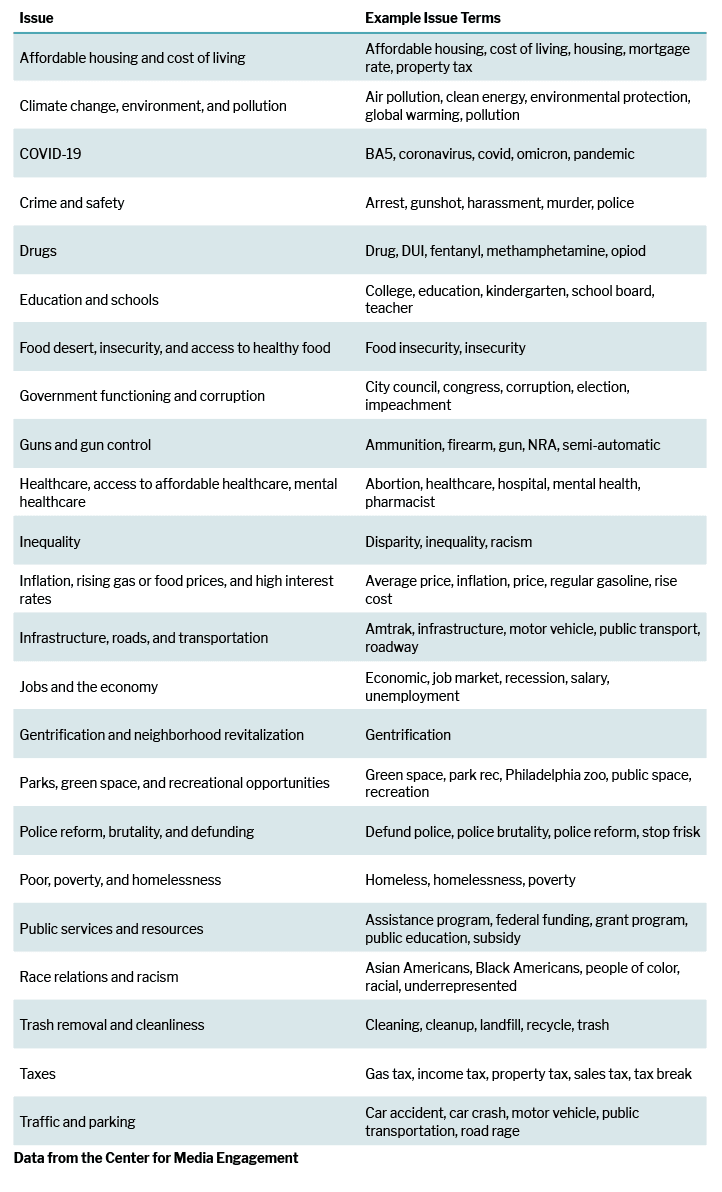
Below are example terms for each issue. We determined the issues included in each article by examining whether any of the issue-related terms appear in the articles. Each article could mention multiple issues.
Location Identification
We used the spaCy entity recognizer to identify location words and phrases in Philadelphia local media by examining named entities including ‘FAC’ (buildings, airports, highways, bridges, etc.), ‘GPE’ (countries, cities, states), and ‘LOC’ (non-GPE locations, mountain ranges, bodies of water). To validate, we pulled 200 random articles that contained place entities from the named entity recognizer (947 place items retrieved) and manually reviewed if the item was correctly identified as a place by spaCy and if any place words in the articles were not retrieved from the recognizer. The metrics achieved good performance of precision (0.85) and recall (0.95). Then we collected the place/location named entities that appeared in all news articles more than five times (n = 5,060).
Using the Google Maps API, we gathered geolocation information (e.g., longitudes and latitudes) and addresses on Maps of the identified entities. Then we selected places that contained the word ‘Philadelphia’ in the addresses (n = 566) and manually reviewed them to see if they were located in the Philadelphia area. In this process, we identified the zip codes of the addresses and matched those zip codes with seven Philadelphia regions. We excluded several streets that overlap across two Philadelphia regions (n = 27) due to their ambiguity. In total, we collected 426 location entities in Philadelphia and identified those place names on the news articles. Media outlets with more than 20 articles that mentioned the identified place entities were selected for mapping.
- We originally proposed that West and Southwest Philly would be combined and that Upper and Lower Northeast Philly would be combined. At a series of community meetings, Philadelphia residents reported that these regions are meaningfully different (and, based on the data, they were right). In order to maintain the overall sample size, we sub-divided these regions.[↩][↩]
- On average, respondents named 2.9 issues. There was some variation by region in how many issues respondents named, from an average of 2.4 issues in Upper Northeast Philly to an average of 3.2 issues in Southwest Philly. The survey firm SSRS recorded the verbatim responses and then categorized them using the categories described in the main text. To check the coding, we randomly sampled 100 responses and coded them, finding substantial agreement (97% of cases). Upon review of the cases where there was disagreement, there was a clear rationale for the survey firm’s coding in all of them. 15.5% of responses were categorized as “other” and not included in any of the substantive categories. We reviewed these cases and did not see a large percentage of cases that warranted a separate category. Other categories garnering fewer than 3% of respondents and having too few cases to look for differences across the regions in Philadelphia included: (1) climate change / environment / pollution, (2) COVID-19, (3) entertainment and nightlife / restaurants, (4) food desert / insecurity / access to healthy food, (5) health care / access to affordable healthcare / mental healthcare, (6) inequality, (7) pest control / animal control welfare, and (8) race relations / racism.[↩]
- We used logistic regression and controlled for the region where people lived.[↩]
- After controlling for the other factors, there is limited evidence that the region where one lived affects the probability of naming infrastructure, roads, and transportation. [↩]
- This relationship has been identified in prior analyses of Philadelphia, see Romer, Daniel, Kathleen Hall Jamieson, and Sean Aday. “Television news and the cultivation of fear of crime.” Journal of Communication 53, no. 1 (2003): 88-104.[↩]
- The following issues were mentioned as important by fewer than 10% of residents and were mentioned in fewer than 10% of news articles: climate change, environment, and pollution; equality; food desert, insecurity, and access to healthy food; neighborhood revitalization and gentrification; parks, green space, and recreational opportunities; police reform, brutality, and defunding; public services and resources; race relations and racism; and taxes. We had insufficient media indicators for four topics: (1) property neglect, lack of maintenance, upkeep, (2) noise pollution, loud vehicles, neighbors, fireworks, (3) pest control, animal control, welfare, and (4) youth services, programs, curfew, all of which were mentioned by fewer than 10% of residents.[↩]
- The remaining outlets that we asked about were checked by fewer than 5% of respondents, including: Al Día, Catholic Philly, Chalkbeat Philadelphia, Chestnut Hill Local, Dos Puntos, El Sol Latino, Generocity, Germantown Info Hub, Jewish Exponent, Juniata News, Kensington Voice, Metro Chinese Weekly, Philadelphia Gay News, Philadelphia Public Record, Philadelphia Sunday Sun, Philadelphia’s AM 990 The Answer (WNTP), Philatinos Radio, PhillyCAM, Scoop USA, Southwest Globe Times, Technical.ly Philly, University City Review, and WURD. Five percent of people nominated a source other than those listed; a review of these responses did not reveal a source nominated by more than a few people.[↩]
- Respondents who checked more than three sources were asked to indicate their top three.[↩]
- Only those sources with 50 or more weighted data points are shown. We examined differences by region, but there were few meaningful differences and many regions where the sample size was notably small.[↩]
- The survey firm recorded the words and then categorized them into positive, negative, or neutral categories. To check the coding, we randomly sampled 100 responses and coded them, finding substantial agreement (87% of cases). Upon review of the cases where there was disagreement, there was a clear rationale for the survey firm’s coding in all of them.[↩]
- Only 1% of respondents identified as a gender other than male or female, yielding insufficient sample size for analysis.[↩]
- For Center City, we included 19102, 19103, 19106, and 19107 (n = 114) and for South Philly, we included 19145, 19146, 19147, and 19148 (n = 198).[↩]
- Eleven sites were included but had no articles available for scraping during the time period of our analysis: ¡Presente! Media, Dos Puntos, Drink Philly, Generocity, Juniata News, Kouvenda Media, The La Salle Collegian, The Vanguard, University City Review, WKDU and WQHS. We did not analyze data from three additional sites: the Associated Press, Broke in Philly, and Philadelphia Public Record because, respectively, the website content did not archive for the full time period and we assumed that most people accessed this content via local news sites reprinting AP articles, the article links redirected to other news sites, and the website was inaccessible at the time of data collection. [↩]
- Based on looking at the number of articles archived per day throughout the study period, we believe that this was the case for 1210 WPHT, Philadelphia Tribune, PhillyBite Magazine, The Times Herald, WRNB 100.3 RNB Philly, 97.5 The Fanatic and CBS Philadelphia.[↩]
- The qualification task asked workers to rate clear examples of words/phrases that were, and were not, indicative of particular issues. Anyone not rating all of the words correctly was not given the qualification. [↩]