


Online comment sections provide a space for the public to interact with news, to express their opinions, and to learn about others’ views. To date, little is known about the populations that inhabit online comment sections. Who comments online and why? Who reads online comments? And what does the public think about best practices for this space? In this report, we use a nationally representative sample of commenters and comment readers to describe the demographic makeup, attitudes, and behaviors of the people who comprise the online commenting world.
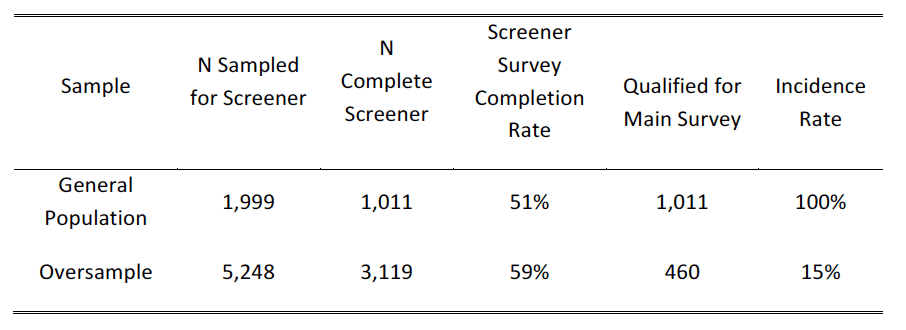
Data were gathered from a representative probability sample of Americans by The GfK Group (formerly Knowledge Networks). In total, we have complete data from 1,471 respondents. We first obtained data from 1,011 randomly sampled Americans, including 140 news commenters. We then sampled an additional 460 news commenters. To identify the additional 460 news commenters, we surveyed 3,119 people about their commenting behavior.
Throughout this report, we include data drawn from 600 news commenters, 506 people who have not commented on news or read news comments, and 365 people who read news comments but have not themselves left a comment. The corresponding margins of error are +/- 4% for news commenters, +/- 4% for those who neither comment nor read news comments and +/- 5% for news readers. Additional details about the methodology can be found at the close of this report.
Key Findings
- 55.0% of Americans have left an online comment and 77.9% have read the comments at some point.
- Of those who have left a comment, 77.9% have done so via social media.
- Just over half (50.7%) of Americans do not read news comments or leave comments on news sites.
- Of those who leave news comments, 53.2% said they comment on news monthly or less frequently, and of those who read comments, 59.0% said that they do so a few times a month or less.
- Americans who leave news comments, who read news comments, and who do neither are demographically distinct. News commenters are more male, have lower levels of education, and have lower incomes compared to those who read news comments.
- Local newspapers’ and television stations’ sites, apps, and social media pages are popular news destinations for both leaving and reading comments.
- News commenters and comment readers most commonly name United States politics or domestic policy as the type of story on which they comment or read comments.
- 56.0% of those who comment on news say they do so to express an opinion or emotion, particularly when the topic is United States politics or domestic policy.
- 33.9% of news commenters and 40.9% of news comment readers name argumentative comments as the reason that they avoid commenting or reading comments.
- 66.6% of commenters and comment readers agree that allowing anonymity in comment sections allows participants to express ideas they might be afraid to express otherwise, while 47.9% agree that allowing commenters to remain anonymous raises the level of disrespect.
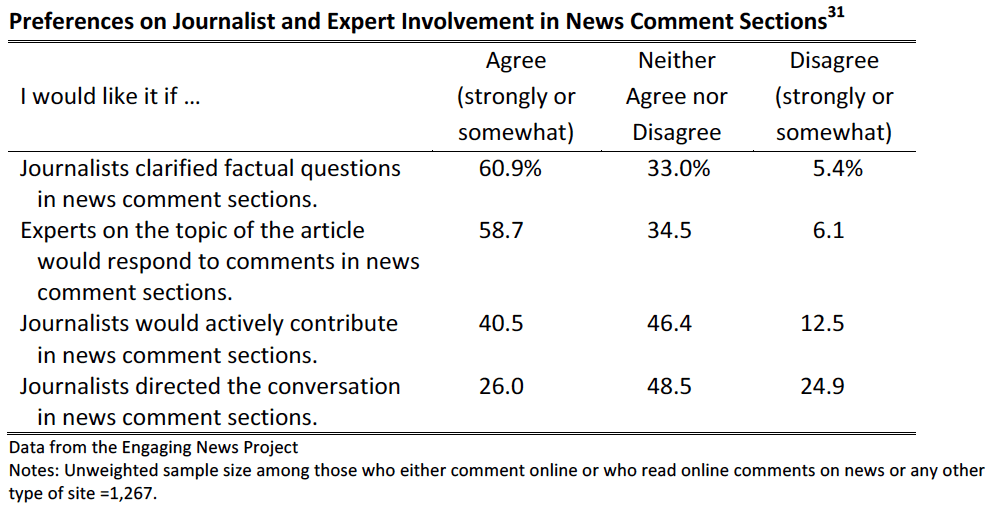
- 60.9% of commenters or comment readers would like it if journalists clarified factual questions in news comment sections. Similarly, 58.7% would like it if experts on the topic of the article responded to comments in news comment sections.
Implications for Newsrooms
The results of this survey provide an extensive portrait of online news commenting in the contemporary United States media landscape. Although a majority of the American adult population leaves comments, only a small percentage – 14% – comment on the news. Those commenting on the news and reading news comments differ on several key demographics but are similar in terms of the news comment sections to which they gravitate. Argumentative comments turn people away from these online spaces, but the public is divided on whether newsrooms should remove offensive comments or avoid policing commenters. Survey respondents provide some guidance to newsrooms interested in innovating in the commenting space. Over 60%, for instance, want journalists to answer factual questions in the comment section. The use of nationally representative data allows us to generalize to the broader population. By studying motivations, attitudes, demographics, and behaviors, this report provides a comprehensive analysis of news commenters, comment readers, and those who do neither.
The Study
Majority Have Left An Online Comment
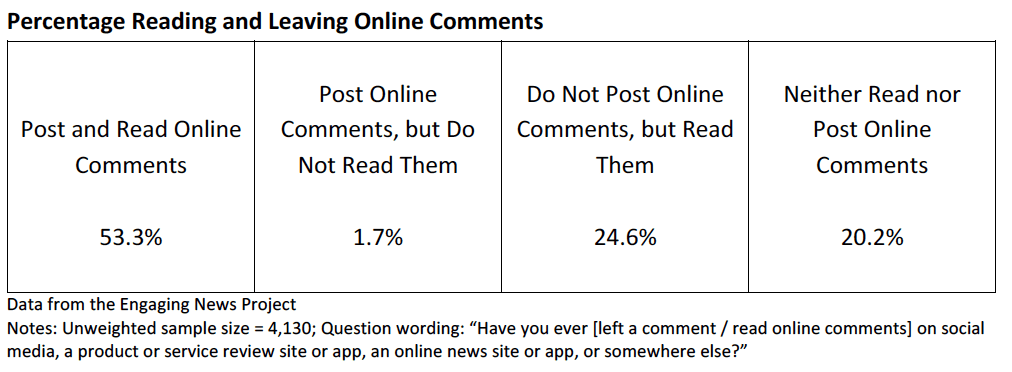
Comments exist in many different digital spaces, including social media and sites/apps about products, services, news, and entertainment. Across all of these spaces, 55.0% of Americans have left an online comment and 77.9% have read the comments at some point. As the chart below shows, just over half (53.3%) do both and two in ten (20.2%) neither read nor post online comments. A quarter (24.6%) read online comments, but do not comment. Few (1.7%) leave comments, but do not read them.
Social Media Most Common Place to Comment and Read Comments
Reading comments and commenting are more common on social media sites than on news sites. Of those who post comments, most do so via social media (77.9%) or on a product or service review site/app (52.8%). Similarly, those who read but do not post comments tend to read the comments on social media (69.9%) and on product and review sites/apps (62.2%).

Of those who comment on social media sites, nearly a quarter (24.7%) have done so on a news organization’s social media page.1 Of the overall population, 10.6% have left a comment on a news organization’s social media page.
Of those who read comments on social media but do not comment on news, 42.6% read comments on news organizations’ social media sites.2 Of the overall population, 19.2% read comments on a news organization’s social media page, but do not themselves leave news comments.
Half Neither Read News Comments Nor Comment On Online News
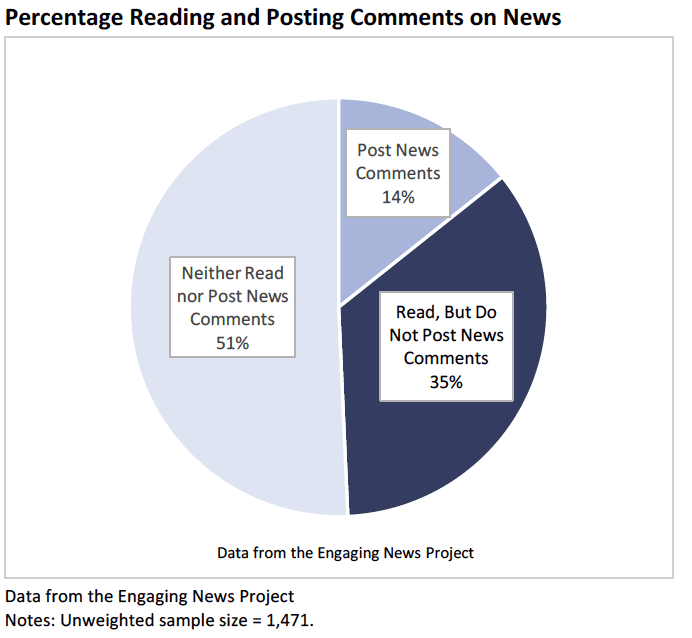
A comprehensive look at news commenting reveals that the majority neither read news comments nor leave comments on news sites (50.7%). The chart below shows that 35.0% read news comments but do not comment. Fourteen percent have commented on the news.
News Commenting, Reading News Comments Occur Infrequently
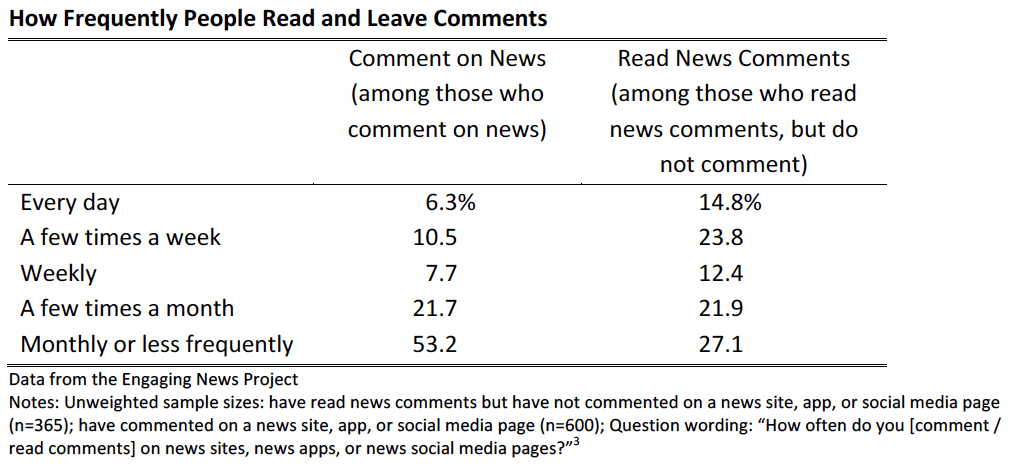
A majority of those who said they had left a news comment at some point did so infrequently – 53.2% said they commented on news monthly or less frequently. Among those identifying that they read news comments, 59.0% did so a few times a month or less.3
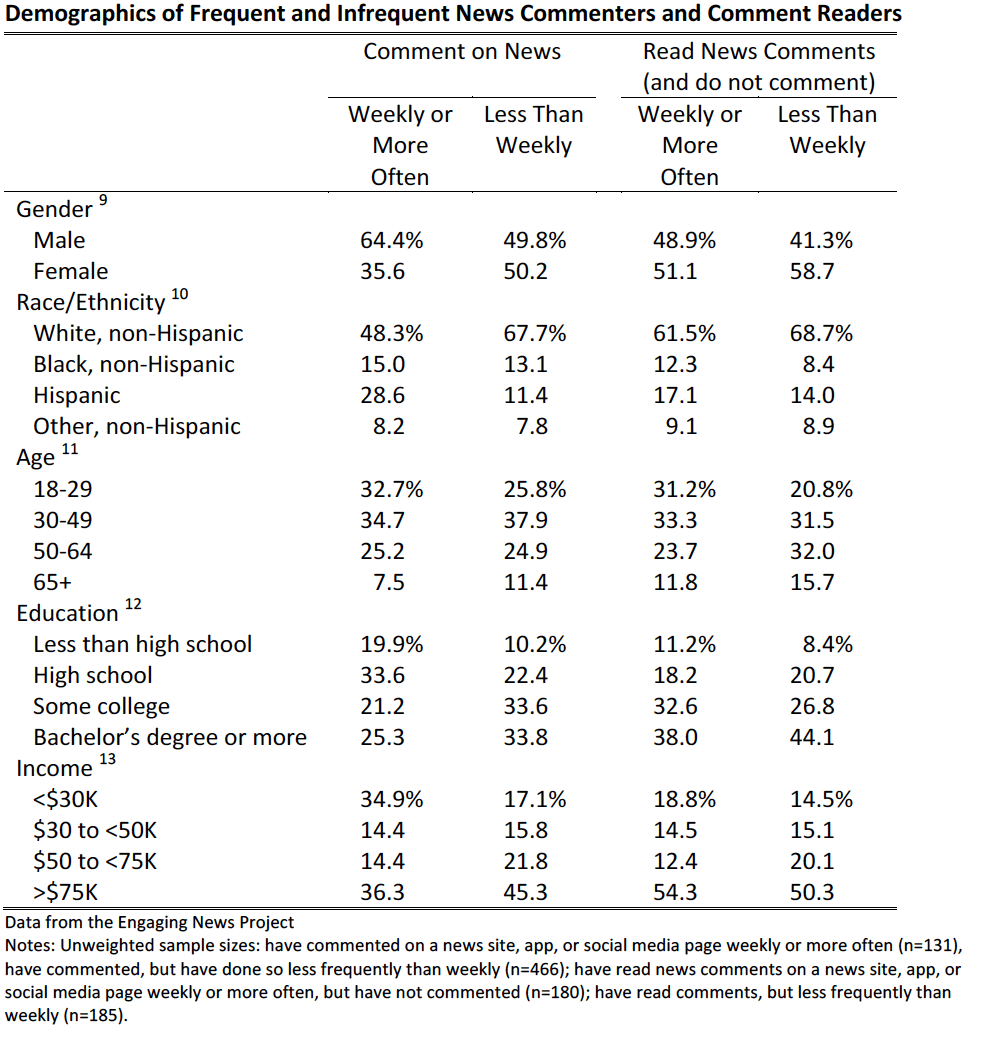
Those Who Comment on the News and Those Who Read News Comments Differ on Key Demographics
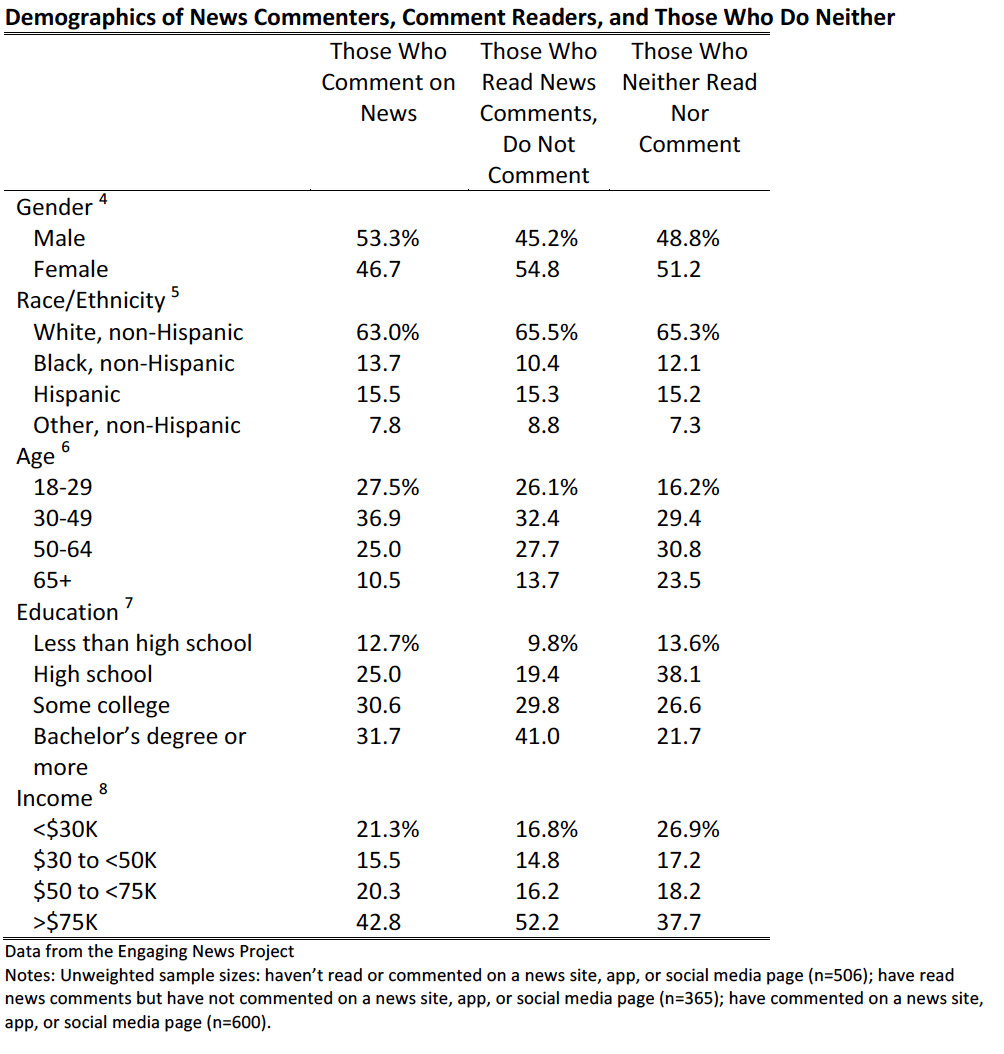
News commenters and readers are younger and more educated than those who neither comment on the news nor read news comments.
Those leaving comments on the news tend to be more male, have lower levels of education, and have lower incomes compared to those who read news comments, but do not comment.4,5,6,7,8
We also compared those who comment on news weekly or more frequently to those who comment less frequently. Those commenting more frequently are more male, have lower levels of education, and have lower incomes. They also are less White and more Hispanic.
There are few demographic differences between those who read the comments more or less frequently. The one exception is that those who read news comments weekly or more frequently but do not comment tend to be younger than those reading news comments less often.9,10,11,12,13
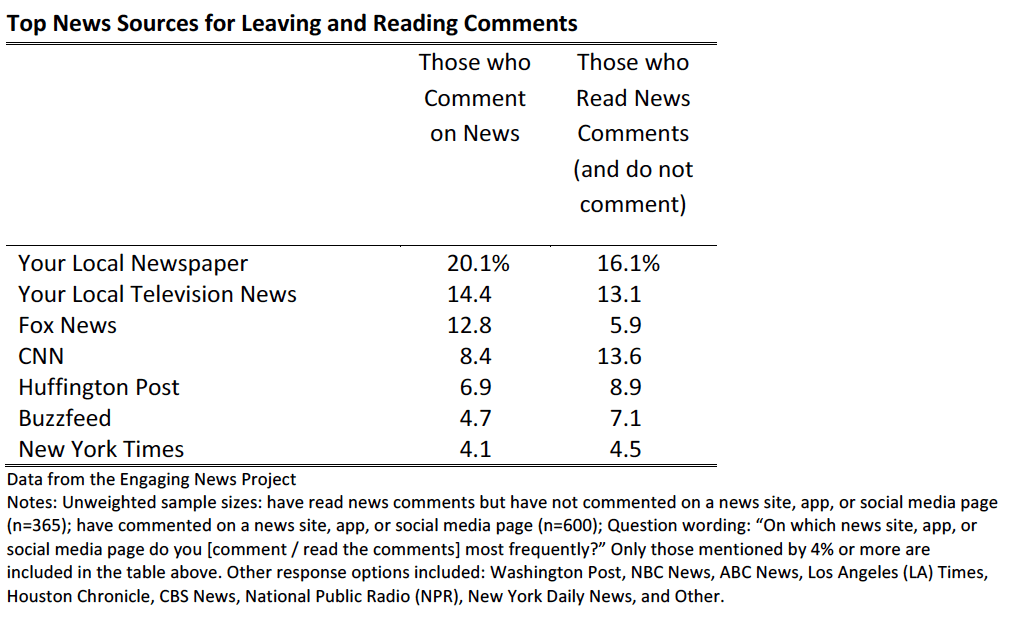
Local Sites and Large National Sites Attract Most News Commenters, Readers
Local newspapers’ and television stations’ sites, apps, and social media pages are the most popular news destinations for both leaving comments and reading comments. Readers and commenters select the same top seven news sites, apps, or social media pages.
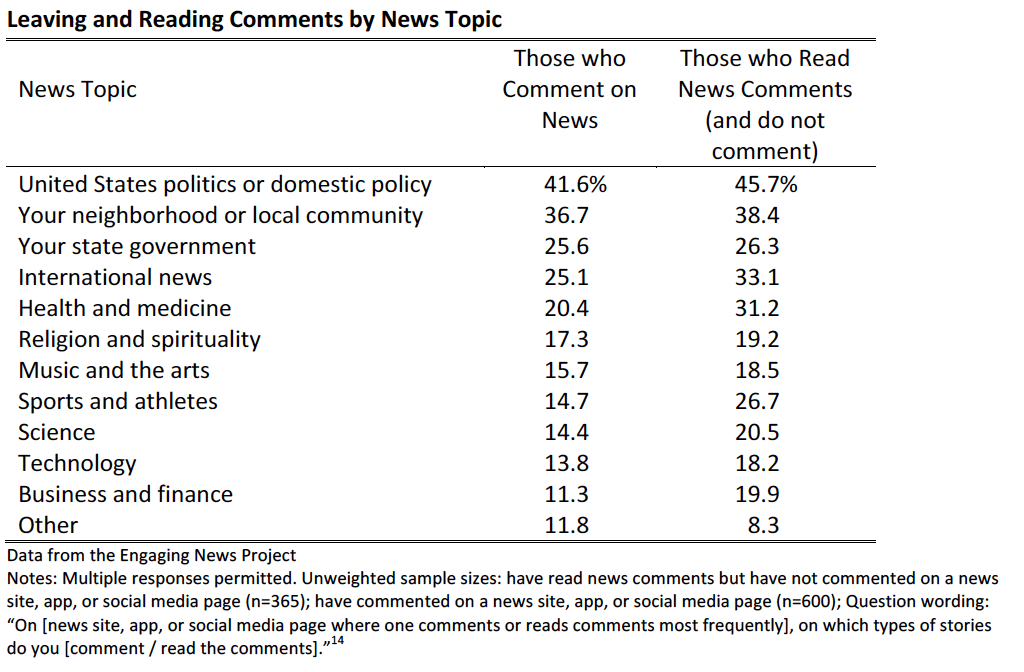
Politics and Public Affairs Stories Most Common for Commenting, Reading Comments
News readers and commenters also choose the same top five types of stories for reading and commenting: United States politics or domestic policy, neighborhood or local community, state government, international news, and health and medicine. United States politics or domestic policy tops both lists.14
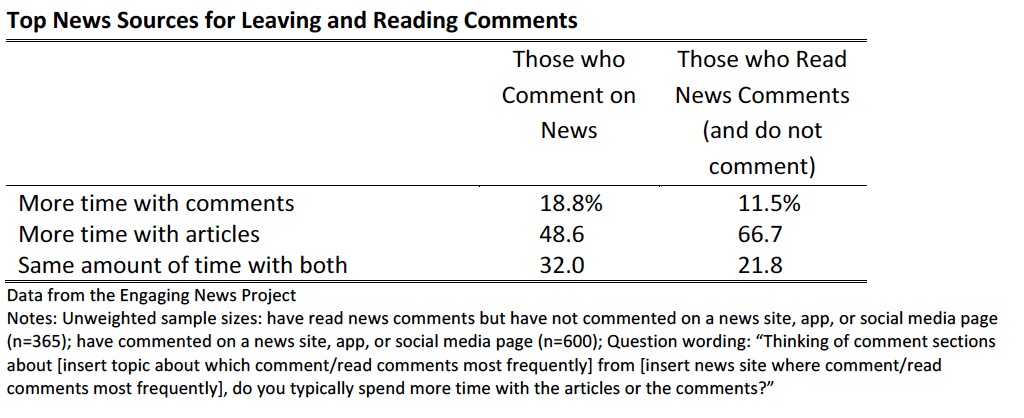
Less Than 20 Percent Spend More Time with Comments than Articles
Nearly half of commenters (48.6%) and two-thirds of those who read comments but do not leave them (66.7%) identified that they spend more time with articles than they do with the comments.
Majority Leave Comments to Express an Opinion or Emotions, Particularly When the Topics is U.S. Politics
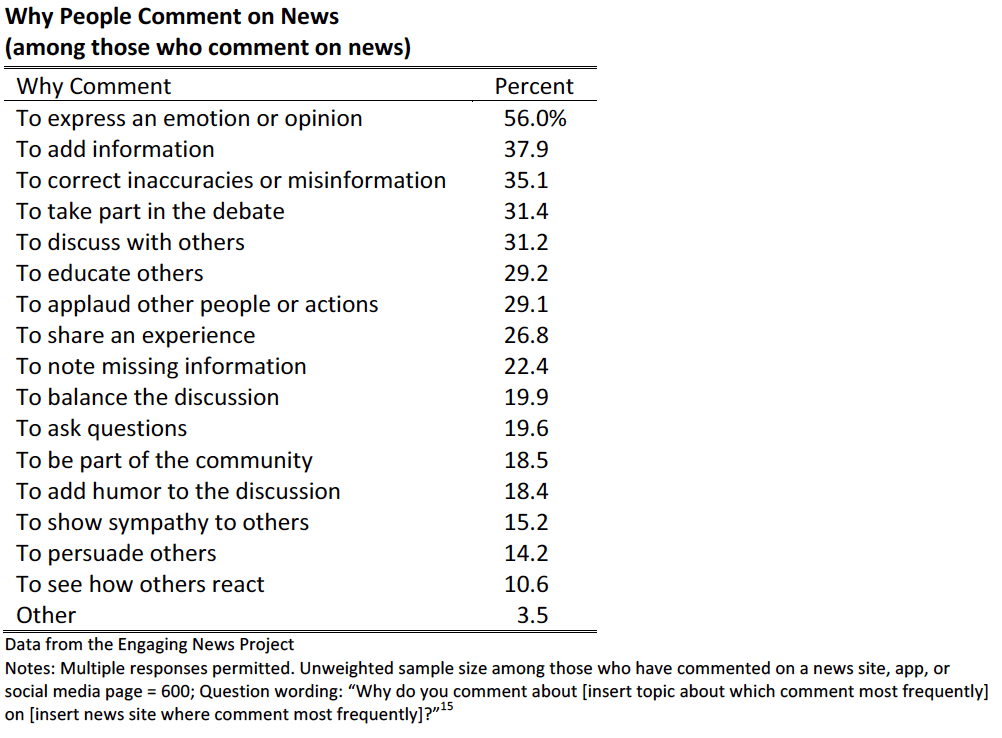
Those who leave comments do so for many reasons, but the top reason is to express an emotion or an opinion.15
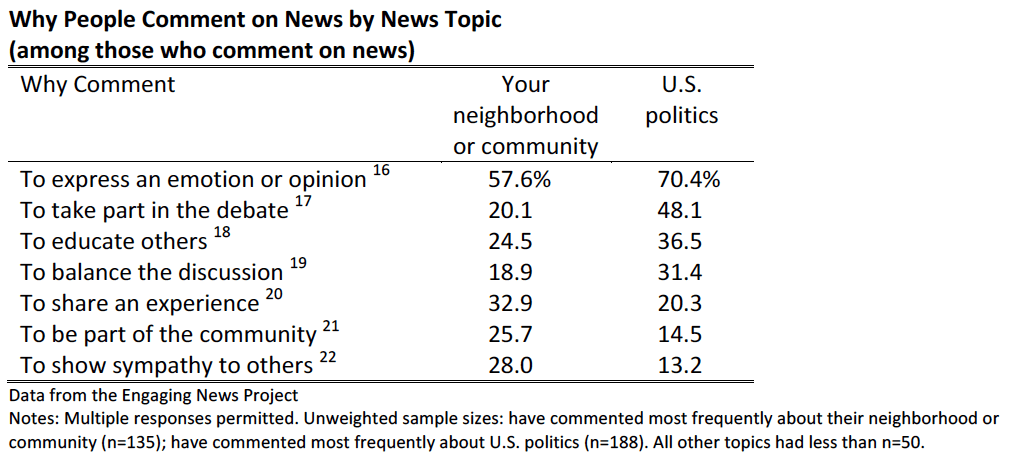
There are some differences based on the topic about which people comment most frequently. Due to sample size considerations, we only compared people who comment most frequently about their neighborhood or community to those who comment most frequently about U.S. politics.
Those who comment most on U.S. politics do so to express an emotion or opinion, to take part in the debate, to educate others, and to balance the discussion more than those who comment most on their neighborhood or community.
Those who comment most frequently on news about their neighborhood or community are more likely to comment to share an experience, be part of the community, or show sympathy to others compared to those who comment most on U.S. politics.16,17,18,19,20,21,22
People Read Comments to Learn About – And Be Entertained By – Others
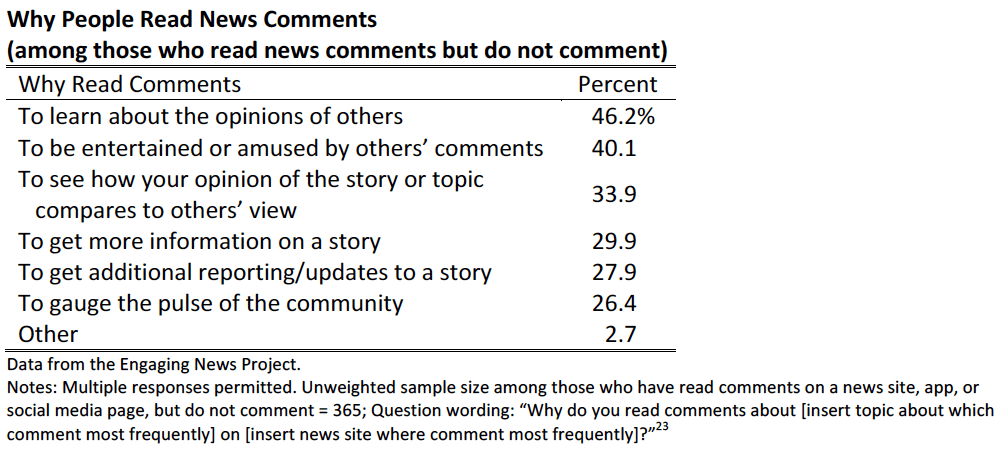
Those who read comments, but do not themselves comment, have various motivations for doing so. They most often read comments to learn about the opinions of others and to be entertained or amused by others’ comments.23
We compared people who read comments about their neighborhood or community most frequently to those who read comments about U.S. politics most frequently. There were few differences in why people read comments. The sole exception is that those who read comments about their neighborhood or community were more likely to do so to get additional reporting and updates to a story (37.0%) than those reading comments on U.S. politics (19.5%).24
Some Purposefully Avoid Comments, Particularly About Religion and Politics
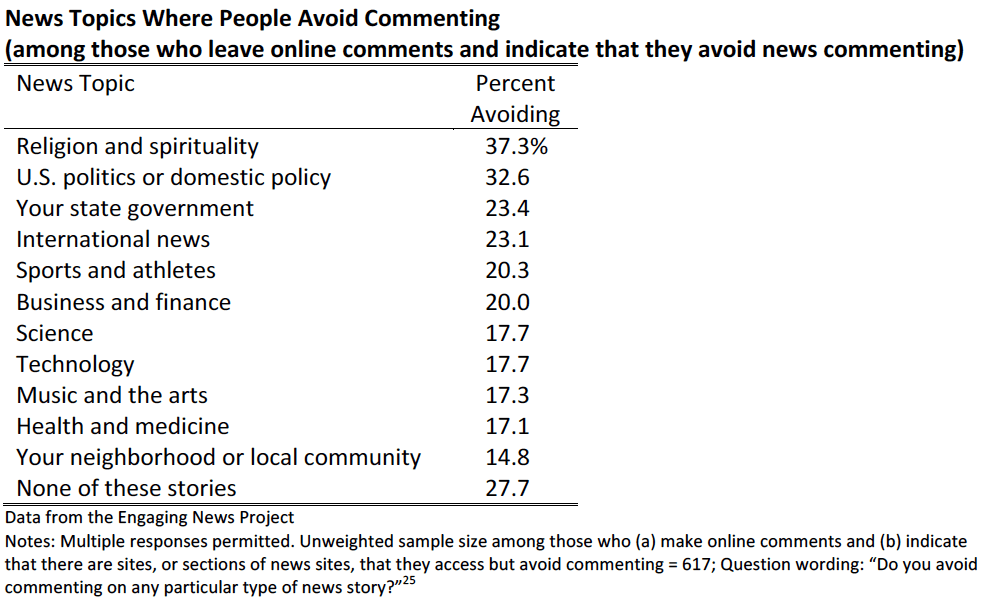
Of people who leave comments online – whether on a news site or somewhere else – 59.2% said that there are news sites, or sections of news sites, that they access but avoid commenting.
Commenters avoid commenting on particular topics more than others. Around a third of those who avoid commenting do so on stories about religion and spirituality (37.3%) and on stories about U.S. politics or domestic policy (32.6%). Online commenters are least likely to avoid commenting on stories about their neighborhoods or local communities (14.8%).25
Of people who read comments but do not themselves comment online, 29.7% said that there are news sites, or sections of news sites, that they access but avoid commenting.
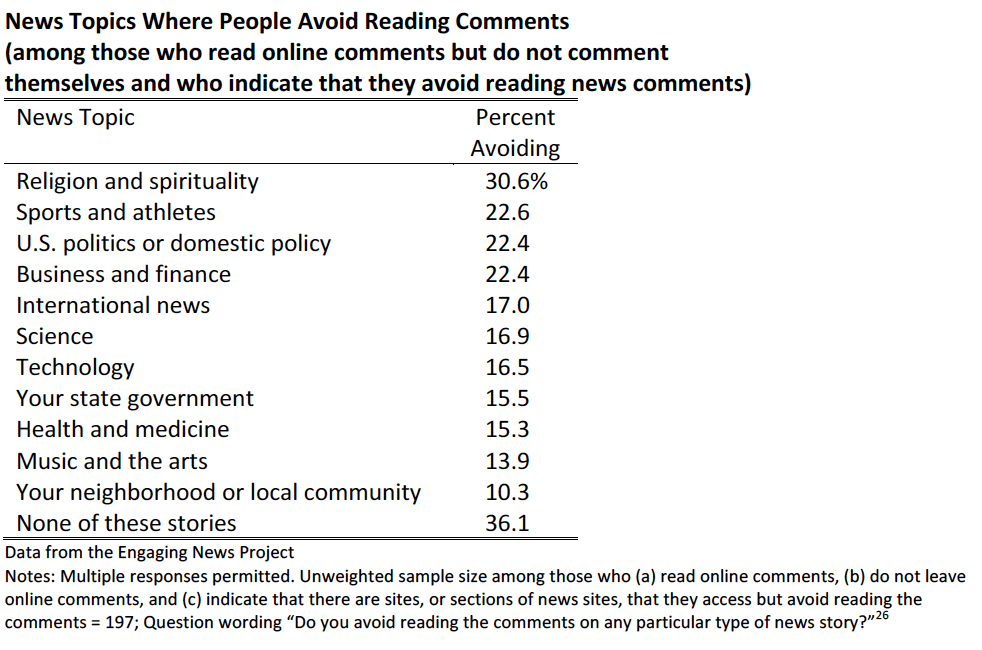
Avoiding comment reading also varies by topic. The largest percentage of people avoid reading comments on religion and spirituality (30.6%). Other topics where just under a fourth of respondents avoid reading comments include sports and athletes (22.6%), U.S. politics or domestic policy (22.4%) and business and finance (22.4%). Respondents were least likely to avoid reading comments about their neighborhood or local community (10.3%).25
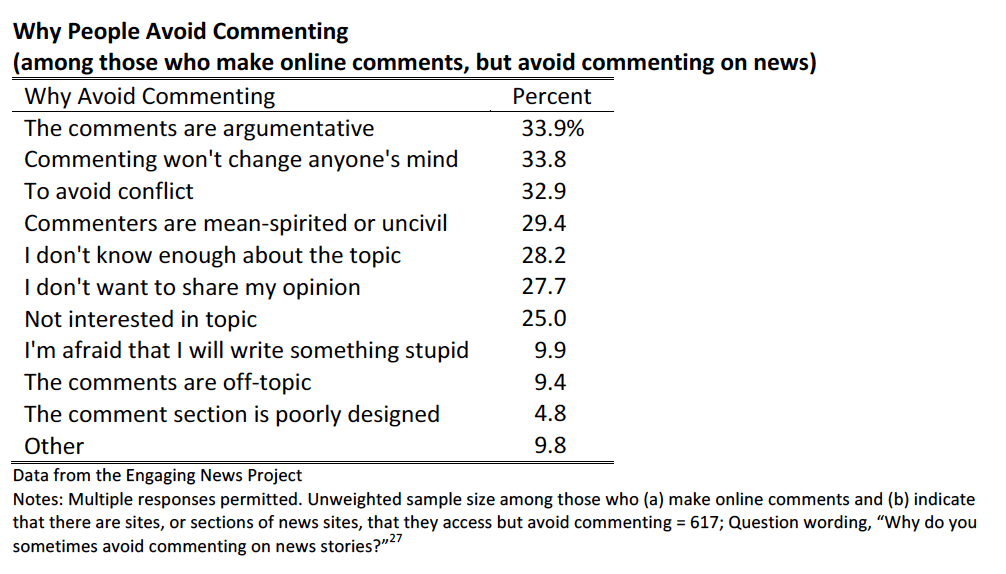
Argumentative Comments Tops the List of Reasons that People Avoid Comments
There was wide variability in why people said that they avoid commenting. Several of the top reasons were about avoiding negativity – comments are argumentative (33.9%), to avoid conflict (32.9%), and commenters are uncivil (29.4%). Other common reasons include the belief that commenting won’t change anyone’s mind (33.8%), not knowing enough about the topic (28.2%), and not wanting to share an opinion (27.7%). The design of the comment section was least likely to lead people to avoid commenting (4.8%).23
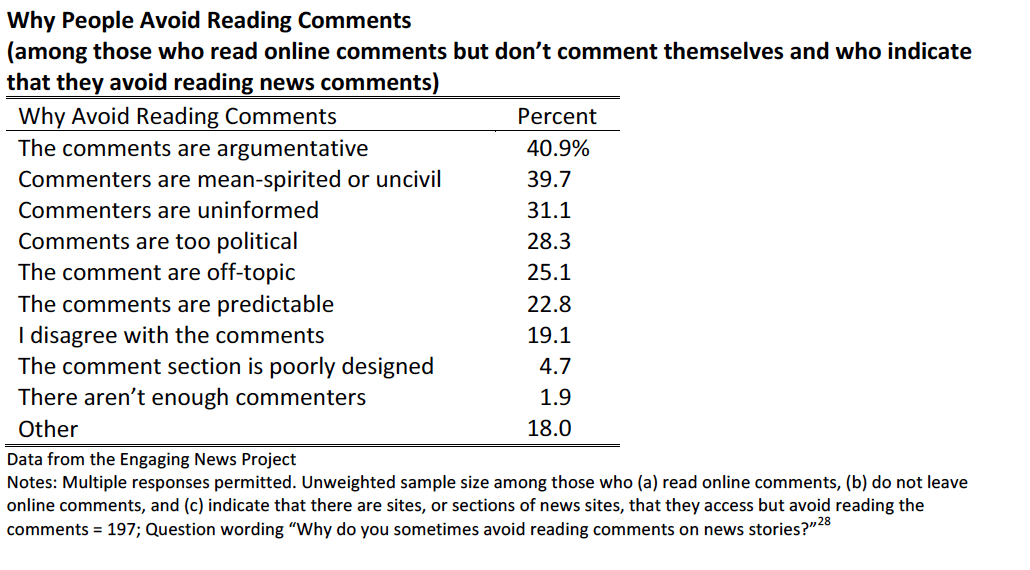
Similar reasons explain why people avoid reading comments. Argumentative comments (40.9%) and mean-spirited or uncivil commenters (39.7%) topped the list for why people avoid reading comments. The design of the comment section (4.7%) and the absence of other commenters (1.9%) were least likely to explain why people avoid reading comments.26
Beliefs About the Consequences of Anonymity are Mixed
Two-thirds think that anonymity allows people to express views that they wouldn’t otherwise, and 58.5% believe that forcing people to use their real names puts people at risk. At the same time, nearly half (47.9%) think that anonymity raises the level of disrespect.
Forty-four percent thought that anonymity promotes livelier, more passionate discussion compared to 18.6% who disagreed. When it came to whether requiring real names created better discussion, nearly half neither agreed nor disagreed (44.8%). Others were divided. About a quarter agreed (26.2%) and just over a quarter disagreed (28.2%) that requiring real names created better conversation.27

For some, commenting behavior is affected by whether a real name is required. Among those who comment online, a third (33.7%) agreed with the statement “I do not comment in online comments sections if I have to use my real name.” Forty percent neither agreed nor disagreed and the remaining 25.4% disagreed.28
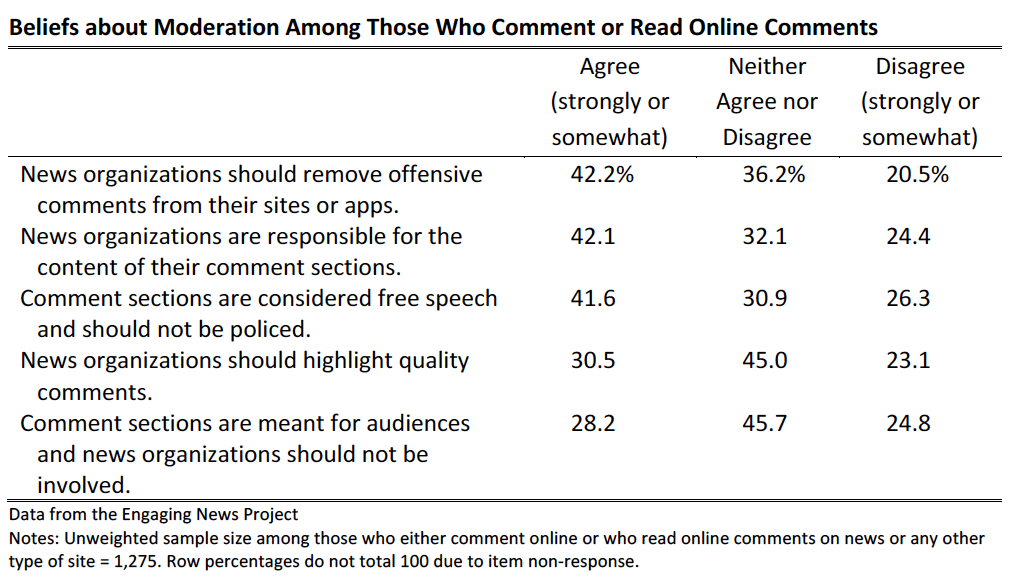
Public Has Complex Views on Moderating Comment Sections
Although over four in ten believe that news organizations should remove offensive comments (42.2%) and that news organizations are responsible for the content of their comment sections (42.1%), a similar percentage also endorsed the view that comment sections are considered free speech and should not be policed (41.6%).
Near majorities neither agreed nor disagreed about whether news organizations should highlight quality comments (45.0%) or should not be involved in comment sections (45.7%). A slightly higher percentage (30.5%) thought that news organizations should highlight quality comments than thought they should not (23.1%). Nearly equal percentages agreed (28.2%) and disagreed (24.8%) that comment sections are meant for audiences and news organizations should not be involved.
Majority Would Like Experts to Weigh In and Journalists to Answer Factual Questions in News Comment Sections
Those who post or read online comments endorsed having journalists involved in the comment section, but only in particular ways. About six in ten wanted journalists to clarify factual questions in news comment sections (60.9%). There was less agreement with having journalists actively contribute (40.5%), and even less with having journalists direct the conversation (26.0%).
Having experts respond to comments was another popular idea, yielding agreement from 58.7% of those reading or leaving online comments.29
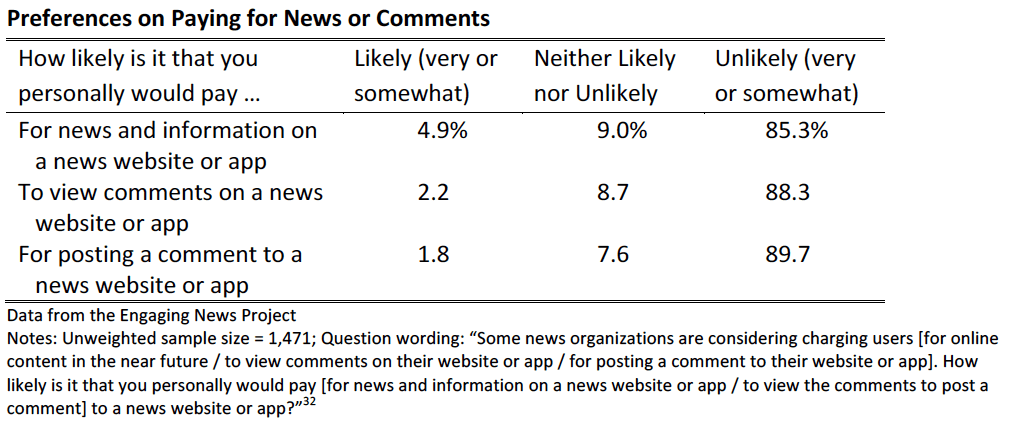
Large Majorities Unlikely to Pay for News or Comments
A fourth (25.8%) currently subscribe to a news publication, whether print or digital. Overwhelming majorities identified that they are unlikely to pay for news or comments.30
Methodology
Data for this survey were gathered between November 12 and December 2, 2015 by The GfK Group (formerly Knowledge Networks). GfK sampled households from its KnowledgePanel, a probability-based web panel designed to be representative of the United States. For this survey, all respondents had to be 18 years of age or older to qualify. All interviews were conducted in English. In order to get an adequate number of news commenters, we oversampled those who had commented on a news site, app, or social media page. In total, 4,130 respondents completed the survey screener, 1,011 participated in the main sample (18 years of age or older) and 460 additional panelists were recruited for the oversample of news commenters.
GfK Methodology
GfK has recruited an online research panel that is representative of the United States population. Panel members are randomly recruited through probability-based sampling, and households are provided with access to the Internet and hardware if needed.
GfK recruits panel members by using address-based sampling methods. The GfK recruitment protocol relies on probability-based sampling of addresses from the United States Postal Service’s Delivery Sequence File (DSF). The key advantage of the ABS methodology is that it allows sampling of almost all United States households. Regardless of household telephone status, all households can be reached and contacted through postal mail.
Randomly sampled addresses from the DSF are invited to join KnowledgePanel through a series of mailings, including an initial invitation letter, a reminder postcard, and a subsequent follow- up letter. Given that approximately 45% of the physical addresses can be matched to a corresponding landline telephone number, about 5 weeks after the initial mailing, telephone refusal-conversion calls are made to households for whom a telephone number was matched to the sampled address. Invited households can join the panel by:
- Completing and mailing back a paper form in a postage-paid envelope
- Calling a toll-free hotline phone number maintained by GfK
- Going to a designated GfK website and completing the recruitment form at the website
Once panel members are recruited and profiled, they become eligible for selection for client surveys. In most cases, the specific survey sample represents an equal probability selection method (EPSEM) sample from the panel for general population surveys.
Once assigned to a survey, members receive a notification email letting them know there is a new survey available for them to take. This email notification contains a link that sends them to the survey questionnaire. No login name or password is required.
After three days, automatic email reminders are sent to all non-responding panel members in the sample. If email reminders do not generate a sufficient response, an automated telephone reminder call can be initiated. The usual protocol is to wait at least three to four days after the email reminder before calling. To assist panel members with their survey taking, each individual has a personalized “home page” that lists all the surveys that were assigned to that member and have yet to be completed.
GfK also operates an ongoing modest incentive program to encourage participation and create member loyalty. Members can enter special raffles or can be entered into special sweepstakes with both cash rewards and other prizes to be won.
The typical survey commitment for panel members is one survey per week or four per month with duration of 10 to 15 minutes per survey.
Sample Weighting
The raw distribution of the KnowledgePanel (KP) mirrors that of the U.S. adults fairly closely, baring occasional disparities that may emerge for certain subgroups due to differential attrition rates among recruited panel members.
For selection of general population samples from KP, however, a patented methodology has been developed that ensures the resulting samples behave as EPSEM. Briefly, this methodology starts by weighting the entire KP to the benchmarks secured from the latest March supplement of the Current Population Survey (CPS) along several dimensions. This way, the weighted distribution of KP matches that of the U.S. adults – even with respect to the above mentioned few dimensions where minor misalignments may result from differential attrition rates.
For this study, the following benchmark distributions of 18+ U.S. adults from the March 2015 data from the CPS were used for the raking adjustment of weights:
- Gender (Male/Female)
- Age (18–29, 30–44, 45–59, and 60+)
- Race/Hispanic ethnicity (White/Non-Hispanic, Black/Non-Hispanic, Other/Non-Hispanic, 2+ Races/Non-Hispanic, Hispanic)
- Education (Less than High School, High School, Some College, Bachelor and beyond)
- Census Region (Northeast, Midwest, South, West)
- Household income (under $10k, $10K to <$25k, $25K to <$50k, $50K to <$75k, $75K to <$100k, $100K+)
- Home ownership status (Own, Rent/Other)
- Metropolitan Area (Yes, No)
- Internet Access (Yes, No)
RECOMMENDED CITATION:
Stroud, Natalie Jomini, Van Duyn, Emily, and Peacock, Cynthia. (2016, March). Survey of Commenters and Comment Readers. Center for Media Engagement. https://mediaengagement.org/research/survey-of-commenters-and-comment-readers/
- Among the 1,765 (unweighted) respondents who had commented on a social media site or app, such as Facebook, Instagram, or Twitter. [↩]
- Among the 455 (unweighted) respondents who had read comments on a social media site or app, such as Facebook, Instagram, or Twitter, but had not left a comment on a news site. [↩]
- Question wording draws on previous research from Diakopoulos, N., & Naaman, M. (2011, March). Towards quality discourse in online news comments. In Proceedings of the ACM 2011 Conference on Computer Supported Cooperative Work (pp. 133-142). ACM. [↩]
- There are significant differences by gender χ2(2, N = 1470) = 6.14, p < .05. Commenters are more likely than readers to be male. Those who neither read nor comment are not significantly different from either commenters or readers. [↩]
- There are no significant differences by race χ2(6, N = 1470) = 2.88, p = .82 [↩]
- Those who haven’t read or commented are older than those who have engaged in either behavior F(2, 1467)=28.23, p < .001. [↩]
- There are significant differences by education χ2(6, N = 1472) = 60.20, p < .001. Those who read comments are significantly more educated than those who comment. Those who comment are more educated than those who don’t comment or read comments. [↩]
- There are significant differences by income χ2(6, N = 1470) = 23.33, p < .001. Those who read comments are wealthier than those who comment and those who neither read nor comment. [↩]
- There is a significant difference by gender for those commenting on news χ2(2, N = 596) = 9.45, p < .01, but not for those reading news comments χ2(2, N = 365) = 2.12, p = .15. [↩]
- There is a significant difference by race/ethnicity for those commenting on news χ2(3, N = 596) = 27.95, p < .01, but not for those reading news comments χ2(3, N = 366) = 2.67, p = 0.44. [↩]
- There is not a significant difference by age for those commenting on news t(594) = 1.25, p = .21, but there is for those reading news comments t(363) = 2.37, p < .05. [↩]
- There is a significant differences by education for those commenting on the news χ2(3, N = 596) = 21.51, p < .01, but not for those reading news comments χ2(3, N = 366) = 2.93, p = .40. [↩]
- There is a significant difference by income for those commenting on the news χ2(3, N = 596) = 21.54, p < .01, but not for those reading news comments χ2(3, N = 365) = 4.69, p = .20. [↩]
- Question wording draws from previous research from The Pew Research Center’s Participatory News Consumer Study (2010). [↩]
- Question wording draws from previous research from Diakopoulos & Naaman; Springer, N., Engelmann, I., & Pfaffinger, C. (2015). User comments: Motives and inhibitors to write and read. Information, Communication & Society, 18(7), 798–815. [↩]
- The difference between those commenting most frequently on news about their neighborhood or community and those commenting most frequently on news about U.S. politics is significant, χ2(1, N = 303) = 5.40, p < .05. [↩]
- The difference between those commenting most frequently on news about their neighborhood or community and those commenting most frequently on news about U.S. politics is significant, χ2(1, N = 302) = 25.97, p < .01. [↩]
- The difference between those commenting most frequently on news about their neighborhood or community and those commenting most frequently on news about U.S. politics is significant, χ2(1, N = 302) = 5.09, p < .05. [↩]
- The difference between those commenting most frequently on news about their neighborhood or community and those commenting most frequently on news about U.S. politics is significant, χ2(1, N = 302) = 6.26, p < .05. [↩]
- The difference between those commenting most frequently on news about their neighborhood or community and those commenting most frequently on news about U.S. politics is significant, χ2(1, N = 301) = 6.17, p < .05. [↩]
- The difference between those commenting most frequently on news about their neighborhood or community and those commenting most frequently on news about U.S. politics is significant, χ2(1, N = 303) = 6.00, p < .05. [↩]
- The difference between those commenting most frequently on news about their neighborhood or community and those commenting most frequently on news about U.S. politics is significant, χ2(1, N = 302) = 10.18, p < .01. [↩]
- Question wording draws on previous research from Springer, Engelmann, & Pfaffinger [↩][↩]
- The difference between those reading comments on news about their neighborhood or community most frequently and those reading comments on news about U.S. politics most frequently is significant, χ2(1, N = 168) = 6.37, p < .05. Unweighted n = 79 read comments about their neighborhood or community most frequently (among those who do not comment); n = 91 read comments about U.S. politics most frequently (among those who do not comment). [↩]
- Question wording draws on previous research from The Pew Research Center’s Participatory News Consumer Study [↩][↩]
- Question wording draws on previous research from Diakopoulos & Naaman; Springer, Engelmann, & Pfaffinger [↩]
- Question wording draws on previous research from Rosenberry, J. (2011). Users support online anonymity despite increasing negativity. Newspaper Research Journal, 32(2), 6-19. [↩]
- Unweighted n = 1,025; strongly or somewhat agree compared to strongly or somewhat disagree. [↩]
- Question wording draws on previous research from Diakopoulos & Naaman [↩]
- Question wording draws on previous research from Chyi, H. I., & Lee, A. M., (2013). Online news consumption: A structural model linking preference, use, and paying intent. Digital Journalism, 1(2), 194-211. [↩]