Subscriptions are a critical part of many newsroom business models. Newsrooms are using a variety of strategies to find new subscribers, from advertising via email to using sponsored posts on social media. But what works and what doesn’t?
The purpose of this report is to provide data on several possible strategies. This research was funded by the American Press Institute and involved two steps. We first conducted in-depth interviews with staff from six news organizations with strong reputations for securing donations or subscriptions. Informed by these conversations, we then conducted experiments in collaboration with three U.S. newsrooms: one mid-sized local newspaper in the southwest, one small regional news magazine in the west, and one large local newspaper in the southwest.
In this report, we evaluate the influence of four factors on whether people click to learn more about subscribing to news: (1) the image accompanying a subscription offer, (2) the message describing the offer, (3) whether the offer is for a free newsletter or paid print/digital access, and (4) whether the subscription appeal appeared on Facebook or in an email.
Each newsroom tested these strategies via Facebook Sponsored Posts and either email or an advertisement in their newsletter. In total, we conducted 23 tests reaching 492,965 Facebook or email accounts between April 16 and May 15, 2018. For some of the Facebook tests, we used email lists provided by the newsroom (e.g. newsletter subscribers who had not subscribed to the print or digital product and former subscribers), and for others we targeted people who had visited the site recently or liked the newsroom’s Facebook page. Full details of the tests can be found at the end of this report.
For each test, we have data on the number of people reached and the number of people who clicked on a link. The results show that some strategies are more successful than are others. Overall, however, the findings illustrate how difficult it is to get people to subscribe and raise questions about the return on investment for paid subscription appeals.
Key Results
In summary, the results show:
- On Facebook, logos reduce click-through on subscription appeals relative to other images, such as journalists doing their work.
- When soliciting subscriptions via email, messages emphasizing what you’d lose without news frequently result in lower click-through rates compared to other strategies, such as telling people what they’d gain from a subscription or just giving them details about the subscription.
- Ads for free newsletter subscriptions garner more clicks than do ads for paid print/digital access.
- For the messages and images tested here, there is little evidence that Facebook ads alone yield an acceptable return on investment.
Implications for Newsrooms
In-depth interviews with those working to increase subscriptions identified visuals and the ladder of engagement as important. Our research aimed to put these observations to the test in three different newsrooms.
Although we do find differences in the percentage of clicks depending on the four factors considered here (the image, message, subscription type, and medium), the overall picture that emerges is far bleaker.
Spending nearly $5,000 per newsroom over a one-month period yielded few subscriptions. It would take decades to break even on the spending.
This is not to say that subscription appeals are always ineffective. The appeals used in the tests reported here went out during April and May of 2018 – perhaps different months yield better returns. Further, we worked with three different newsrooms – perhaps other newsrooms have more success. We varied the posts in only a few ways – perhaps there are other messages and images that would work better.
Finally, we looked only at direct click-through rates. With these caveats in mind, this report strongly suggests that newsrooms should be cautious about spending money to generate subscriptions.
The research here also raises important questions for additional research. There were many clicks to the subscription websites that did not convert into subscriptions. This begs for more attention to the subscription page. Can it be designed in ways to increase conversions? And does the combination of techniques yield a better rate of return?
Overall, newsrooms should engage in systematic evaluations of their efforts to generate subscriptions to determine whether it really is worth the expense. Given the results here, the need for innovation and testing seems paramount.
The Study
News Organizations Use Diverse Methods to Garner Subscribers, Donors
Before conducting the experiments, we interviewed staff from six newsrooms to understand their strategies for converting people into subscribers and donors. The news organizations are well-known for their innovative subscription and donation practices. Among the organizations, four are non-profit and two are for-profit. Each interview lasted for approximately 30 minutes and was audio-recorded with permission. The interviews were then transcribed and several key themes were identified:
- Direct email addressed to individuals who subscribe to the newsroom’s newsletters, social media such as Facebook, and traditional sales techniques (e.g., sales teams and radio pledge drives) are the most frequent techniques used to solicit members, donors, and subscribers.
- The most successful means for signing up new members is direct email paired with multiple channels (e.g., integration of social media, Facebook ads, and direct mail).
- Some news organizations consider social media to be the least successful way to attract new members because audiences are distracted by other information. Others, including several in our experiments, make extensive use of social media.
- Methods used to solicit subscribers, members, and donors include: (1) building relationships with audiences and making the relationship personal, (2) asking about subscriptions, memberships, or donations after a relationship has been built, (3) structuring appeals to target different kinds of audiences (e.g., focusing on what membership means to them, topics related to public service journalism, services provided to the community), and (4) keeping communication alive.
- Appeals that work well vary by news organization. Some use photos highlighting major investigative stories over the past year and reporters working. Others say that emails perform well when the subject lines include offers for targeted and specific subscription rates.
- Major barriers that prevent individuals from becoming subscribers, members, and donors include: free-of-charge options to read news offered by other organizations, low levels of engagement, and competition from other digital subscriptions sources (reflecting audiences’ limited budget for digital subscriptions).
- The newsrooms’ short-term plans include: integrating new advertising strategies such as fully- produced ad stories about local businesses into newsroom podcasts; separating and targeting different audiences; and keeping pace with technical changes, such as introducing Apple Pay, to decrease the barrier for payments/donations.
Two important findings from the interviews were: (1) the importance of visuals (pictures of journalists working, major news events) and (2) the importance of a “ladder of engagement” (Facebook “likes” and newsletter sign-ups followed by news subscriptions). These insights informed the design of our tests, as described on the following pages.
Images: Don’t Use Your Logo
Between April 16 and 29, three newsrooms randomly varied the image that accompanied their subscription appeals. The image was accompanied by text advertising for a free newsletter or a paid digital/print newspaper subscription. The subscription appeals appeared in Facebook Sponsored Posts, email messages, and newsletter advertisements. People were shown one of three images:
- The newspaper’s logo,
- A journalist at work, or
- An image depicting a top story covered by the newsroom.
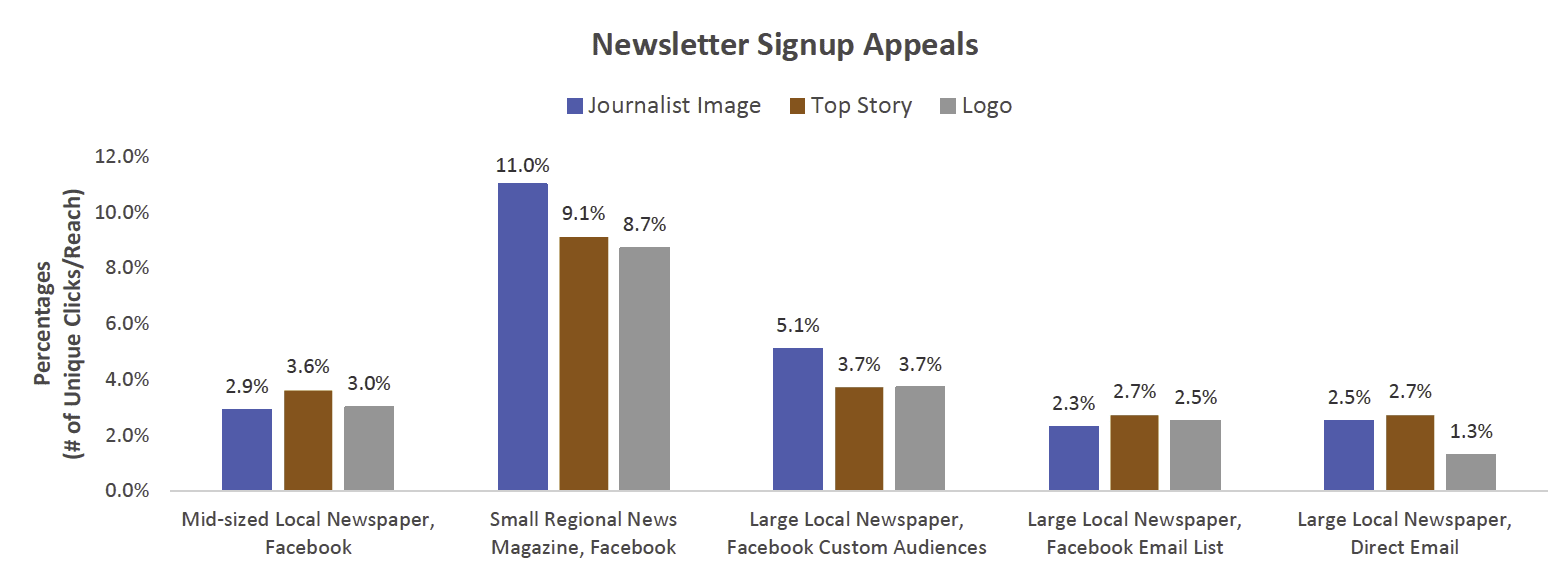
Overall, the journalist and top story images were more successful than the logo. Across 10 tests, the logo reduced the chances that someone would click on the subscription message by 16% compared to an image of a journalist at work.1 The logo also yielded a lower click-through rate compared to the top story image, although the difference was not statistically significant.2
Reactions to the images varied depending on how the tests were conducted. On Facebook, the logo yielded a 14% decline in clicks compared to the journalist image.3 Which image was used made no difference in how many clicked on a subscription appeal delivered via email or newsletter.4
The journalist and top story images performed differently across the three newsrooms. For the mid- sized local newsroom, the image of the top story performed 25% better than the other two.5
At the regional news magazine, the image of the journalist increased the chance of a click on a Facebook Sponsored Post by 26% compared to the top story image.6 The logo did not perform better, or worse, than the other two images.
Across all of the tests conducted by the large local newsroom via Facebook and email, the logo again resulted in fewer clicks than did the journalist image, although the difference was just shy of statistical significance.7
In sum, the logo did not perform well across the tests. For two of the newsrooms, there is some evidence favoring the image of the journalist and for the third newsroom, there is some evidence favoring the top story image.
Messages: They Matter Only Modestly, and Loss Messages Underperform
Between April 30 and May 15, the three newsrooms randomly varied the message that accompanied the winning image from the first test. They used:
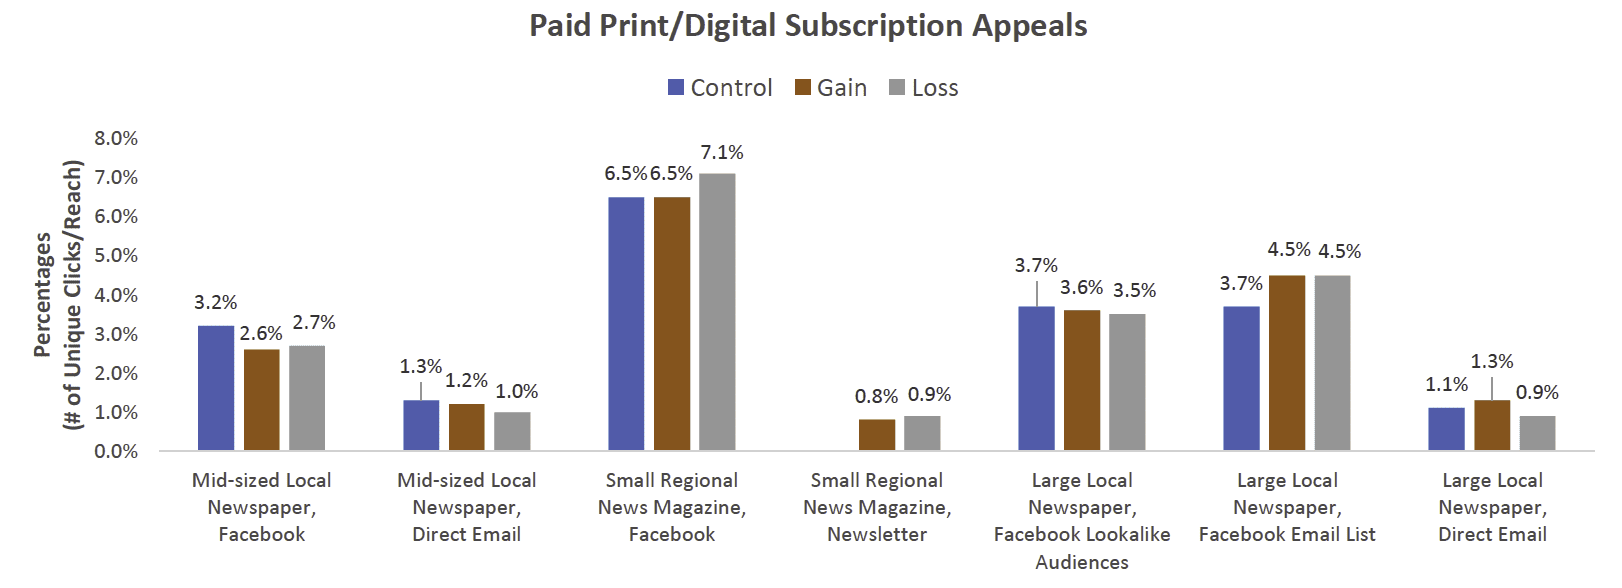
- A control message that described the cost and product (e.g., “Start a digital subscription for just 99 cents”),
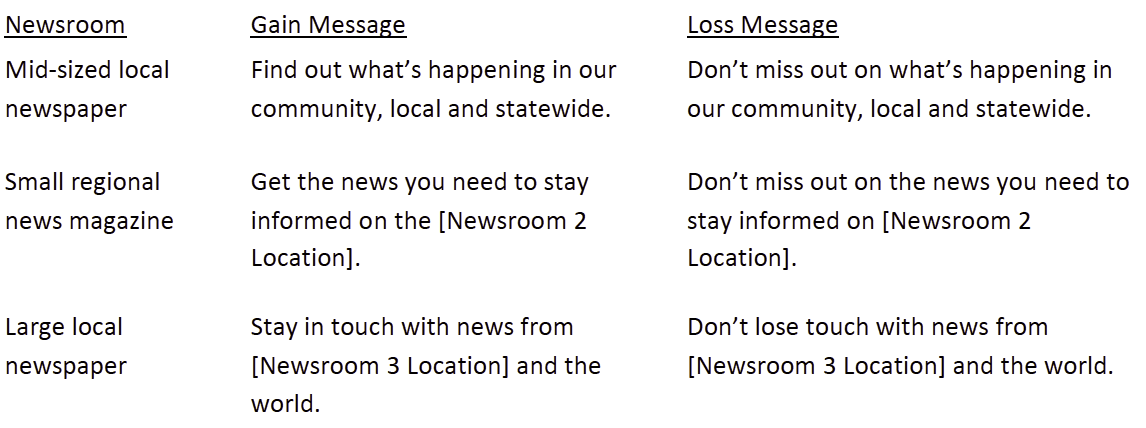
- A gain message that emphasized what people could gain from subscribing (e.g., “Stay in touch with news from our city and the world”) in addition to a description of the cost and product, or
- A loss message that emphasized what people could lose from not subscribing (e.g., “Don’t lose touch with news from our city and the world”) in addition to a description of the cost and product.
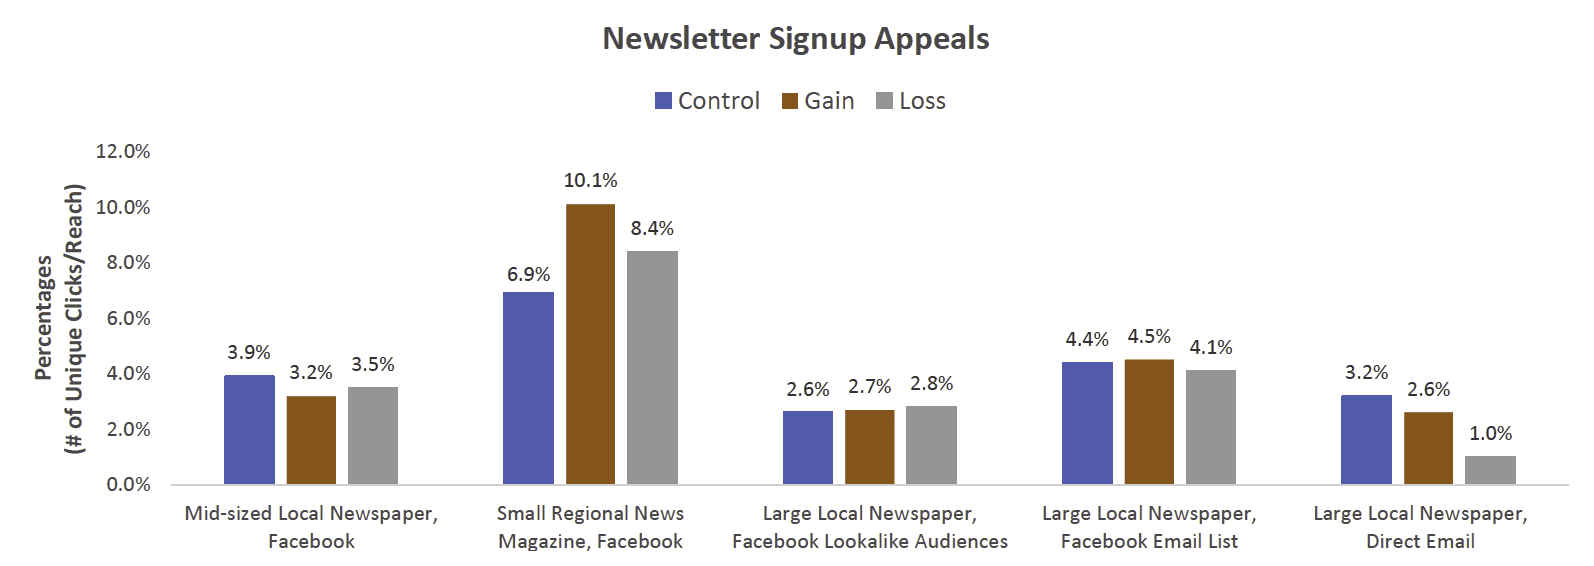
Across all of the tests, the message used did not matter. People were equally likely to click on the subscription appeal regardless of the message.
There were differences depending on whether the messages were delivered via Facebook or via email. For the two local news organizations that tested the messages via email, the message did have an effect: the loss message resulted in 41% fewer clicks than did the gain message.8 The loss message also resulted in fewer clicks than did the control message, although the difference fell just shy of statistical significance.9 For the Facebook tests, the message did not matter.
Overall, the message had only a modest effect on the probability that someone would click on a subscription appeal. Across all of the analyses, however, the loss message never yielded statistically more clicks that the other two and in some instances, it underperformed.
Free Newsletters Earn More Clicks Than Paid Subscriptions
The tests offered one of two different types of subscriptions:
- A paid subscription to a digital/print version of the newspaper
- A free subscription to a newsletter
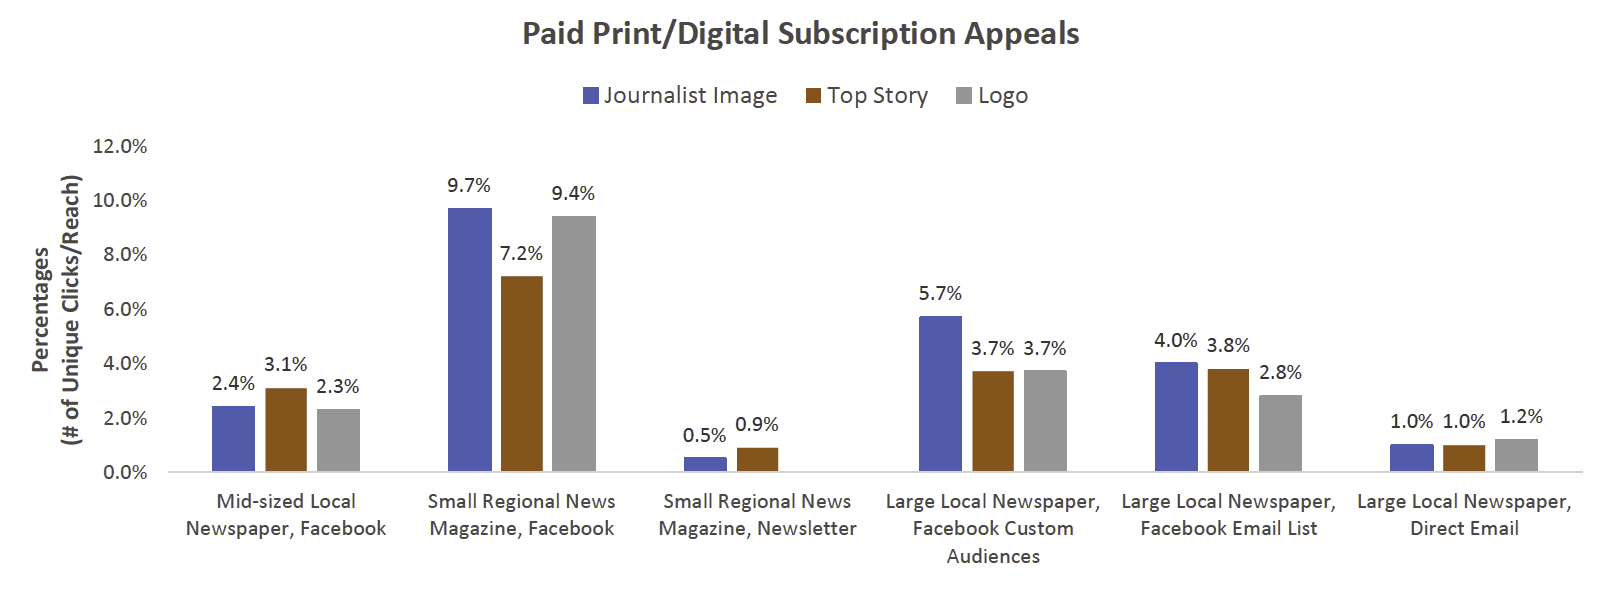
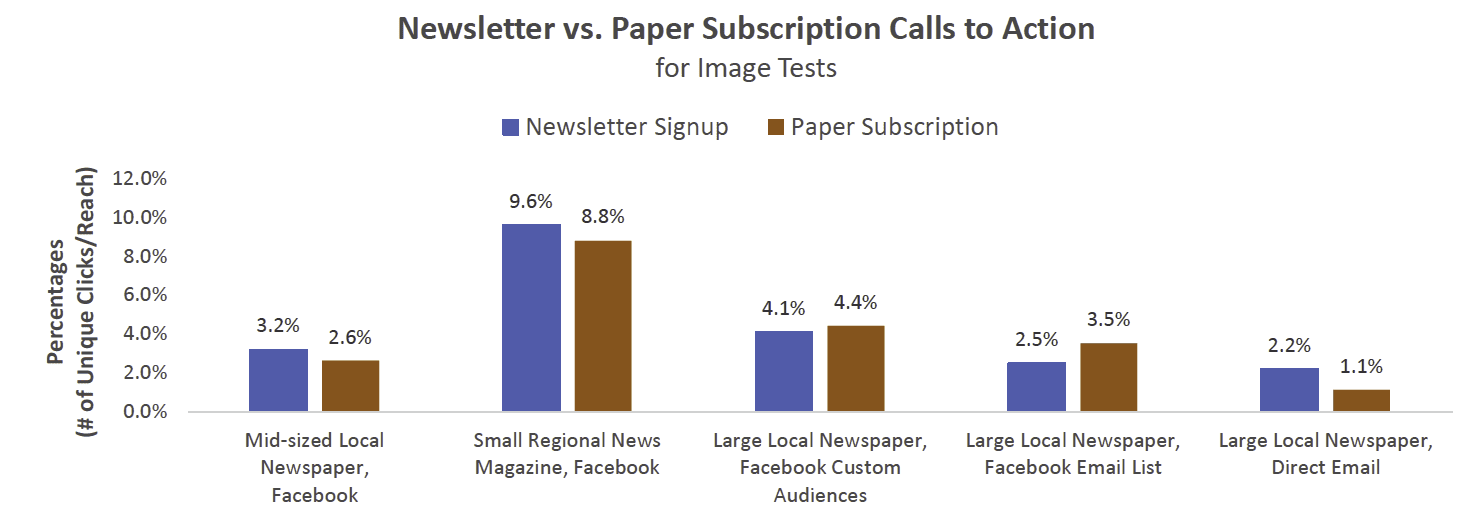
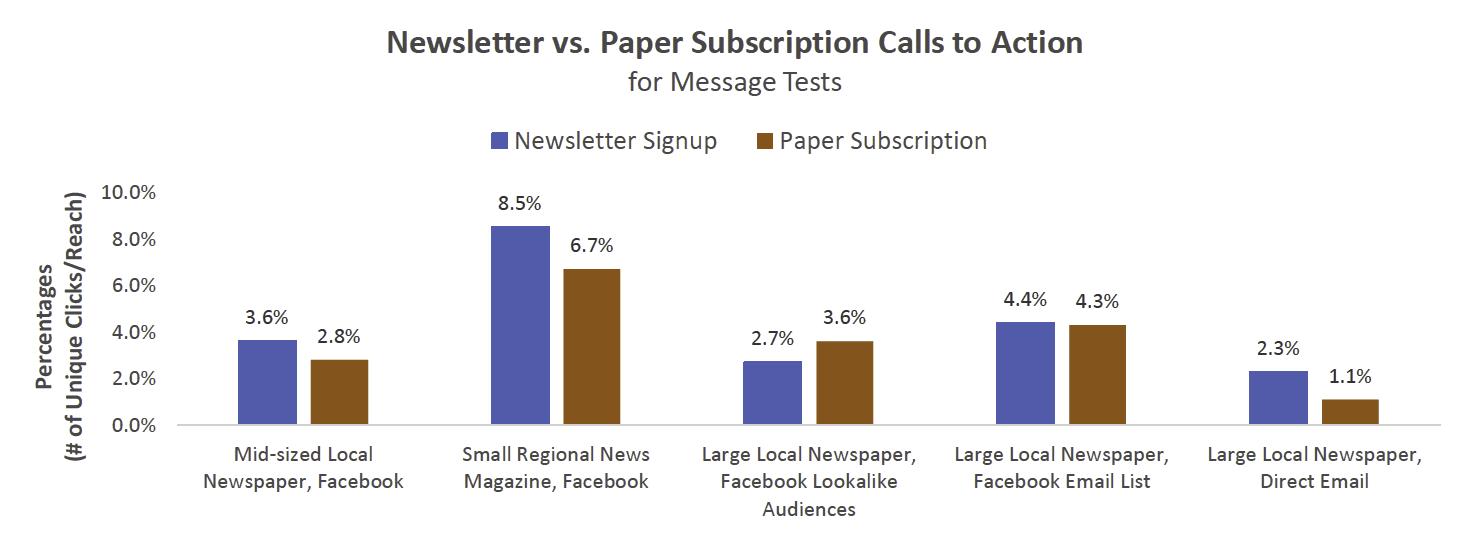
We paired ten tests for a paid subscription with the ten comparable tests for a free newsletter to see if one form of subscription yielded greater click-through rates than did the other. Across all the tests, the click-through rate was the same whether the subscription appeal was for a paid digital/print subscription or a free subscription to the newsletter.
There were differences depending on the news organization. For the mid-sized local newspaper and the small regional news magazine, Facebook ads for a free newsletter generated 23% and 17% more clicks, respectively, than ads for a paid subscription.10
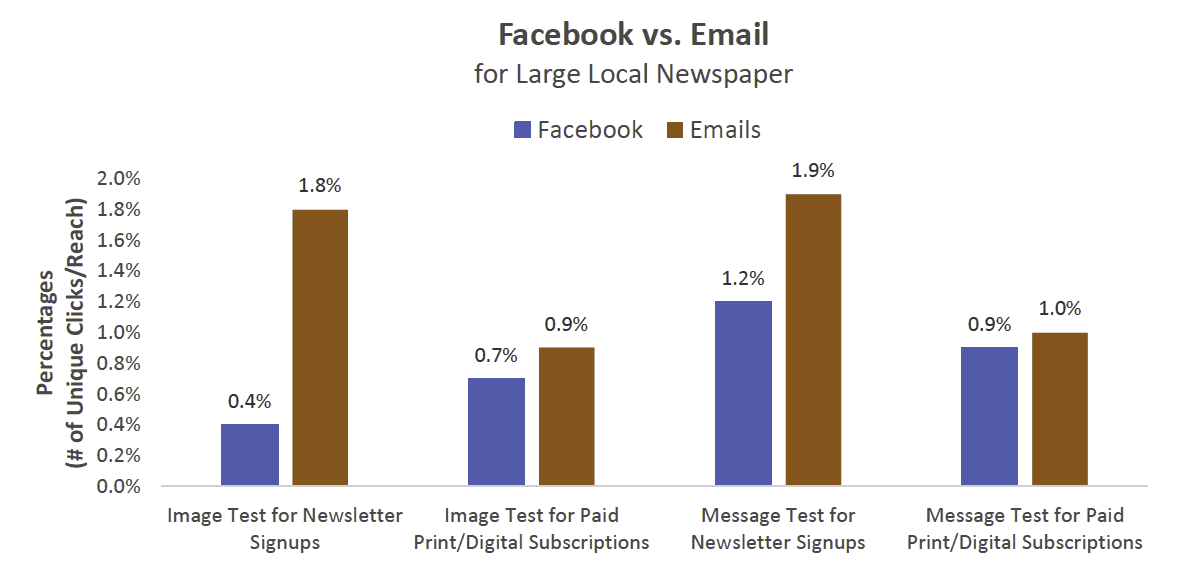
For the large local news organization, the percentage of clicks was the same regardless of whether the subscription appeal was for the paid paper or the free newsletter. Looking only at the email tests, however, the free newsletter appeal resulted in more than double the percentage of clicks than the paid subscription.11
Although there were some exceptions, in general, ads for a free newsletter generated more click-through than did ads for a paid subscription. This result is not terribly surprising. That the rate was only modestly different, however, is noteworthy.
Suggestive, But Not Definitive, Evidence That Emails Yield More Clicks Than Facebook Ads
For the large local news organization, we took a list of email targets and randomized whether we contacted people via Facebook or via email. This allowed us to have a direct test of which contact method yielded the higher click-through rate. There was suggestive evidence that emails returned a higher click-through rate than did Facebook ads, although it fell just short of statistical significance when looking at all of the tests together.12
 Clicks Frequently Don’t Convert Into Subscriptions
The newsrooms were able to provide some information about the number of subscribers that resulted from the tests.
The mid-sized local newsroom reported that no new paid subscriptions resulted from the Facebook campaign. From the email solicitation, 0.02% of those reached became paid subscribers (0.20% of those who opened the email, and 1.75% of those who clicked on the link).
For the regional news magazine, 1.06% of those reached by the ads for the newsletter on Facebook became newsletter subscribers (this is 11.66% of those who clicked on the ad). Only 0.07% of those reached by the ads for the print/digital product became paid subscribers (this is 1.42% of those who clicked on the ad).
For the large local newsroom, there were no new digital/print subscriptions resulting from the message tests. We do not have data directly corresponding with newsletter subscriptions.
We note that our tracking looks only at direct click-through. Other methods, such as using tracking pixels, allow organizations to see if someone who saw an ad did not immediately click, but came back later to subscribe. One of our newsroom partners told us that they found a higher subscription rate when using the tracking pixel and combining Facebook ads with other strategies such as on-site messaging. Understanding the effect of a combination of techniques on subscriptions is a worthy topic for future research.
Methodology
We had two phases of this work. In the first phase, we interviewed staff from newsrooms with a reputation for converting people into subscribers, donors, or members. In the second phase, we conducted Facebook tests with three newsroom partners. From April 16-29, newsrooms randomly varied the image that accompanied their subscription appeals: a logo, a journalist working, or an image of a top story for the news organization. From April 30-May 15, newsrooms randomly varied the message that accompanied their subscription appeals. They either just included information about the opportunity (e.g. Sign up for free newsletters OR Subscribe to print/digital product) or included a message emphasizing what individuals could gain or lose (e.g. Stay in touch… OR Don’t lose touch…) along with the information about the opportunity.
For the Facebook advertising, we used the split test feature to test different creatives. Each campaign was optimized for traffic to a website (either the newsletter signup page or subscription page). The only placement used for these ads was the Facebook News Feed. Each Facebook ad was also optimized for link clicks and paid for by impression. The daily spend rate for each campaign was set at $85.00, with the exception of the third newsroom, where we used two different strategies and split this daily spend in half. The call to action for each ad was “Learn More.”
Unless otherwise noted, each newsroom ran two different types of tests, one targeting paid newspaper subscriptions and one targeting free newsletter subscriptions. Here is a description of the tests run by newsroom:
- Mid-sized local newspaper
- Facebook: Random sample of target zip codes used for each test (so no one was part of more than one test), targeting 30-day visitors to the newspaper’s website, excluding current subscribers
- Email: List of targets, including newsletter subscribers and former newspaper subscribers
- Small regional news magazine
- Facebook: Random sample of target zip codes used for each test, targeted those who had liked the page and friends of those who had liked the page, excluding current subscribers
- Newsletter: Randomized an ad; only two conditions could be As the ad ran in the newsletter, only paid subscriptions were advertised to those who were signed up for the newsletter
- Large local newspaper
- Facebook: Random sample of target zip codes for each test, targeted those who subscribed (used lookalike audience for message tests), excluded emails being used for other tests
- Facebook: Targeted a random subset of target emails for those who had not subscribed
- Email: Sent to a random subset of target emails for those who had not subscribed
Images
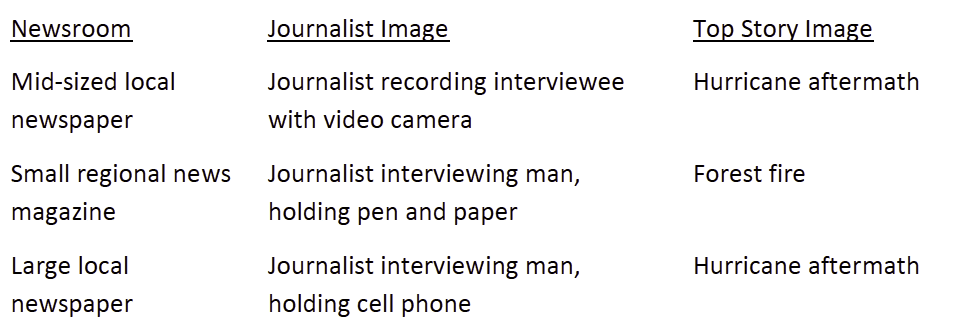
Since it was not possible to use the same images across the news organizations, images were selected based on comparability across newsrooms. The photo of a journalist was limited to one journalist working with an interviewee and the top story was restricted to an image related to a natural disaster.
The headlines accompanying the ads described the chance to subscribe either to the paper or to a newsletter. Although the headline used differed by newsroom, the same headline was used by each newsroom for all of the images tested.
Messages
To draw comparisons across the three newsrooms, we used pairs of gain and loss messages that were most similar across the newsrooms.
The images accompanying the ads were those that won in the previous tests. Although the image used differed by newsroom, the same image was used by each newsroom across all of the messages tested. The mid-sized local newsroom and the large local newsroom tested the messages via email. For these tests, the message was included in the subject line of the emails for one newsroom and in the subject line and body of the email for the other.
Newsletter Vs. Paper Subscription
As we randomly assigned different combinations of zip codes and email addresses to see different appeals, we are also able to compare the click-through rates of the tests targeting a free newsletter subscription to those tests targeting a paid newspaper subscription.
Facebook Vs. Emails
For the large local newsroom, we split the available emails into a Facebook or a direct email test, allowing us to compare them directly.
Analysis
To analyze the data, we used meta-analytic techniques to allow us to combine the different tests being conducted, as opposed to looking at one test at a time. We used random-effects models with restricted maximum likelihood estimation. We used meta-regression to determine where differences across tests resulted (e.g. differences by Facebook/email and by station). Only significant results from the meta-regression are discussed in text.
The results of these tests are included in the footnotes. Note that we did not include the regional news magazine’s newsletter tests because only two conditions were included. We did, however, analyze these results separately and report them in the text as they apply.
SUGGESTED CITATION:
Stroud, Natalie Jomini, Kim, Yujin and Collier, Jessica. (2018, September). Subscription messages. Center for Media Engagement. https://mediaengagement.org/research/subscription-messages
- Results from a random-effects model with restricted maximum likelihood estimation using the meta package in R, B = -0.18, exp(B) = 0.84, SE = 0.09, p <.05 [↩]
- Results from a random-effects model with restricted maximum likelihood estimation using the meta package in R, B = -0.12, exp(B) = 0.88, SE = 0.09, p = .19 [↩]
- Results from a random-effects model with restricted maximum likelihood estimation using the meta package in R, B = -0.15, exp(B) = 0.86, SE = 0.06, p <.05 [↩]
- The two local newspapers used an email test. The regional news magazine tested the journalist and top story images in a newsletter test, where the results from a two-sample proportion test, Z = .93, p = .35 were not significant. [↩]
- Results from random-effects models with restricted maximum likelihood estimation using the meta package in R. Top vs. Journalist: B = 0.22, exp(B) = 1.25, SE = 0.07, p < .01; Top vs. Logo B = B = 0.22, exp(B) = 1.25, SE = 0.08, p < .01 [↩]
- Results from a random-effects model with restricted maximum likelihood estimation using the meta package in R, B = 0.23, exp(B) = 1.26, SE = 0.08, p < .01 [↩]
- Results from a random-effects model with restricted maximum likelihood estimation using the meta package in R, B = -0.26, exp(B) = 0.77, SE = 0.14, p = .06 [↩]
- Results from a random-effects model with restricted maximum likelihood estimation using the meta package in R, B = -0.53, exp(B) = 0.59, SE = 0.24, p < .05 [↩]
- Results from a random-effects model with restricted maximum likelihood estimation using the meta package in R, B = -0.54, exp(B) = 0.58, SE = 0.32, p = .09 [↩]
- Results from a random-effects model with restricted maximum likelihood estimation using the meta package in R, mid-sized local newsroom B = 0.21, Exp(B) = 1.23, SE = 0.04, p < .001; regional news magazine B = 0.15, Exp(B) = 1.17, SE = 0.07, p < .05 [↩]
- Results from a random-effects model with restricted maximum likelihood estimation using the meta package in R, B = 0.73, Exp(B) = 2.08, SE = 0.04, p < .001 [↩]
- Note that the denominator for these tests is all the emails we attempted to reach, including those that were not matched in Facebook or bounced back via email because this is the most direct way to compare the two. In other tests in this report, the denominator was the total number of respondents reached. Results from a random-effects model with restricted maximum likelihood estimation using the meta package in R, B = 0.54, Exp(B) = 1.72, SE = 0.29, p = .06. [↩]


