


The Center for Media Engagement examined over 950 web pages from a representative sample of 155 newspaper and television news websites in the United States to understand how they were using social media buttons, comment sections, online polls, lists of hyperlinks, and mobile versions. We analyzed the websites of the top 25 newspapers by circulation, the top six network, and cable news sources, 61 randomly selected local newspapers, and 63 randomly selected local television outlets in November and December of 2013.1
Key Findings
Interactive features are common on today’s newspaper and television news websites. This report shows that:
- Over 95% of news sites allow site visitors to “share,” “like,” or “recommend” news contention social media.
- News sites let users “share” content via Facebook more than “like” or “recommend” the content.
- Over 90% of news sites have a comment section.
- Comment section codes of conduct appear on 33% of top television news and 74% of top newspaper sites.
- Interactive polls appear more frequently on newspaper sites than on television news sites.
- News sites rarely warn visitors that online poll results are not scientific.
- Over two-thirds of news sites include links to related and recommended content.
- Over 70% of news sites have links to their most popular content. Of these sites, approximately three-fourths require scrolling before links to the most popular content are visible on the homepage.
- Approximately 30% of local television news stations and top newspapers advertise a mobile app on their homepage, but not on the main page of their mobile site.
The Study
Which Social Media Buttons Appear & How Often They Are Used Varies
Nearly all news organizations have integrated social media into their sites. Users almost always have the ability to “like,” “recommend,” or “share” news articles through Facebook, tweet articles through Twitter, or share articles using another system, such as AddThis or Google+.
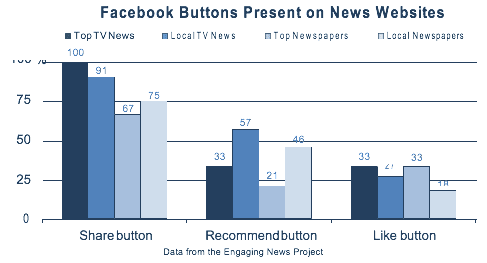
 Sites use different Facebook buttons, however. Nearly all sites enable users to “Share” a story via Facebook, frequently as a component of an AddThis or ShareThis feature that allows site visitors to share a story on a variety of different social media platforms. “Like” and “Recommend” buttons, however, are less common.
Local television news sites are more likely to have a “Recommend” button (57%) than a “Like” button (27%). The same is true for local newspaper sites, where 46 percent have a “Recommend” button and only 18 percent offer a “Like” button. There is less variability for the top news sites, where one‐third of television news sites have a “Like” button and one‐third have a “Recommend” button. Further, one‐third of high circulation newspaper sites offer a “Like” button and approximately two in ten (21%) have a “Recommend” button.
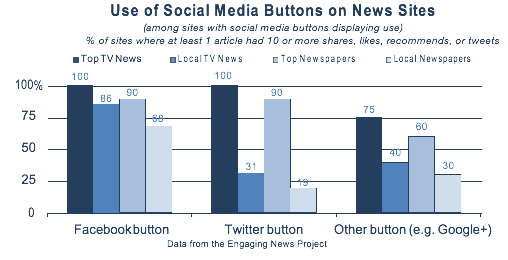
 Use of social media varies by top versus local news sites. Here, we look only at sites where social media buttons display how frequently the button is used.2 Facebook is most used, garnering 10 or more shares on at least one article on all of the top television news sites and on nearly all of the top newspaper (90%) and local television news (86%) sites that display Facebook use. Only 68 percent of local newspapers showing Facebook use, however, have an article with 10 or more shares, likes, or recommends on Facebook. Other social media platforms and Twitter are used less frequently on local television news and newspaper sites than on top outlets’ sites.
 Comment Sections Are Ubiquitous, Codes of Conduct Less So
Comment sections are present on all of the top television news and top newspaper sites. Only nine percent of local television news sites and eight percent of local newspaper sites do not have a comment section. Many news organizations use a comment section platform, such as Facebook or Disqus, although a few have comment sections created uniquely for their site.
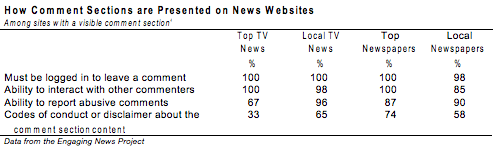
Comment sections are frequently used on the top television news and newspaper websites.3 At least one article had 10 or more comments on all top television news and top newspaper sites. Local sites see less use, however. Only 41 percent of local television news sites with a comment section and 38 percent of local newspaper sites with a comment section had an article with 10 or more comments. Nearly all sites with comment sections require a log‐in, whether through Facebook, a unique log‐in specific to the site, or another system. All of the television news and top newspaper sites require commenters to log‐in, followed by 98 percent of the local newspaper sites.
Sites almost always have a way for users to interact with other commenters, by liking, replying, or voting comments up or down (“^” or “v”). Again, all top television news and newspaper sites make it possible for commenters to interact. Ninety‐eight percent of local television news sites do so and 85 percent of local newspapers give visitors the option to interact with the comments. Most sites have a way for users to report abusive comments, although it is less common among the top television news sites with comment sections (67%) compared to the other news sites, where 87 percent of top newspapers, 90 percent of local newspapers, and 96 percent of local television news sites with comment sections give commenters the ability to report abusive comments.
Some sites include codes of conduct about how to behave in the comment section (e.g. “Please keep your comments smart and civil”) or a disclaimer about the content of the comments (e.g. “Comments are the sole responsibility of the person posting them; they are not reflective of the views or opinions of (the organization)”). These are most common on top newspaper websites (74%) and least common on top television websites (33%).4
 More Interactive Polls on Newspaper Sites than on Television News Sites
Interactive polls are more common on newspaper sites than on television news sites. They appear most on sites from local newspapers (57%) and the top circulating newspapers (42%). They are least frequently seen on the sites for local television news outlets (32%) and top television news outlets (17%).
Few sites have polls focused on politics. Of sites with polls, polls solely about politics are most common on local newspaper sites (23%) and least common on top television news sites (0%). It is more common to see several poll questions covering a range of topics. Several sites use CivicScience, which displays several poll questions in a row on different subjects. Some sites allow visitors to comment on a poll, but the practice is far from universal. None of the top newspapers’ sites allow users to comment on the polls. The one top television news outlet with a poll, however, gives visitors the option to comment on it.
The same top television news site also has a poll archive, or a collection of previous poll questions and results. Archives are available on 30 percent of local television news sites with polls, 40 percent of top newspaper sites with polls, and 53 percent of local newspaper sites with polls. In at least two‐thirds of all instances in which a poll is present, the poll appears on the news site’s homepage, but requires the site visitor to scroll to see it.5
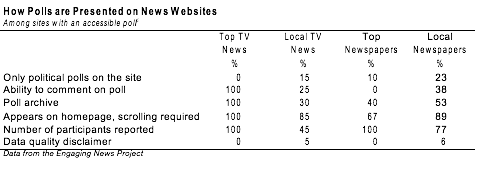 Sites do not always provide methodological details for their polls. The top television and newspaper sites with polls always disclose the number of times a poll has been taken, yet only 77 percent of local newspaper sites with polls and 45 percent of local television news sites with polls do so. Further, only rarely is there any warning that the poll results should be treated with caution, or may not be appropriate indicators of public opinion. On the rare occasion that they appear, caveats about the poll use wording such as: “Results not scientific.”
Hyperlinks to Most Popular Content Frequently Appear “Below the Fold”
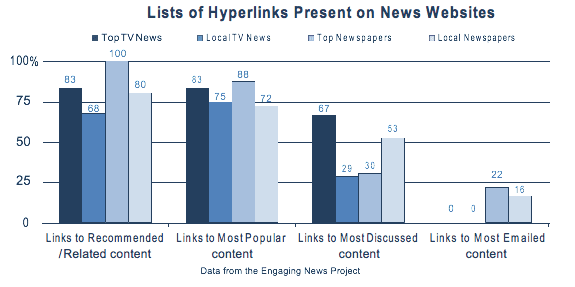
Some news organizations include lists of hyperlinks to “related / recommended” content, “most popular” content, “most discussed” content, “most emailed” content, or synonyms (e.g. “most commented” as opposed to “most discussed”).
The most frequent list of hyperlinks is to related / recommended content. On some news sites, the list is curated by news staff and includes links to topically similar stories. Other sites, however, rely on algorithms to recommend content. Lists of recommended stories provided by the firm Outbrain appear frequently. All of the top newspaper sites have lists of links to related and recommended content, as do 83 percent of top television news sites. The practice is least common on local television news sites, where only 68 percent of sites have links to related and recommended content.
Lists of hyperlinks to “Most Popular” content also are common and appear on between 72 percent of sites for local newspapers and 88 percent of sites for top newspapers. Links to “Most Discussed” content are comparatively less frequent, appearing on two‐thirds of top television news sites, approximately half of local newspaper sites, and around three in ten local television news and top newspaper sites.
The most infrequent hyperlinks on the news sites are “Most Emailed” lists. There are no lists of “Most Emailed” content on any of the television news websites, and they appear on fewer than one‐quarter of the newspaper sites.
 Across all of the news media sites, “Most Popular” links typically appear on the main page but require the site visitor to scroll in order to see the list. On 79 percent of local television news sites with links to the “Most Popular” content, the links appear on the homepage and require scrolling for site visitors to see. The same is true for 71 percent of top and local newspaper sites and 60 percent of top television news sites with “Most Popular” links.
 Mobile Apps Advertised on Homepage, Not Always on Mobile Site
Nearly all of the news organizations examined have a mobile site, or a site that loads in a different format on a mobile device than on a desktop. There is more variability in whether or not a news organization advertises having a mobile app. Between two‐thirds and three‐fourths of top television news, local television news, and top newspaper sites advertise a mobile app on the homepage. In contrast, only 28 percent of local newspaper sites do so. Similarly, between 38 and 50 percent of top television news, local television news, and top newspaper sites include a link to a mobile app when accessing the site on a mobile phone. Only 20 percent of local newspaper sites have a link to a mobile app.
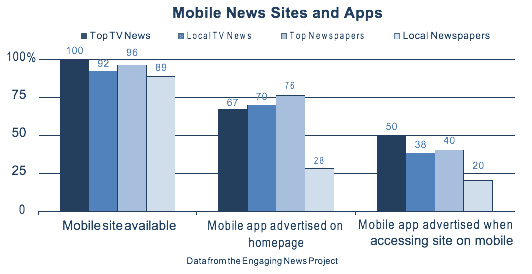 Some sites advertising a mobile app on the homepage do not advertise the app on the mobile version of their site. Although 70 percent of local television news sites advertise a mobile app on the homepage, only 38 percent advertise the app when accessing the site via mobile. Similarly, although 76 percent of top newspapers advertise a mobile app on their homepages, only 40 percent advertise it when accessing the site via mobile.
History of The Interactive Landscape
News organizations have invested heavily in creating a digital presence. News websites are not only avenues to disseminate information, but also a place to engage with users in ways not possible through traditional media channels. Hyperlinks, comment sections, polls, and social media buttons (for example, a Twitter button that enables you to tweet a link to an article) are all interactive features found on websites.
The earliest news websites contained little more than electronic versions of offline content, known as “shovelware,” because news organizations would simply shovel their content onto a website.6 Along with the shovelware, news websites slowly began to debut features that enabled users to interact with the newsroom staff and the online content.
At first, these interactive features were limited to a link to email the newsroom, or a hyperlink from one article to the next.7 In spite of online interactivity’s quiet beginning, it quickly became apparent that the ability to interact with audiences was gaining traction, and researchers have been cataloging advances in interactivity ever since those first “email this article” buttons began popping up on news sites.8
Why the focus on and excitement about interactivity? The arrival of these news features suggested that the “filter first, publish second” model was transforming. The traditional system was evolving due to the possibility of “mass self‐communication” by lay audiences.9 Site visitors could not only interact directly with reporters through electronic means, but they also could change and personalize news content for themselves and others, leaving a news website different than how it looked before they visited by, for example, commenting on a story.10
For almost as long as people have been touting the promise of interactivity, however, others have been lamenting that this promise has gone largely unfulfilled.11 A decade after news websites began appearing, most remained bereft of interactive features. For example, one prominent study conducted in 1998 found that only 10% of news websites had comment sections or chat rooms.12 Other studies from the same time period echoed similar results.13 In the realm of interactivity, news websites were all too frequently a space of unmet potential.
In spite of the hype surrounding interactivity, few news outlets were adopting these promising features. Web programming was a field still coming into its own, meaning that it was difficult to find people with the skills to create and manage these novel features. Moving a newsroom online – purchasing the hardware and software, to say nothing of hiring employees proficient in the new medium – was cost-prohibitive. Thus, economic and labor factors meant that only the largest and most prosperous news outlets were able to blaze a trail into the online realm and adopt innovative interactive features. Indeed, the larger the news outlet’s circulation, the more advanced the interactive features being offered on its website.14
One other factor must be mentioned in regard to the slow adoption of interactive features. In many newsrooms, there was a reluctance to give consumers control of what happens on a news website.15 Editors feared poor comments could tarnish their organization’s brand. Others expressed a hesitation to reallocate time and money from reporting the news to monitoring a website. Although not all newsrooms shared this reluctance, many were wary of what would happen to the news product as the use of interactive features increased.
As time has passed, many of these issues have been resolved. Today, programming expertise exists in abundance. Computer equipment has become relatively affordable. And pressures to remain relevant and profitable in the modern news media environment have trumped concerns about ceding some website control to site visitors.16
As these barriers to interactivity dissipated, more and more websites began to adopt interactive features.17 Not only can visitors leave comments, but they can interact with other commenters by replying and voting comments “up” and “down,” to say nothing of “liking” them. In short, the usage of interactive features on news websites is growing.18
The growth, however, has not been the same across all news channels. News outlets in larger markets have been early adopters of interactive features, while medium and small‐market outlets have lagged behind.19
This imbalance also has been seen across different media channels. A recent study looking at online polls and hyperlinks found that more than 30% of U.S. newspaper sites had online polls, but less than 25% of television news sites had polls.8 Conversely, articles on television news sites had more hyperlinks than newspapers (29% for TV compared to 15% for newspapers). Other studies have shown similar patterns of unequal feature adoption.20
Up to now, the story of interactive features has been one of scattered, limited adoption across news websites. But this pattern is changing. With barriers to interactive feature creation eroding and a steadily, if not rapidly, rising adoption of these features across news organizations, evidence is mounting that interactive feature implementation across news websites is not only growing, but converging.21
Today’s landscape is one where a wide variety of interactive features are found on news websites, regardless of market size and channel. This research provides a comprehensive look at this convergence. Some differences in practices and in the features used by top newspaper sites, top television news sites, local newspaper sites, and local television news sites were apparent. Overall, however, the study illustrates how common interactive features on news sites have become.
Methodology
In this study, we examined over 950 web pages from a representative sample of 155 newspaper and television websites in the United States. This sample included:
- The top 25 newspapers by circulation in 2012, according to the Pew Research Center’s Project for Excellence in Journalism.22
- The top six network and cable news outlets, according to Nielsen ratings (ABC News, CBS News, CNN, Fox News, MSNBC, and NBC News).
- Sixty-one local newspapers randomly selected from the 145th Edition of the Gale Directory of Publications and Broadcast Media.
- Sixty-three local television outlets randomly selected from the 145th Edition of the Gale Directory of Publications and Broadcast Media.
The study took place in November and December 2013. To account for content as well as engagement changes that take place on a news website throughout the day and over the course of a week, we designed an innovative schedule to capture this variation.23 The analysis schedule spanned four weeks. We divided each day into three time blocks corresponding to the morning, afternoon, and evening. Each outlet was randomly assigned to a day and time block. On each day of the schedule, we began with a website’s homepage and, as available, we clicked on hyperlinks to: (1) the five most prominent articles, (2) the five “most popular” articles, and (3) the five “most discussed” articles. The most prominent articles were defined as those stories located “above the fold” of the main webpage that could be located without scrolling, beginning in the upper left corner. We looked for the “most discussed” and “most popular” articles on the homepage and within the five most prominent articles.24 Although these articles were often labeled as “most discussed” and “most popular,” we also looked for synonymous labeling, such as “most clicked” or “most commented.” We analyzed the homepage and up to 15 news stories on each website for the presence and absence of interactive features. On sites with paywalls, we accessed as much of the site as possible without having to pay. In most instances, we did not have difficulty in completing our coding despite the presence of a paywall. Variations in sample size resulting from paywalls or, in rare circumstances portions of the sites not working properly, are included in the footnotes. We accessed each mobile site by searching for the outlet’s name on Safari browsers on an iPhone and then opening the main link.
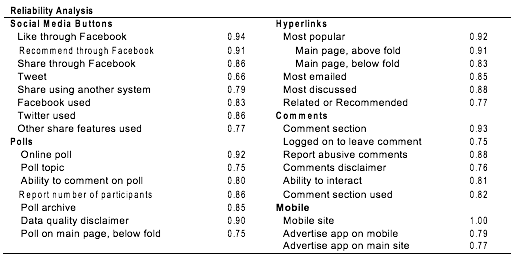
Before beginning our coding, we conducted a reliability analysis to ensure that the coding team was correctly identifying the features. Within each news genre, we coded a minimum of 20 percent of websites in an iterative process until each code achieved acceptable reliability. We used Krippendorff’s alpha as a measure of reliability, where scores above 0.67 are considered acceptable.
SUGGESTED CITATION:
Stroud, Natalie Jomini, Scacco, Joshua, and Curry, Alex. (2014, March). Analysis of News Sites. Center for Media Engagement. https://mediaengagement.org/research/news-site-analysis/
- Top newspapers are those with the largest circulations based on data from the Pew Research Center’s Project for Excellence in Journalism “The State of the News Media 2013,” http://stateofthemedia.org/2013/newspapers‐stabilizing‐but‐still‐ threatened/newspapers‐by‐the‐numbers/. For one newspaper outlet, the paywall prevented coding of all categories reducing the size to 24 outlets in some instances. Top television sources were selected according to Nielsen ratings and included: ABC News, CBS News, CNN, Fox News, MSNBC, and NBC News. The local newspaper and television news outlets were randomly selected from the 145th Edition of the Gale Directory of Publications and Broadcast Media. [↩]
- For Facebook use, this corresponds to 5 national television sites (83% of all national television news sites analyzed), 56 local television news sites (89%), 19 national newspaper sites (76%), and 41 local newspaper sites (67%). For Twitter use, this corresponds to 4 national television sites (67%), 32 local television news sites (51%), 19 national newspaper sites (76%), and 36 local newspaper sites (59%). For other social network use, this corresponds to 4 national television sites (67%), 48 local television news sites (76%), 15 national newspaper sites (60%), and 33 local newspaper sites (54%). [↩]
- Data are for sites with visible comment sections. This corresponds to 6 national television sites (100%), 56 local television sites (98% of local television sites with comment sections), 23 top newspaper sites (96% of top newspaper sites with comment sections), and 50 local newspaper sites (89% of local newspaper sites with comment sections). A determination could not be made for all sites because of paywalls and/or parts of sites not functioning properly. [↩]
- Data for logging on to leave a comment correspond to 6 top television news sites (100%), 53 local television news sites (93% of sites with comment sections), 23 top newspapers (96% of sites with comment sections), and 56 local newspapers (100%). For interacting with others, the corresponding numbers of sites are 6 (100%), 46 (81%), 22 (92%), 40 (71%). For reporting abusive comments, the corresponding numbers of sites are 6 (100%), 46 (81%), 23 (96%), and 41 (73%). For codes of conduct, the corresponding numbers of sites are 6 (100%), 46 (81%), 22 (92%), and 40 (71%). A determination could not be made for all sites because of paywalls and/or parts of sites not functioning properly. Further, for interacting with others and reporting abusive comments, it was sometimes not possible to make this determination when no comments had been left on a site. [↩]
- In general, the data are for all sites with a poll present. On 3 of 35 local newspaper sites with polls, we were not able to determine whether respondents could comment on the poll, whether there was a poll archive, and whether there was a poll disclaimer. On 4 of the 35 newspaper sites, we were not able to determine whether the number of participants was reported. [↩]
- Tremayne, M., Schmitz Weiss, A., & Calmon Alves, R. (2007). From product to service: The diffusion of dynamic content in online newspapers. Journalism & Mass Communication Quarterly, 84(4), 825‐839. [↩]
- Li, X. (1998) Web page design and graphic use of three U.S. newspapers. Journalism & Mass Communication Quarterly, 75(2), 353‐365; Schultz, T. (1999). Interactive options in online journalism: A content analysis of 100 U.S. newspapers. Journal of Computer‐Mediated Communication, 5(1). [↩]
- Guenther, E., & Scharkow, M. (2013). Recycled media: An automated evaluation of news outlets in the twenty‐first century. Digital Journalism, doi: 10.1080/21670811.2013.850207. [↩][↩]
- Bowman, S., & Willis, C. (2003, July). We media: How audiences are shaping the future of news and information. Retrieved from http://www.mediacenter.org/mediacenter/research/wemedia/; Castells, M. (2009). Communication power. New York, NY: Oxford University Press. [↩]
- Indeed, something as simple as commenting on a news story can affect how other readers perceive the story. Anderson, A.A., Brossard, D., Scheufele, D. A., Xenos, M. A., & Ladwig, P. (forthcoming). The “nasty effect:” Online incivility and risk perceptions of emerging technologies. Journal of Computer‐Mediated Communication. Advanced Online Version. doi: 10.1111/jcc4.12009; In addition, see the recent debate over Popular Science’s deletion of comment sections. [↩]
- Quandt, T. (2008). (No) news on the world wide web? Journalism Studies, 9(5), 717‐738; Schultz, T. (2000). Mass media and the concept of interactivity: An exploratory study of online forums and reader email. Media, Culture & Society, 22(2), 205‐221. [↩]
- Chan‐Olmsted, S. M., & Suk Park, J. (2000). From on‐air to online world: Examining the content and structures of broadcast TV stations’ web sites. Journalism & Mass Communication Quarterly, 77(2), 321‐339. [↩]
- Kiernan, V., & Levy, M.R. (1999). Competition among broadcast‐related web sites. Journal of Broadcast & Electronic Media, 43(2), 271‐279. [↩]
- Greer, J., & Mensing, D. (2004). The evolution of online newspapers: A longitudinal content analysis, 1997‐2003.” Newspaper Research Journal, 25(2): 98‐112. [↩]
- Loke, J. (2012). Old turf, new neighbors: Journalists’ perspectives on their new shared space. Journalism Practice, 6(2), 233‐249. See also: Hermida, A., & Thurman, N. (2008). A clash of cultures: The integration of user‐generated content within professional journalistic frameworks at British newspaper websites. Journalism Practice, 2(3), 343‐356; and Singer, J. B. (2006). Stepping back from the gate: Online newspaper editors and the co‐production of content in campaign 2004. Journalism & Mass Communication Quarterly, 83(2), 265‐280. [↩]
- Vujnovic, M., Singer, J. B., Paulussen, S., Heinonen, A., Reich, Z., Quandt, T., Hermida, A., & Domingo, D. (2009). Exploring the political‐economic factors of participatory journalism: A first look into self‐reports by online journalists and editors in ten countries. Journalism Practice, 4(3), 285‐296. [↩]
- Tremayne, M., Schmitz Weiss, A., & Calmon Alves, R. (2007). From product to service: The diffusion of dynamic content in online newspapers. Journalism & Mass Communication Quarterly, 84(4), 825‐839. Market size was broken down by circulation size as follows: large = 2,000,000‐400,000; medium = 230,000‐180,000; small = 120,000‐100,000. [↩]
- Anderson, et al., The “nasty effect”; Tremayne, et al., From product to service. [↩]
- Greer & Mensing, The evolution of online newspapers. [↩]
- Bucy, E.P. (2004). Second generation net news: Interactivity and information accessibility in the online environment. The International Journal on Media Management, 6(1&2), 102‐113; Chung, D.S. (2007). Profits and perils: Online news producers’ perceptions of interactivity and uses of interactive features. Convergence, 13(1), 43‐61; Chung, D.S. (2008). Interactive features of online newspapers: Identifying patterns and predicting use of engaged readers. Journal of Computer‐Mediated Communication, 13, 658‐679. [↩]
- Cooke, L. (2005). A visual convergence of print, television and the Internet: Charting 40 years of design change in news presentation. New Media & Society, 7(1), 22‐46. Cooke notes that the look of news in the U.S. is converging across all media platforms. [↩]
- Pew Research Center’s Project for Excellence in Journalism, “The State of the News Media 2013,” http://stateofthemedia.org/2013/newspapers‐stabilizing‐but‐still‐threatened/newspapers‐by‐the‐numbers/. [↩]
- This builds on a form of sampling known as “constructed week.” This sampling approach takes a random selection of days to form a week (or more) in which to analyze media content. We innovate by creating an analysis schedule divided by both day and time. For additional information, see: Connolly‐Ahern, C., Ahern, L. A., & Bortree, D. S. (2009). The effectiveness of stratified constructed week sampling for content analysis of electronic news source archives: AP Newswire, Business Wire, and PR Newswire, Journalism & Mass Communication Quarterly, 86, 862‐883; Hester, J. B., & Dougall, E. (2007). The efficiency of constructed week sampling for content analysis of online news, Journalism & Mass Communication Quarterly, 84, 811‐824; Luke, D. A., Caburnay, C. A., & Cohen, E. L. (2011). How much is enough? New recommendations for using constructed week sampling in newspaper content analysis of health stories, Communication Methods and Measures, 5, 76‐91; Riffe, D., Aust, C. F., & Lacy, S. R. (1993). The effectiveness of random, consecutive day and constructed week sampling in newspaper content analysis, Journalism & Mass Communication Quarterly, 70, 133‐139. [↩]
- See a similar methodology in Boczkowski, P. J., & Peer, L. (2011). The choice gap: The divergent online news preferences of journalists and consumers. Journal of Communication, 61(5), 857–876. We coded the most prominent articles embedded with a scrolling prominent cue of pictures, as well as those listed as links on the upper left side of the main page. [↩]