


![]()

This project was led by the News Co/Lab at Arizona State University in collaboration with the Center for Media Engagement at The University of Texas at Austin. Together, we designed and tested an online survey tool that news organizations can use to improve transparency, engagement, and mutual understanding with the communities they serve.
The News Co/Lab, at ASU’s Walter Cronkite School of Journalism and Mass Communication, envisioned, co-created, and promoted the survey online with the help from newsrooms at The Fresno Bee, The Kansas City Star, and The Telegraph in Macon, Georgia.
The Center for Media Engagement at UT Austin’s Moody College of Communication researched previous surveys and co-created the survey instrument with News Co/Lab partners at the Cronkite School. The collaboration also included feedback from the Media Education Lab at the University of Rhode Island, American Press Institute, Google Surveys, and those who commented on blog posts of a draft of the survey questions. Center for Media Engagement researchers programmed the survey using Qualtrics, collected and analyzed survey results, and produced this preliminary report.
Under the banner of “news awareness,” the survey bundled questions on attitudes about news and local news with a test of news literacy. In all 4,854 people who live in Fresno, Kansas City, and Macon took the survey.
Key Findings
The following results stand out from the surveys:
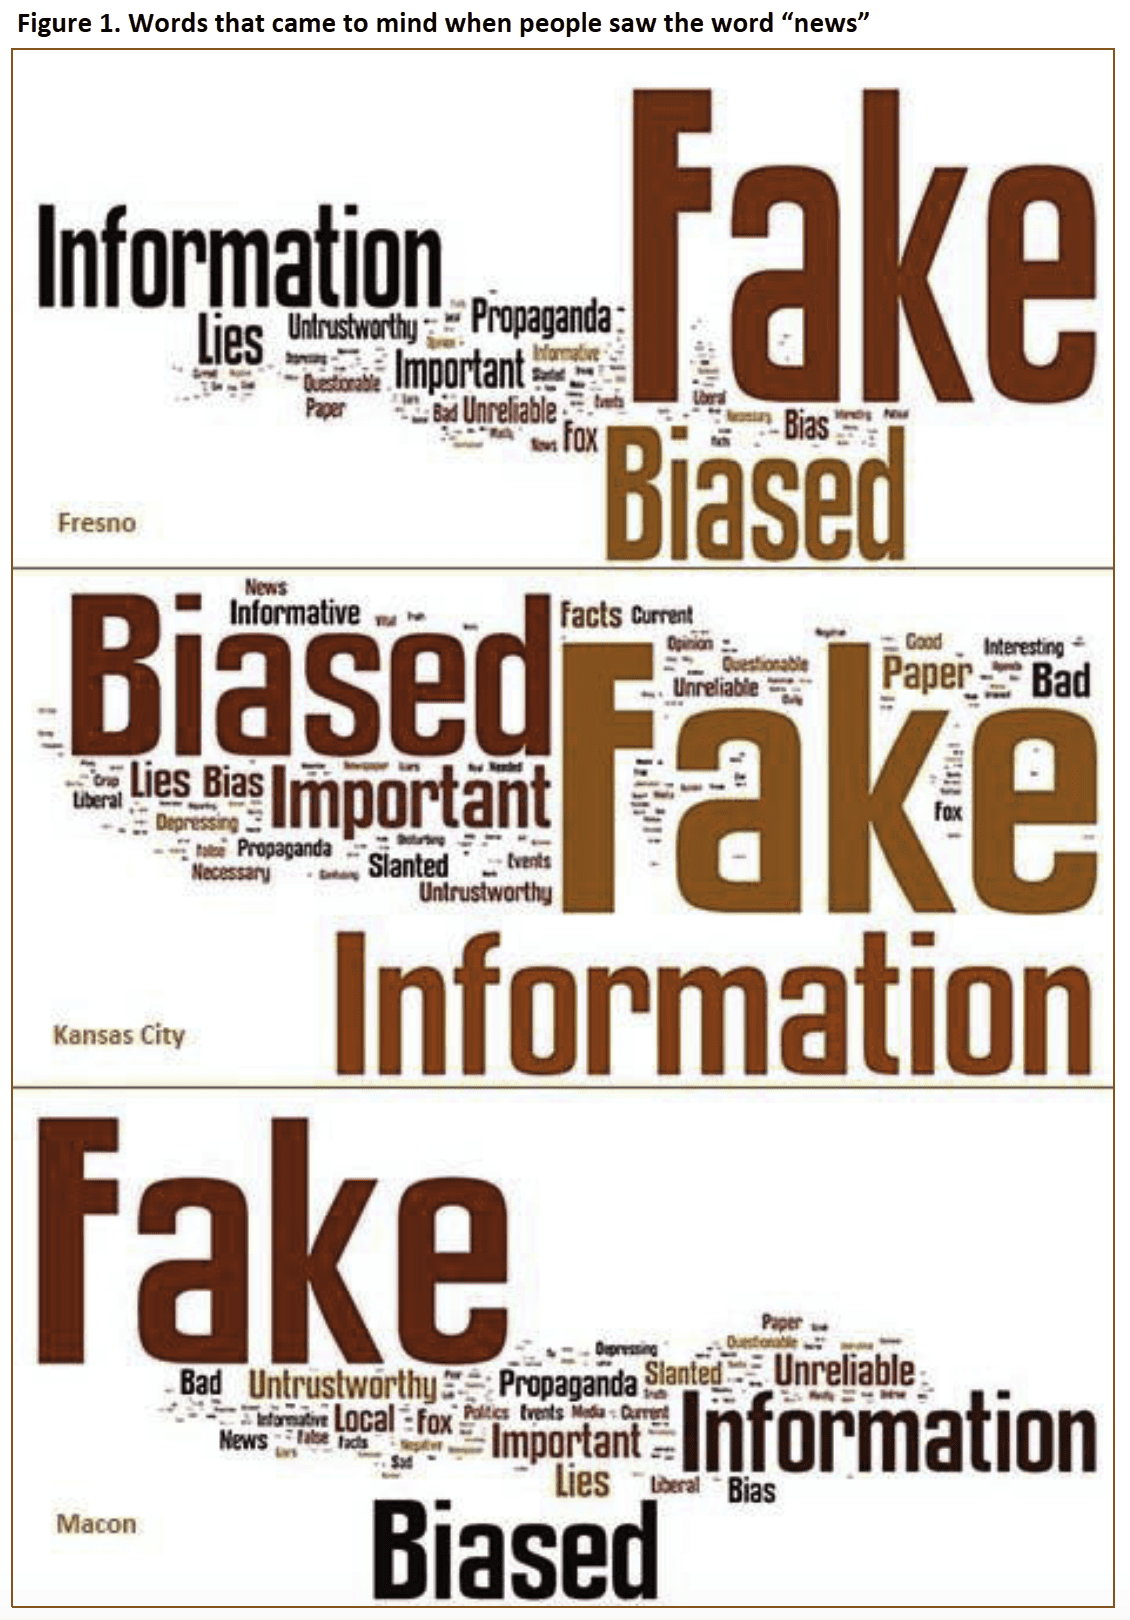
- “Fake” was the first word that came to mind for many people when they saw the word “news,” but not for “local news” or their local newspaper.
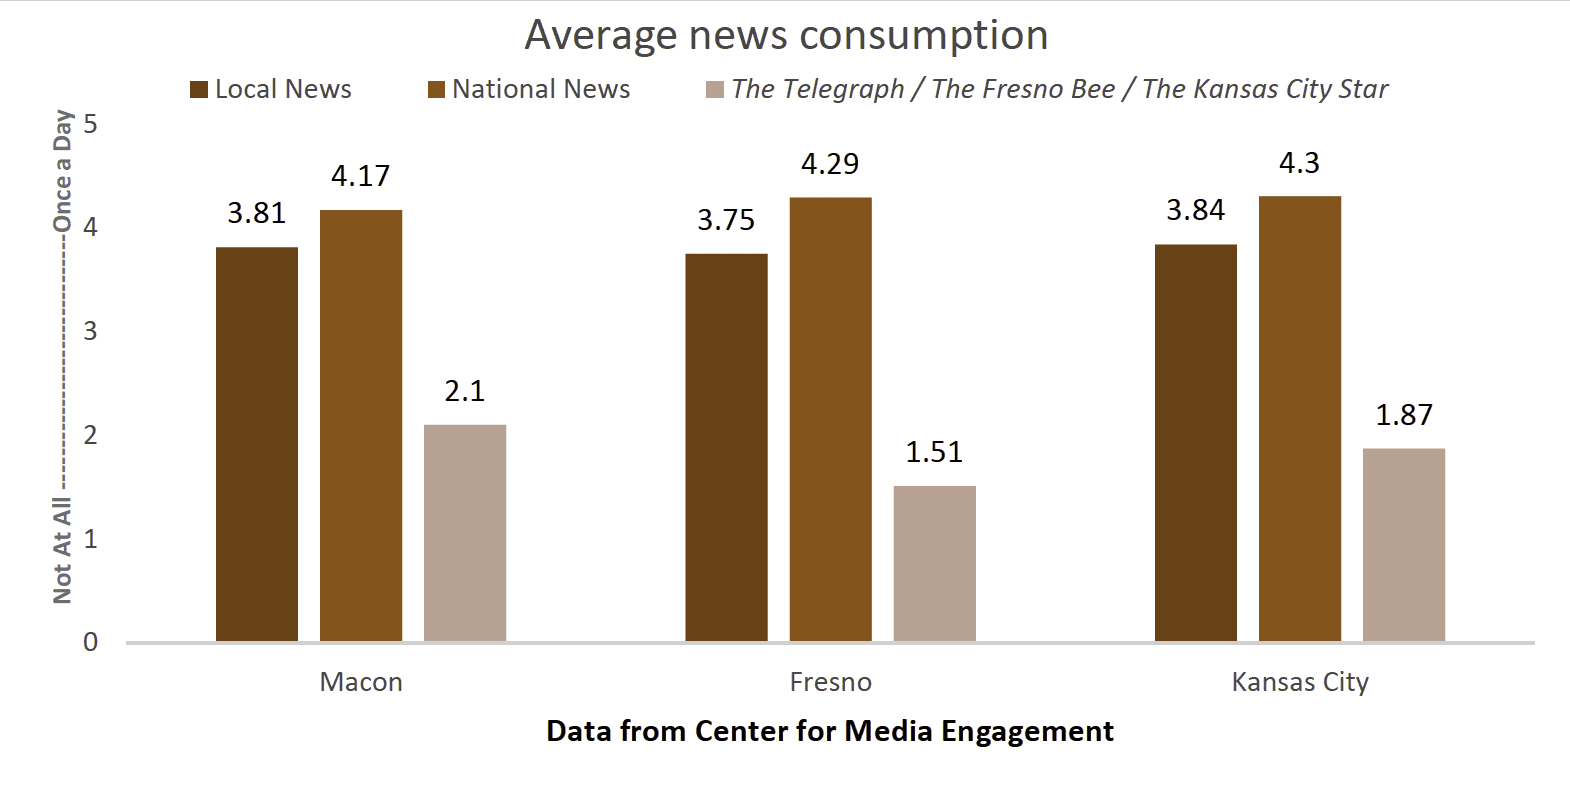
- On average, participants said they consumed national news about once a day, but they consumed news from their local newspaper much less often.
- Participants thought it was relatively easy to tell the difference between opinion and news. But, when we tested this idea, we found that only about half the participants could correctly spot a news story (compared to an opinion piece, analysis, or sponsored content).
- Nearly 90% of participants reported they were at least somewhat confident they could spot “fake news” when they saw it. However, when we showed them real and fake headlines, less than three-quarters of the people correctly selected the fake headline.
- On average, people rated their local news organizations as not very credible, trustworthy, balanced, fair, or transparent. Average scores were 3 or lower on a 5-point scale, where 5 was the most positive rating.
- People also rated their local news organizations poorly for how much they engaged with their communities. Average scores were lower than 3 on a 5-point scale, where 5 was the most positive rating.
Implications for Newsrooms
While the survey respondents had better impressions of local news than news in general, their opinions of the specific news organizations were slightly more negative. They also get news from the three outlets less often than national news media or local news media in general. It was striking that the word “fake” came to mind so readily when respondents were presented with the word “news.” However, “fake” was not the word that came to mind for local news or for the specific news outlets.
Among potential criticisms the respondents seemed to have about the news is they saw it as biased and lacking transparency. They also did not seem to feel the news organizations engaged with them, and they felt low trust for the news organizations.
People generally expressed confidence in their ability to find information online and to figure out if an online news story is credible. They also report frequently checking the accuracy of a story by looking at what news organization published the story and gathering information from other sources before sharing the story. However, close to half of all participants said they had accidentally shared a false story in the past. Also, more than a fourth of participants in each survey were unable to correctly pick out a fake news headline.
The Study
News Consumption
Respondents were asked to rate their news usage on a 1 (not at all) to 5 (more than once a day) scale separately for local news, national news, and their local news organization. Most survey participants said they consumed national news on average about once a day and local news in general slightly less often. However, participants got news from the three local outlets much less often – on average once a week or less frequently.
What Comes to Mind When You Think About News?
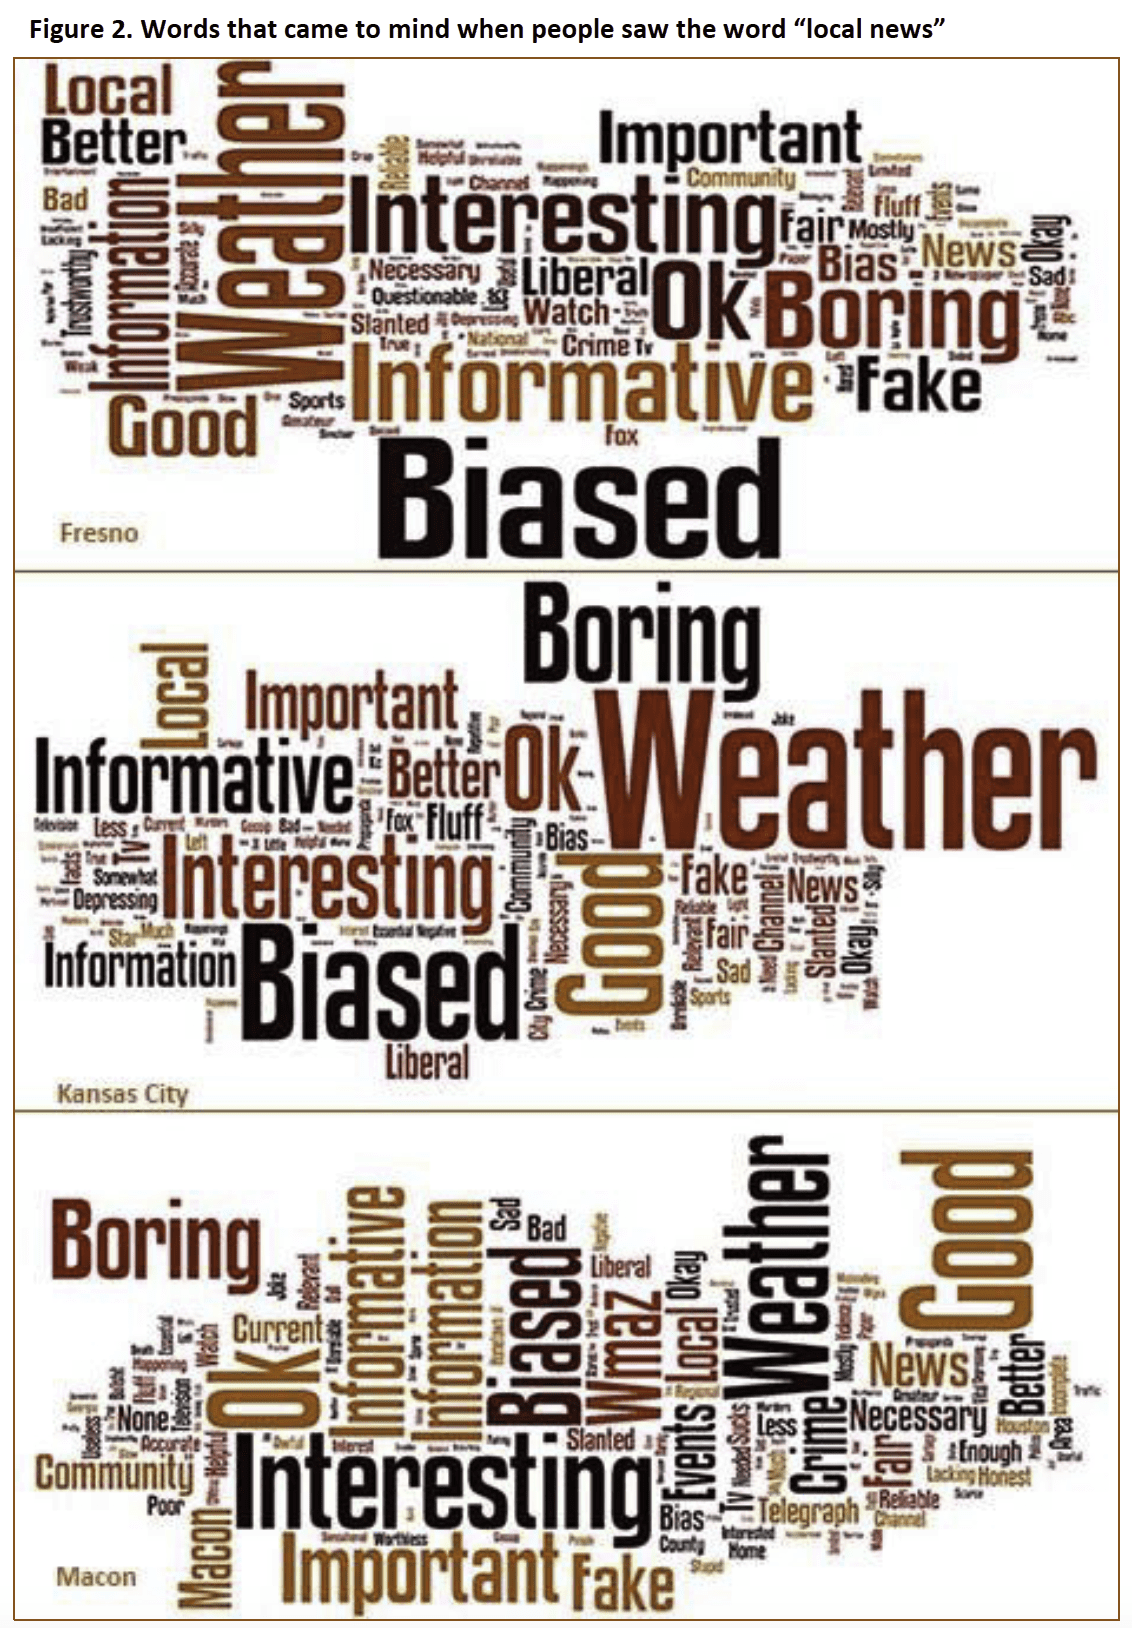
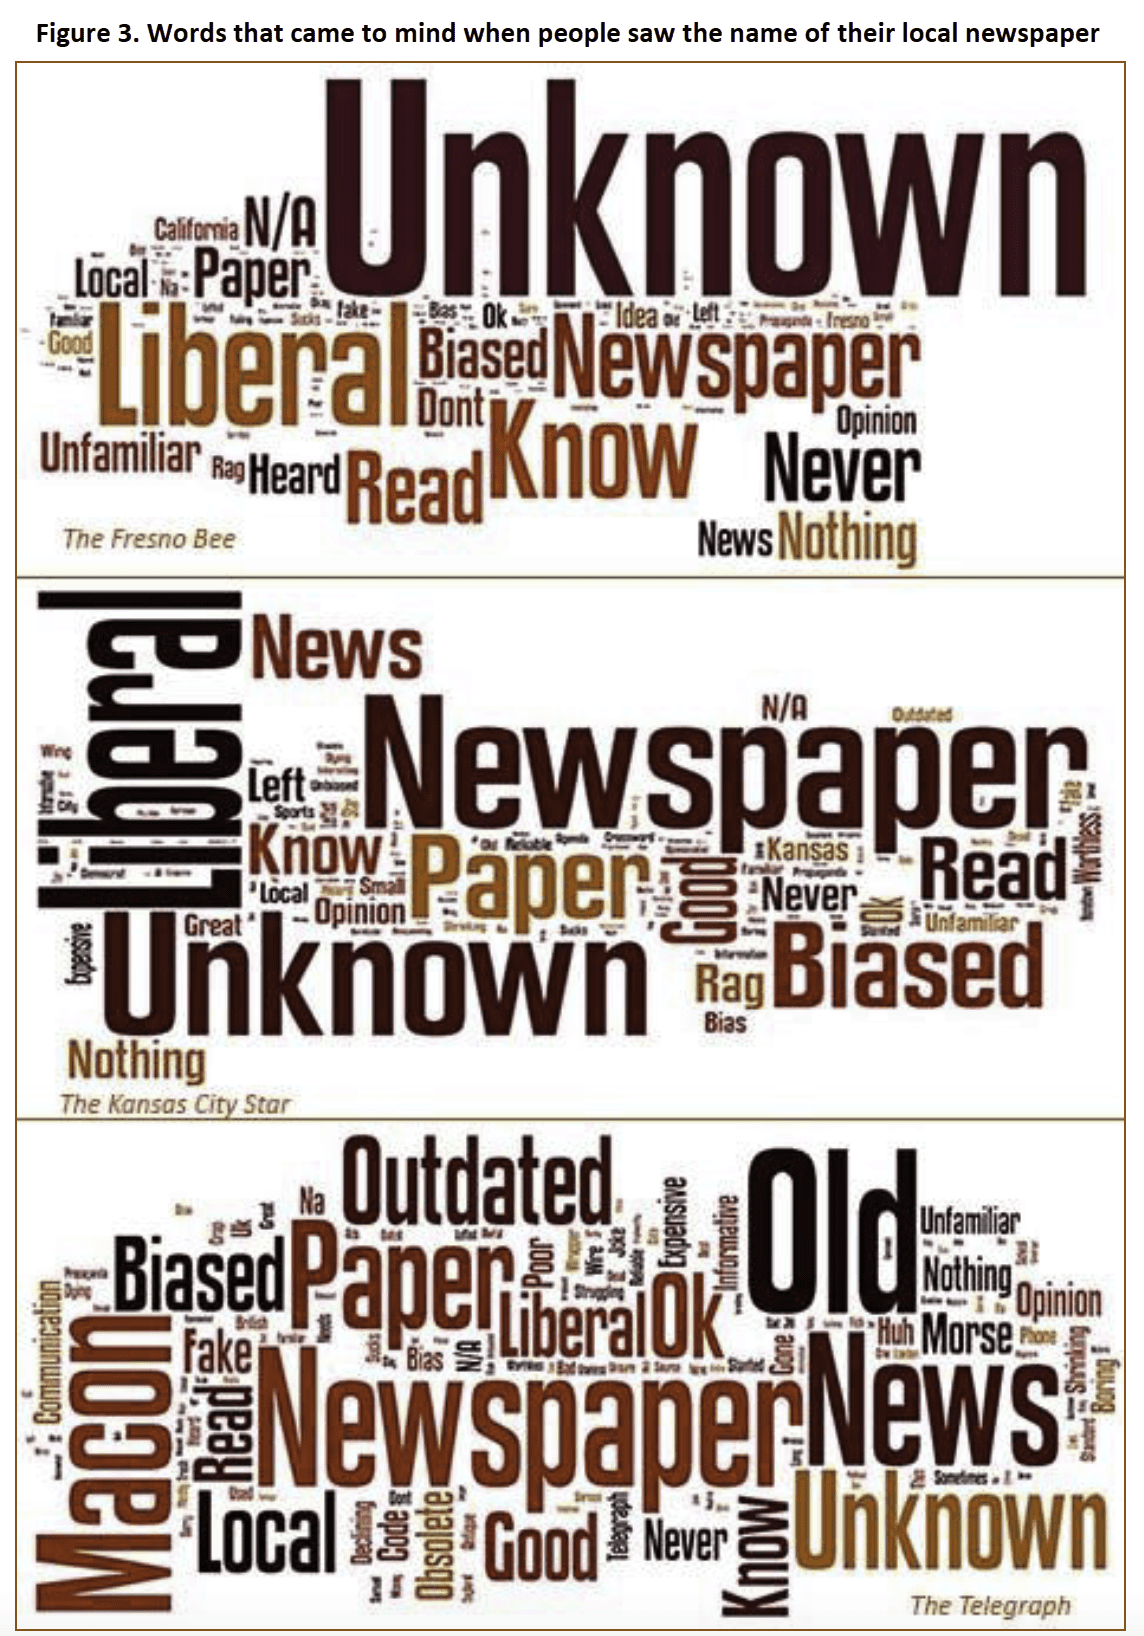
We asked respondents to write down the first word that came to their minds when we showed them three terms: news, local news, and the name of their local news organization (e.g. The Fresno Bee for Fresno survey takers; The Kansas City Star for those taking the Kansas City survey; and The Telegraph for those completing the Macon survey). “Fake” was overwhelmingly the most common response in all three surveys for the term “news.” For “local news,” positive words like “community” and “good” and negative words like “biased” and “boring” were prevalent. When thinking of the individual local news outlets, “newspaper” was common. The Telegraph also elicited “outdated,” and The Fresno Bee and The Kansas City Star drew the word “liberal.” Figures 1, 2, and 3 on the next three pages show word clouds for each of the three terms with larger-sized text to indicate more frequently used words.
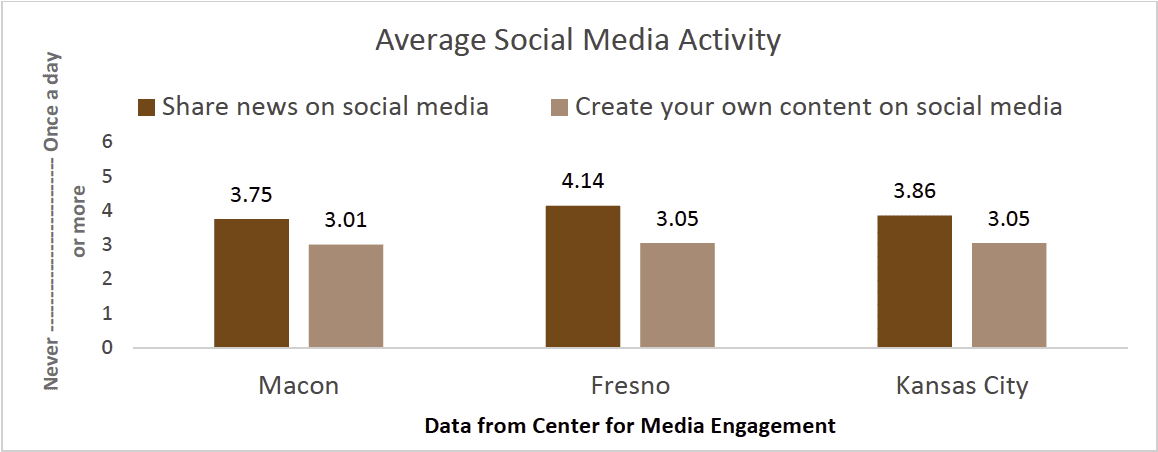
Sharing News on Social Media
We asked respondents to rate how often they share news and create their own content on social media on a scale of 1 (never) to 6 (once a day or more often). Results were fairly consistent across all three cities. On average, respondents reported sharing news on social media about once a week. They were less likely to create their own content on social media, with an average of about once or twice a month.
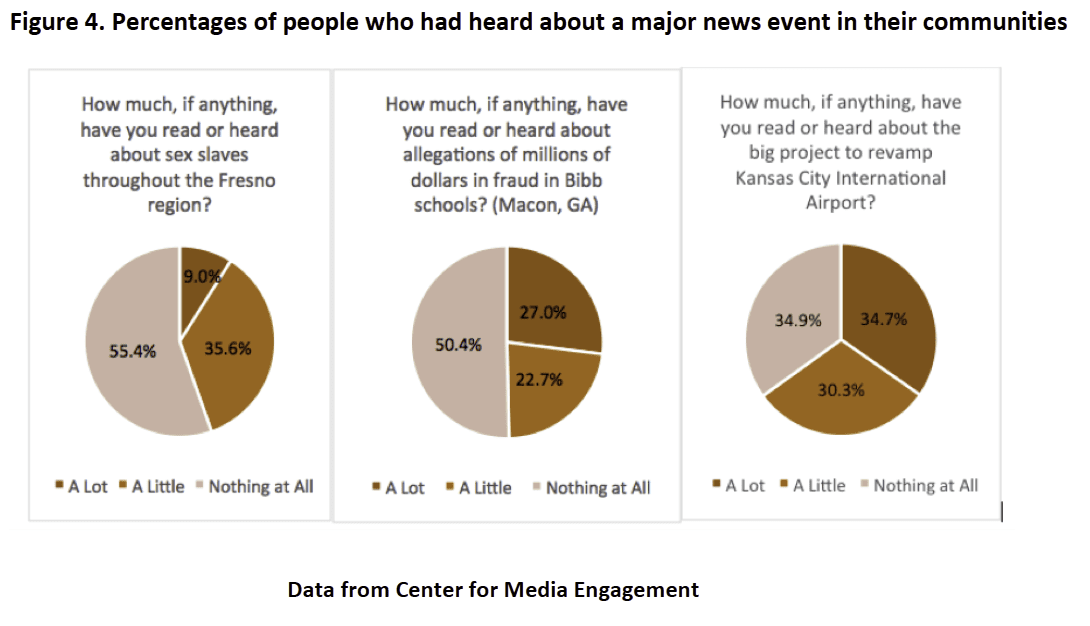
Knowledge About Major News Events
Respondents were asked how much, if anything, they knew about a major news event in their communities. Each of the news organizations had provided a news event that they covered extensively for this question. For the Kansas City survey, responses were about evenly divided into thirds between those who had heard a lot, a little, or nothing at all about the Kansas City Airport project. More than half of the respondents in the Fresno survey (55.4%) and Macon survey (50.4%) had heard nothing at all about their news topics, and only 9.0% in Fresno reported that they had heard a lot about it (Figure 4).
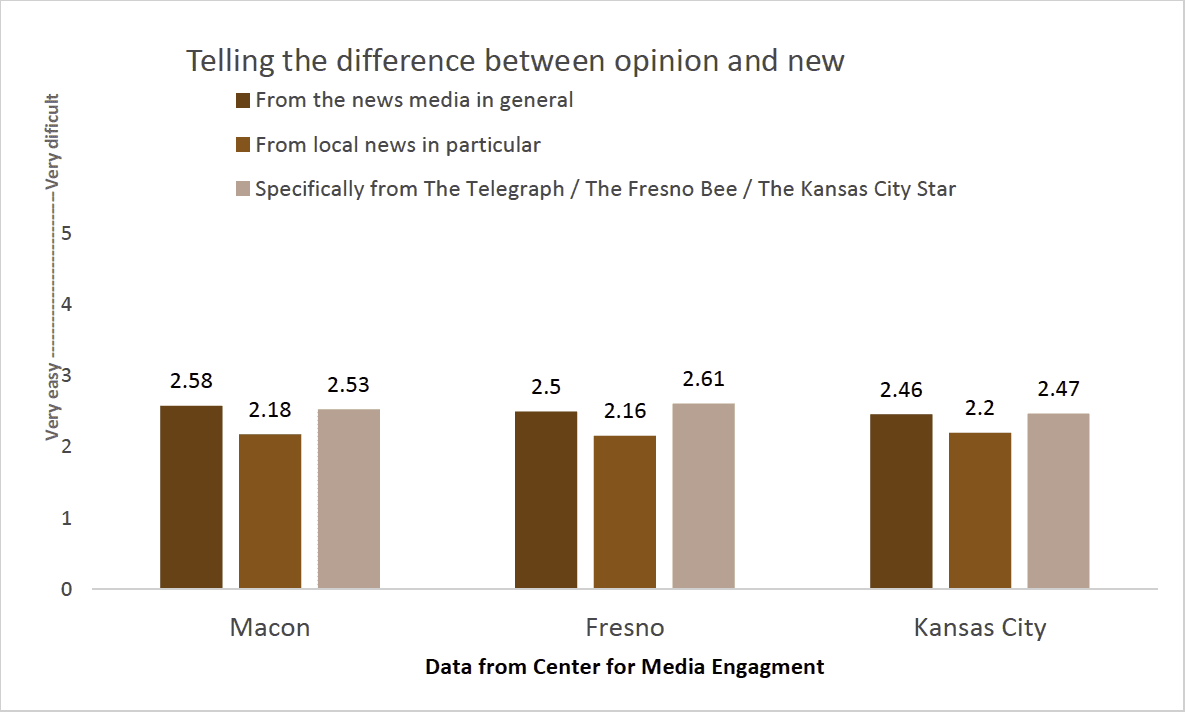
Telling the Differences Between Types of Stories
Respondents were asked to share how easy it was for them to tell the difference between opinion content and news reporting on a scale of 1 (very easy) to 5 (very difficult) for the news media in general, local news media, and each of the three regional outlets. Results from all three surveys showed that participants thought it was the easiest to distinguish between news reporting and opinion content for local news in particular, with the average being 2.18 for Macon, 2.16 for Fresno and 2.20 for Kansas City. Respondents said that it became slightly harder to tell the difference when consuming The Telegraph, The Fresno Bee, The Kansas City Star, or the news media in general, with the averages rising closer to 3 (neither difficult nor easy).
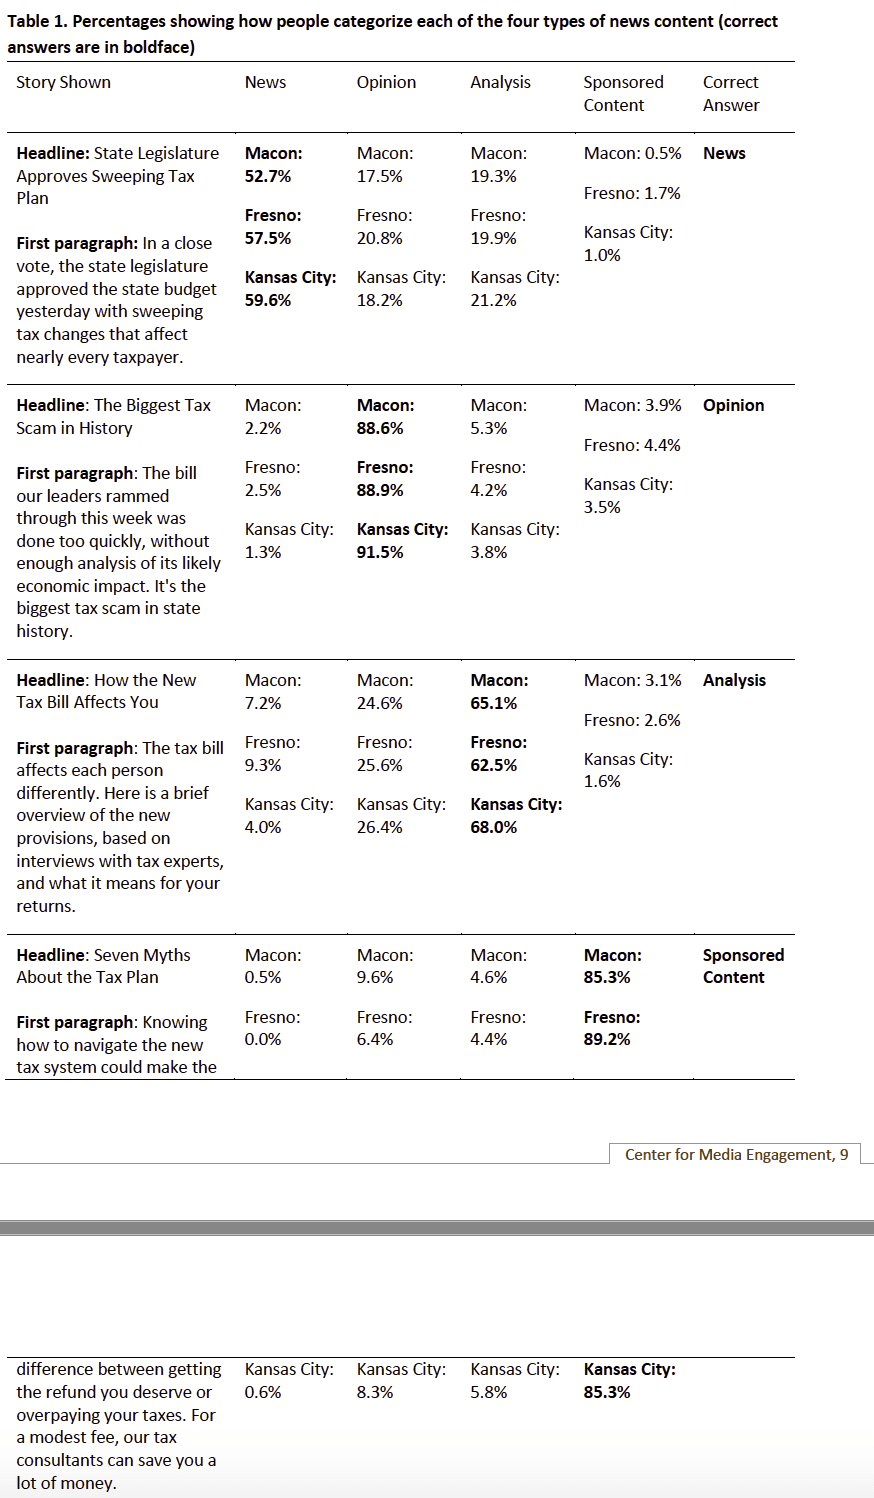
We also tested whether people could tell the difference between four types of news content – news stories, opinion pieces, analysis, and sponsored content – based only on the headline and the lead paragraph. People were randomly assigned to one of four headlines and leads and asked which type they thought the content was. Over 85% of participants were able to correctly identify the sponsored content and opinion pieces. About two thirds correctly recognized the analysis piece. Participants had the most difficulty identifying news content, with about half of participants correctly identifying it. Table 1 shows percentages of how people categorized each of the four types of news content.
Awareness of “Fake News”
Respondents expressed some confidence in their ability to figure out if online information was correct and reliable, with average responses ranging from 3.76 in Macon to 3.77 in Kansas City, to 3.83 in Fresno on a 1 (strongly disagree) to 5 (strongly agree) scale. Using the same scale, participants rated whether they gather ideas from several news sources to get a full picture when they are interested in a topic. Average scores ranged from 3.92 in Macon, to 4.01 in Kansas City and 4.03 in Fresno.
However, more than half of participants from the Fresno survey (53.4%) said they had shared a news story online and later discovered it were untrue. Slightly less than half in Macon (47.7%) and in Kansas City (47.6%) said the same.
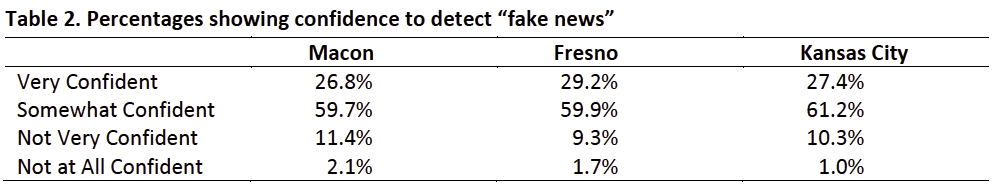
Yet, respondents from all three surveys expressed at least some confidence in their ability to recognize a fake news story. More than a fourth of respondents said they were very confident and more than half said they were somewhat confident. Very few people reported being not at all confident in their ability to spot a made-up article. Table 2 shows these percentages.
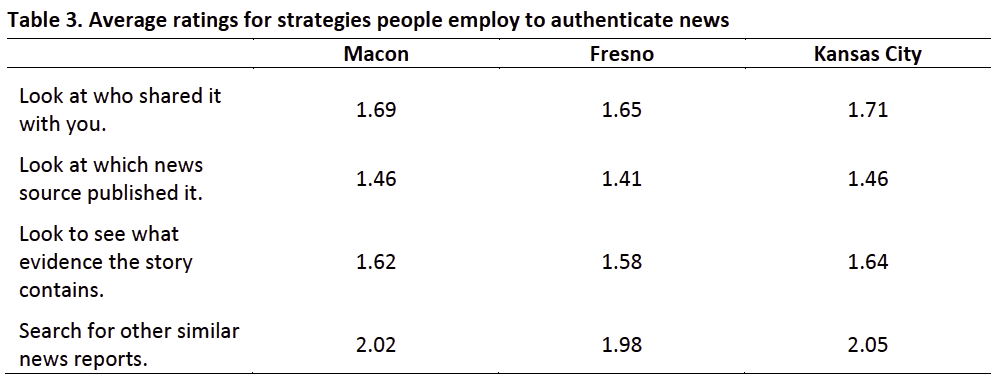
Respondents rated how often they take certain actions when verifying the authenticity of a news article on a scale of 1 (all of the time) to 5 (never). The most consistently used strategy was to look at which news source published the story, with the average response being 1.46 in Kansas City and Macon and 1.41 in Fresno. Respondents from all three surveys also said they looked at who shared the story with them and what evidence the story contained all or most of the time to assess the authenticity of stories. Respondents reported being somewhat less likely to always search for other similar news reports, although on average they still reported doing so most of the time. Table 3 on the next page shows these averages.
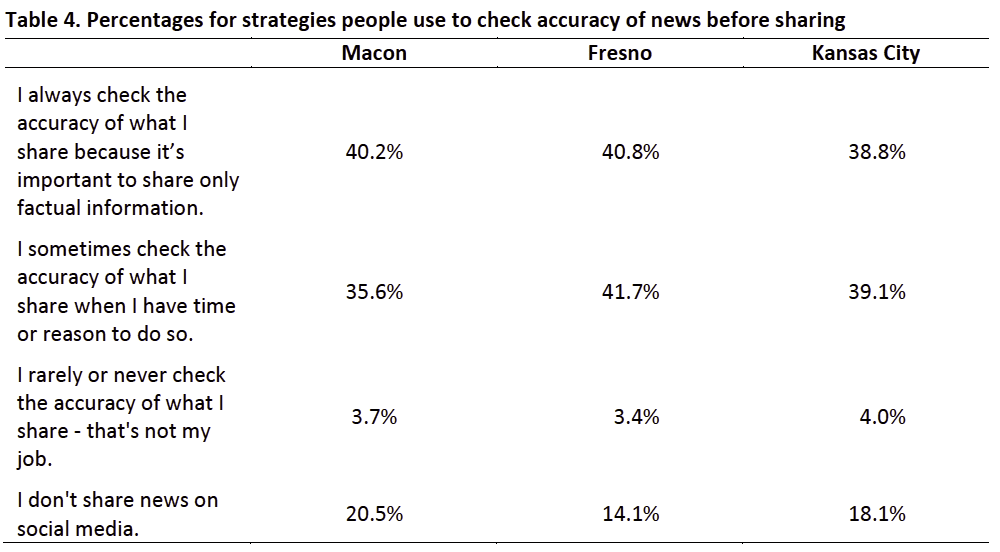
Respondents were then presented with a list of four statements about how often they check the validity of a story before sharing it and asked to choose the one that most accurately described them. The majority of participants from all three surveys said they always or sometimes check the accuracy of what they share. A significant portion also said that they never share news on social media. Of the people who do share online news, only 3.7% in Macon, 3.4% in Fresno and 4.0% in Kansas City said they rarely or never check the accuracy of the news they share. Table 4 shows these percentages.
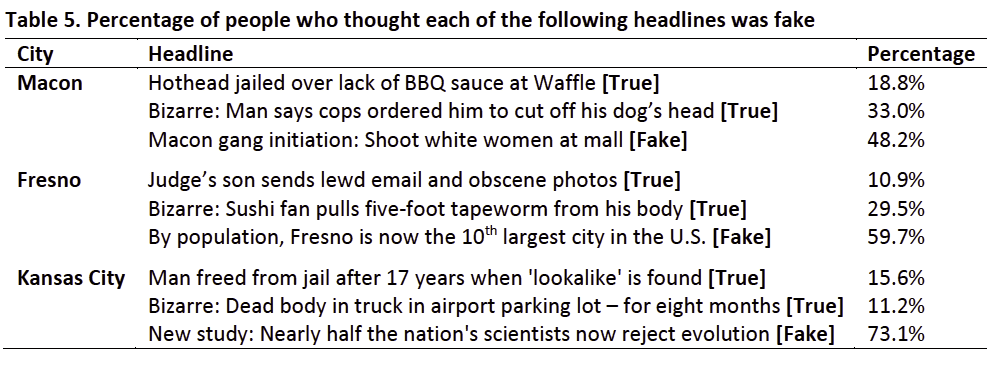
To help understand whether people could spot fake news, participants in each survey were shown three different headlines. One of them was untrue, as noted in Table 5. More than half the respondents in the Fresno and Kansas City surveys correctly identified the fake headline. Respondents from Macon had more trouble identifying the fake headline. Table 5 on the next page shows percentages of people who thought each headline was fake.
Media Literacy
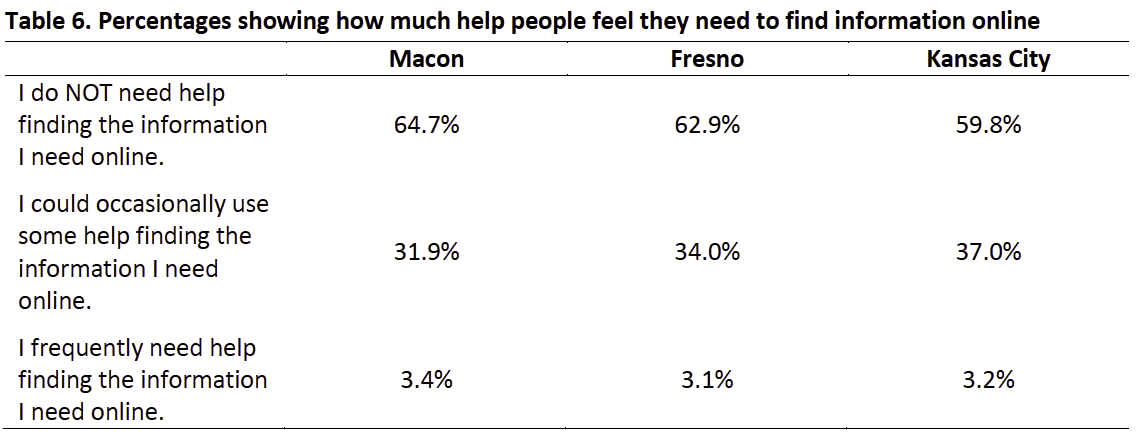
More than half of participants in all three cities’ surveys expressed full confidence in their ability to find the information they need online without outside assistance. Only slightly more than 3% of participants in each survey said they frequently required help when searching for information online. See Table 6.
Credibility and Trust
Respondents were presented with a series of nine positive statements designed to assess the level of connection and trust that the three local news outlets have with their community. Statements included “Cares about getting the facts right” and “Is concerned with my interests.” Participants rated each statement on a scale of 1 (strongly agree) to 5 (strongly disagree). Then the responses to all nine statements were averaged together. The resulting averages were 2.81 for The Telegraph, 2.83 for The Fresno Bee, and 2.77 for The Kansas City Star, demonstrating relatively low trust and connection between the news organizations and their communities.
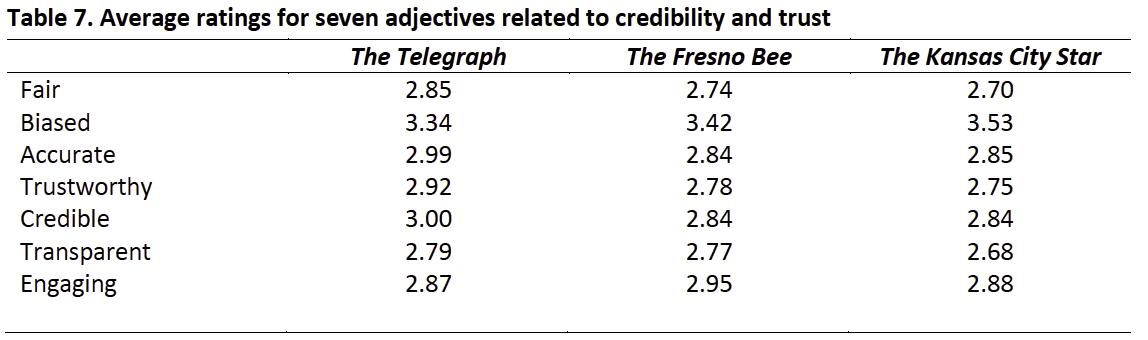
Respondents were also asked to rate their local news organization on a 1 (strongly disagree) to 5 (strongly agree) scale regarding how well seven adjectives that relate to credibility and trust described their local news outlet. The average responses for each adjective among the three local news outlets varied from 2.68 to 3.53. Across all three surveys, the lowest average was for the adjective “transparent,” and the highest was for “biased.” Of the three outlets, The Telegraph was rated the most favorably for all adjectives, with the exception of “engaging.” Table 7 shows these averages.
Methodology
We recruited participants for the experiment using by disseminated the surveys through Facebook between May 7 and June 8. Participants accessed the survey through a link, and then completed it on their own computers after consenting to participate. More than half the participants in the Macon and Kansas City surveys were from those geographic areas, although for the Fresno survey, only 29.2% of participants were either from Fresno or the surrounding area. About half the participants are female, and three-quarters are white. The bulk of the respondents are age 50 or older, and most had earned at least a bachelor’s degree. As far as political affiliation, more than a third of respondents for the Macon and Fresno surveys identified as Republicans, while the Kansas City survey has a larger proportion of those who considered themselves independents. In terms of income, most of the participants had annual household incomes between $50,000 and $150,000. See the demographics table in the full report.
SUGGESTED CITATION:
Murray, Caroline, Curry, Alex, Chen, Gina Masullo, and Stroud, Natalie Jomini. (2018, August). News awareness in Fresno, Kansas City, and Macon. Center for Media Engagement. https://mediaengagement.org/research/news-awareness-in-fresno-kansas-city-and-macon