

A broad, data-driven analysis of campaign coverage by the Center for Media Engagement and the American Press Institute shows how local, state, and federal elections are covered across the United States and what types of campaign coverage engage individuals.
The Center for Media Engagement partnered with the American Press Institute to examine local news coverage of the 2016 election primaries by eight newspapers across six states. We focused on news coverage of the “down-ballot,” or non-presidential, races that typically garner less media attention than the race for the White House but represent a significant bulk of election activity in the United States.
Using data from API’s Metrics for News (www.metricsfornews.com), an analytics tool that measures engagement in new ways and provides unique data-driven insights for publishers, we gathered hundreds of election-related stories to understand the characteristics of news that may influence audiences.
The Center for Media Engagement categorized 428 election-related newspaper stories from the websites of the eight news outlets, tracking mentions of issues, campaign strategy, and fact-checking, among other campaign coverage characteristics. We then correlated those factors with the Metrics for News data to see what kinds of coverage engage readers.
Key Findings
Among this report’s findings:
- Six in 10 articles examined contained at least one type of campaign strategy mention compared to 66% of articles that mentioned at least one campaign issue.
- ‘Strategy’ coverage of local elections prominently features campaign fundraising/spending and the competitiveness of the horserace.
- Increased campaign strategy coverage tends to get more page views, a potential challenge for those in journalism who want to encourage more issue-focused coverage.
- Within issue-focused coverage, public safety, education, and social issues are most referenced in down-ballot election news this year. Articles mentioning these top issues had similar page views, social referrals, and time on page compared to articles not mentioning these topics.
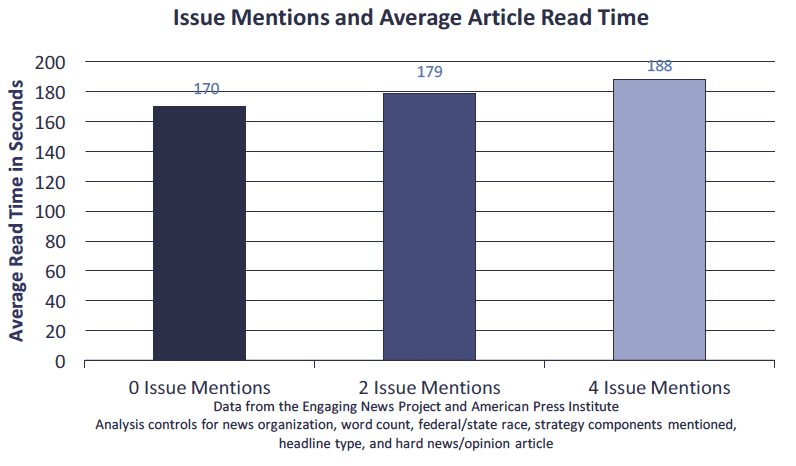
- The more issues an article mentions in total, the higher the average time on page. This result was true also after controlling for article length.
- The number of total issue mentions declined in news coverage as the primary election approached, another challenge for informing voters who may not pay attention until the late moments of a campaign.
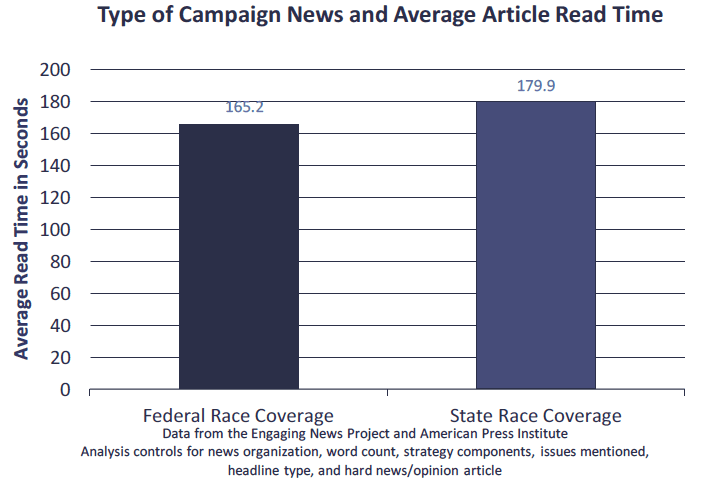
- Readers spent more time on stories focused on state and local campaigns, like those for governor or city council, than they did on stories of federal races, such as those for the S. Senate and House.
- Articles with clickbait-style headlines that withhold information seemed to backfire, getting fewer page views than articles with traditional headlines.
- The local election news we studied included relatively little fact-checking of campaign claims, but when it did, these articles were no more or less engaging than other campaign coverage.
The Study
Strategy Coverage, Such as Fundraising and Horserace References, Appears in Over Half of Articles
When covering an election, journalists choose a mix of two basic types of reporting — “voter guide” pieces that examine the issue positions and values of the candidates, and “strategy” pieces that analyze campaign tactics and who’s ahead in the race.
Observers often say that the voter guide approach is the higher journalistic purpose, while lamenting that much of the coverage instead focuses on the strategy — treating campaigns more like sports or entertainment rather than civic debates. Because of the prominent focus on candidate and campaign objectives and motivations, this type of coverage has been linked to political cynicism.1
This analysis finds evidence to support that concern — coverage of campaign strategy dominates local election news. Elements of campaign strategy, whether describing the actions that campaigns take like raising money or the state of the so-called ‘horserace,’ are a prominent feature of local election coverage.2 We looked at three indicators of campaign strategy: news mentions of public opinion polls, campaign-related fundraising and spending, and references to the competitiveness of candidates’ campaigns.
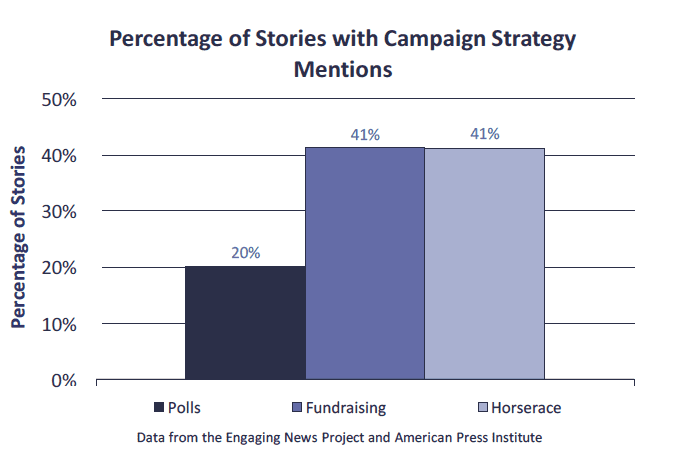
Of the news stories examined in this project, 60% contained at least one indicator of campaign strategy. Specifically, 28% of stories contained one of these strategy components, 21% contained two strategy components, and 11% contained all three strategy components.
As seen in the graph below, campaign-related fundraising and spending was featured in 41% of the news stories examined. Horserace references, specifically whether a campaign had a frontrunner, underdog, or was “tightly contested,” appeared in 41% of the stories. Explicit references to public opinion polls associated with a particular campaign were found in 20% of news stories.
Although the modern fixation with the political horserace coincides with the first media organization- sponsored public opinion polls in the 1970s, newspaper stories dating to the 1800s include journalist discussion of the “likely” outcomes of campaigns.3 Compared to European nations like Germany, Spain, and Sweden, the news in the United States is more likely to focus on the election horserace.4
Campaign Strategy Coverage Related to Increased Page Views
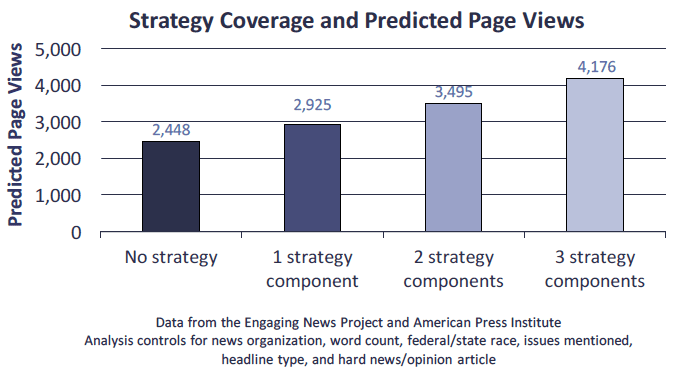
We looked at whether campaign strategy mentions correlate with user engagement for local election news stories. Each story could have between zero and three strategy-related components tracked as part of this research (polls, fundraising, and horserace mentions). On average, each local election story contained 1.03 strategy components.
As the number of strategy components in a news story increased, so too did the page views associated with the news story.5 Strategy mentions did not influence social referrals or time on page.6
Public Safety, Education, and Social Issues Are Most Mentioned Topics; User Engagement Consistent Across These Topics
Another critical, though sometimes less prominent part of election news reporting, is the amount of coverage devoted to issues. Issue coverage is important in that it can influence which issues people consider to be important, a pattern known as agenda setting.
Although news outlets historically have an important agenda-setting influence in American campaigns, the amount of issue coverage often is dwarfed by or mixed with mentions of campaign strategy.7 As communication researchers Joseph Cappella and Kathleen Hall Jamieson explain about news coverage of presidential campaigns, the balance of news coverage has shifted from stories mentioning public issues “to ones that emphasize who is ahead and behind, and the strategies and tactics of campaigning necessary to position a candidate to get ahead or stay ahead.” 8 This research offers a perspective on the extent to which local news outlets mention issues discussed in the context of the campaign.
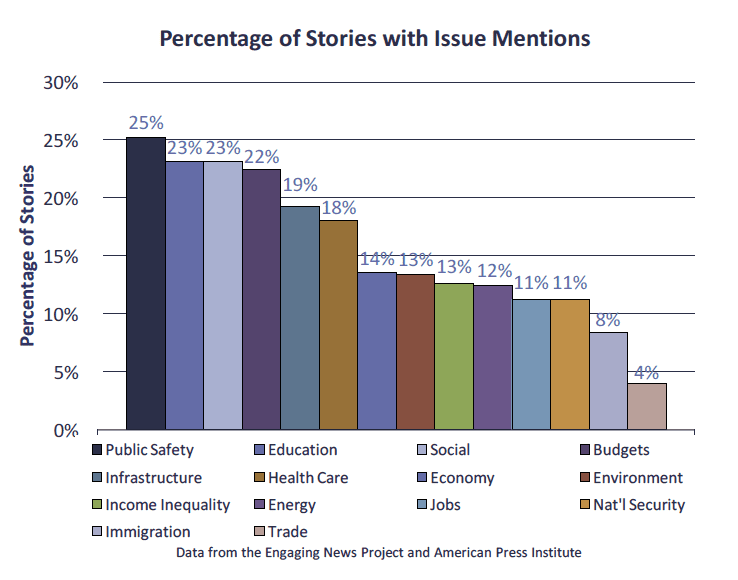
We evaluated whether each of the 428 election-related articles included in the analysis mentioned any of 14 different issues. Two-thirds of the news stories (66%) mentioned at least one issue. Across the news articles examined, 19% mentioned a single issue associated with the campaign, 12% mentioned two issues, and 11% mentioned three issues.
The top issue mentioned was public safety (25% of the news stories), which included mentions of guns, crime, and emergency response. The next most frequently mentioned issues were education (23%) and social issues, including abortion, LGBTQ matters, and women’s rights (23%). Taxes and budgetary issues were the next most prominently emphasized issue (22%). Trade was the least frequently discussed issue for which we coded; it was mentioned in only 4% of the articles.
We analyzed whether articles mentioning one of these top four issues (public safety, education, social matters, and budgets) were any more successful in terms of page views, time on page, or social referrals. We found articles mentioning any one of these issues yielded a similar number of page views, a similar number of social referrals, and a similar amount of read time compared to articles not mentioning these issues.9
News Coverage of Issues Declines As Election Approaches
The number of issues mentioned in election-related local news stories declined as the primary election approached. On average, a news story published 20 to 31 days prior to the election had almost 3 issue mentions compared to 1.5 issue mentions in news stories published zero to nine days prior to Election Day. This change over time is statistically significant.10

Time on Page Higher When More Issues Mentioned in the Article
We looked at whether the number of issues mentioned in an article correlated at all to audience engagement metrics such as time on page, social referrals, or page views.
Articles that mentioned more issues tended to receive greater time on page with readers. Each story could mention between zero and 14 issues as part of this research. On average, each local election story contained 2.18 issue mentions. As the number of issues mentioned in a news story increased, so too did the average time individuals spent with the corresponding article.11 As the number of issues mentioned increased by one in a news story, individuals stayed on the page 4.5 seconds longer. In our analysis, we control for the story word count, so this result cannot be explained by differences in the article length.
There was not a statistically significant relationship between issue mentions and other engagement metrics, including page views and social referrals.12
State and Local Campaign Coverage Sees Greater Time on Page Than Federal Race Coverage
Each story was classified based on whether it focused on a federal race (U.S. Senate or House) or a state-based race, including both statewide (e.g. attorney general) and local (e.g. mayoral) contests. Articles referencing state-related campaigns had a higher average time on page than articles that did not reference these types of campaigns. There was no significant effect of the type of race on the number of page views or social referrals the article received.13 As the graph below illustrates, an article referencing a state-based political race increased read time by 14.7 seconds.
Election Articles with Clickbait Headlines Have Fewer Page Views Than Traditional Headlines
The headline on each election news story was examined for whether it was a traditional headline or a question-oriented headline (sometimes called “clickbait” in more popular press, but we use it here in a neutral manner to mean a headline which attempts to create intrigue by posing a question or leading the audience to read forward). Approximately nine in 10 headlines coded (89%) were traditional headlines that serve to summarize the story. Articles with clickbait headlines had significantly fewer page views.14 As the graph below illustrates, articles with a clickbait headline (e.g. “Who will show up to vote on Election Day?”) saw 1,276 fewer predicted page views compared to articles with a traditional headline.

Fact-Checking is Rare in Local Election News Coverage
Local news stories also were examined for whether they were structured as fact-check articles, which explicitly referenced and evaluated campaign claims. We also analyzed whether the articles had veracity checks embedded within a news story that judged whether campaign claims were true or false.
A very small percentage of stories (2%) were framed as an official fact-check. A similarly small percentage of articles (6%) included the journalist issuing a veracity check of a claim. These veracity references included the news article mentioning something that may have been mistakenly, falsely, or truthfully stated. Official fact-check articles contained a similar number of issue mentions and strategy components compared to non-fact-check stories.
Given the relative infrequency of both of these article characteristics, we combined fact-checks and veracity checks into a single measure and evaluated whether their inclusion related to social referrals, time on page, or page views. We found that fact-checking articles performed about equally well in engagement as the vast majority of non-fact-checking articles.
Methodology
We examined 428 newspaper stories from the websites of eight local newspapers across six states (California, Florida, Idaho, Pennsylvania, Texas, and Washington). Only news articles focusing on 2016 non-presidential election campaigns, including federal (U.S. Senate, U.S. House), statewide (e.g. gubernatorial, Attorney General, Supreme Court, etc.), and local races (e.g. mayor, council, supervisors, school board, etc.), were analyzed as part of this project. We excluded articles on ballot and referenda campaigns. For each news outlet, we examined articles that were published in the month prior to each state’s primary election. The unit of analysis was each article.
We coded the characteristics of each news article:
- Relevance: We first coded whether news stories flagged as “political” by each newsroom were relevant to the purposes of this project by mentioning down-ballot political campaigns. Of 1,824 total stories that had anything to do with government or officials, 428 were relevant to elections (24%) and used for further analysis.
- Type: Whether the article reported hard news (78%) or integrated opinion (22%) in some manner (e.g. editorial, blog commentary, letter to the editor).15
- Campaign type: Whether the article referenced a federal (46%) and/or state-based (61%) campaign.
- Headline: Whether the article had a more traditional, summary headline (89%) or a clickbait-oriented headline (11%).
- Fact-check: Whether the news article was structured as a fact-check, including offering campaign claims with a subsequent journalist evaluation of the claims (2%).
- Veracity check: Whether the news article included the journalist’s own judgment related to a campaign claim (e.g. false, true, a mistake; 6%).
- Strategy coverage: We next examined the political strategy-related content in the news article, including whether public opinion/polling information (20%), fundraising or campaign spending information (41%), or horserace references (e.g. “favorite,” “frontrunner,” “underdog,” “sure loser,” “too close to call;” 41%) were present. We combined these references into one additive measure for political strategy (M = 1.03, SD = 1.02, Range = 0 to 3).
- Issue mentions: We coded for mentions of the economy in general (14%), jobs and unemployment (11%), budgetary matters (22%), income inequality and wages (13%), international trade (4%), energy (12%), national security (11%), immigration (8%), public safety (25%), health care (18%), education (23%), infrastructure and transportation (19%), the environment (13%), and social issues including abortion, LGBTQ rights, women’s issues, and drugs (23%). We combined these mentions into one additive measure for issue mentions (M = 2.18, SD = 46, Range = 0 to 14).
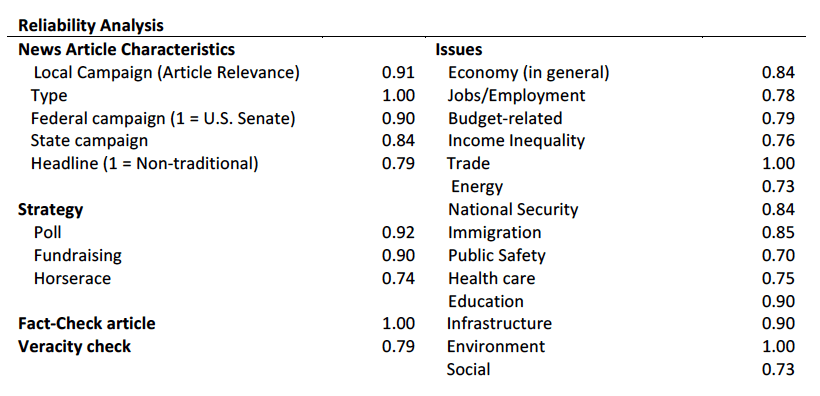
Before beginning coding, we conducted a reliability analysis on a minimum of 10% of the total sample of news stories to ensure that the team of five coders was correctly identifying campaign news features. We used Krippendorff’s alpha as a measure of reliability, where scores above 0.67 are considered acceptable.
SUGGESTED CITATION:
Scacco, Joshua, Hearit, Lauren, Potts, Lauren, Sonderman, Jeff, and Stroud, Natalie Jomini. (2016, October). Primary Election Coverage: What Types of News Engage Audiences. Center for Media Engagement. https://mediaengagement.org/research/election-coverage/
- Cappella, J. N., & Jamieson, K. H. (1997). Spiral of cynicism: The press and the public good. New York, NY: Oxford University Press. [↩]
- Aalberg, T., Strömbäck, J., & de Vreese, C. H. (2011). The framing of politics as strategy and game: A review of concepts, operationalizations and key findings. Journalism, 13(2), 162-178. doi:10.1177/1464884911427799.; Dunaway, J., & Lawrence, R. G. (2015). What predicts the game frame? Media ownership, electoral context, and campaign news. Political Communication, 32(1), 43-60. doi:10.1080/10584609.2014.880975.; Strömbäck, J., & Dimitrova, D. V. (2006). Political and media systems matter: A Comparison of election news coverage in Sweden and the United States. The Harvard International Journal of Press/Politics, 11(4), 131-147. doi: 10.1177/1081180X06293549. [↩]
- Sigelman, L., & Bullock, D. (1991). Candidates, issues, horse races, and hoopla presidential campaign coverage, 1888-1988. American Politics Quarterly, 19(1), 5-32. doi:10.1177/1532673X9101900101 [↩]
- Aalberg, Stromback, & de Vreese (2011); Stomback & Dimitrova (2006) [↩]
- In two regression models predicting story page views and social referrals (with controls for the news outlet, article word count, type of article, campaign race type, headline type, and issue mentions), strategy mentions significantly increased the number of page views (B=.18 SE=.07; p<.05), but did not influence social referrals (B=.06 SE=.11; p=.59). The dependent variables – page views and social referrals – were modeled using negative binomial regression. We note that using a dichotomized value for strategy (0, 1) also has a significant effect on page views (B=.31 SE=.15; p<.05). [↩]
- In an OLS regression model predicting average time on page with a news story (with controls for the news outlet, article word count, type of article, campaign race type, headline type, and issue mentions), strategy mentions did not significantly affect time on page (B=.01 SE=.06; p=.91). [↩]
- Lawrence, R. G. (2000). Game-framing the issues: Tracking the strategy frame in public policy news. Political Communication, 17(2), 93-114. doi:10.1080/105846000198422.; McCombs, M. E., & Shaw, D. L. (1972). The agenda-setting function of mass media. Public Opinion Quarterly, 36(2), 176-187. doi:10.1086/267990 [↩]
- Cappella & Jamieson (1997, p. 33) [↩]
- In three separate regression models predicting the number of page views, average time on page with a news story, and social referrals (with controls for the news outlet, article word count, type of article, campaign race type, headline type, and strategy mentions), mentions of budgetary, public safety, education, and social issues do not significantly predict these engagement metrics. Coverage of budget and tax issues has a marginally significant influence on average read time (B=.29 SE=.16; p<.10). The dependent variables – page views and social referrals – were modeled using negative binomial regression. [↩]
- The number of issues mentioned differed significantly across time, F(2, 423)=12.49, p<.01. A Games-Howell post hoc comparison reveals that the average number of issues mentioned zero to nine days (M=1.54) and 10 to 19 days prior to the election (M=2.44) differed significantly (p<.01). The average number of issues mentioned zero to nine days (M=1.54) and 20 to 31 days (M=2.87) prior to the election differed significantly (p<.01). There were no significant differences between issue mentions 10 to 19 days and 20 to 31 days prior to the election (p=.41). These results are affirmed when the number of issue mentions are regressed in two negative binomial regression models with controls for the news outlet, article word count, type of article, campaign race type, strategy mentions, and a continuous or ordinal-level (1, 2, 3) treatment of the time variable. [↩]
- In an OLS regression model predicting average time on page with a news story (with controls for the news outlet, article word count, type of article, campaign race type, headline type, and strategy mentions), the number of issue mentions significantly increased time on page (B=.08 SE=.03; p<.01). We note that using a dichotomized value for issue mentions (0, 1) has a marginally significant effect on read time (B=.23 SE=.12; p<.10). [↩]
- In two regression models predicting story page views and social referrals (with controls for the news outlet, article word count, type of article, campaign race type, headline type, and strategy mentions), the number of issue mentions did not significantly affect page views (B=-.04 SE=.03; p=.23) or social referrals (B=.01 SE=.05; p=.80). The dependent variables – page views and social referrals – were modeled using negative binomial regression. We note that using a dichotomized value for issue mentions (0, 1) has a significant, negative effect on page views (B=-.35 SE=.16; p<.05), meaning that any mention of issues reduced the overall number of page views to a news story. [↩]
- In an OLS regression model predicting average time on page with a news story (with controls for the news outlet, article word count, type of article, headline type, strategy mentions, and issue mentions), state-based political campaigns significantly increased the time on page (B=.25 SE=.12; p<.05). In two regression models predicting story page views and social referrals (with controls for the news outlet, article word count, type of article, headline type, strategy mentions, and issue mentions), state-based political campaigns did not influence the number of page views (B=.17 SE=.15; p=.28) or social referrals (B=.08 SE=.23; p=.72). The dependent variables – page views and social referrals – were modeled using negative binomial regression. [↩]
- In two regression models predicting story page views and social referrals (with controls for the news outlet, article word count, type of article, campaign race type, strategy mentions, and issue mentions), clickbait headlines significantly reduce the number of page views (B=-.57 SE=.22; p=.01), but have no influence on social referrals (B=-.37 SE=.31; p=.24). The dependent variables – page views and social referrals – were modeled using negative binomial regression. In an OLS regression model predicting average time on page with a news story (with controls for the news outlet, article word count, type of article, campaign race type, strategy mentions, and issue mentions), headline type had no effect on read time (B=.19 SE=.18; p=.30). [↩]
- We include the type of news article as a control in our regression analyses of story page views, average time on page, and social referrals. Only in the case of page views does a hard news article contribute to a greater amount of story views (B=.40 SE=.17; p<.05). [↩]