


The Center for Media Engagement took a snapshot of the stories local newspaper and broadcast news outlets posted to Facebook on March 23, 2020. On the same day, we launched a survey asking people what information about the coronavirus (COVID-19) pandemic they wanted local news outlets to share.
Key Findings
We found that the topics people thought were most important for local news to cover were local health updates and information about local entities that provide critical services, such as hospitals, grocery stores, and local government.
When it came to the coverage newsrooms provided, we found that posts about how local government was responding to the virus and how local businesses were responding to or affected by the virus were most common.
For many coronavirus-related topics, local newsrooms provided the public with the information they rated as most important. There were some differences, however. For example, audiences rated “what local businesses are doing in response” to the coronavirus as slightly less important than several other topics, yet the topic was frequently covered in newsrooms’ posts.
Overall, we found that newsrooms dedicated many of their Facebook posts to coronavirus, a topic viewed as highly important by the public and one that garnered more Facebook engagement than other topics.
The Coverage People Want From Local News
In a survey about what information people want from local news organizations, the top priorities were local health updates and information about local entities that provide critical services in people’s day-to-day lives.
Local health topics rated as highly important included how to get tested, who can get tested, and the availability of tests in one’s local area; what to do if you have symptoms; the number of local people testing positive for coronavirus; and the number of local deaths from coronavirus.
People also wanted information about critical services in their day-to-day lives, such as how hospitals, grocery stores, and local governments were responding to coronavirus; what local and state restrictions were in place; and fact checks of misinformation circulating in the local area and state.
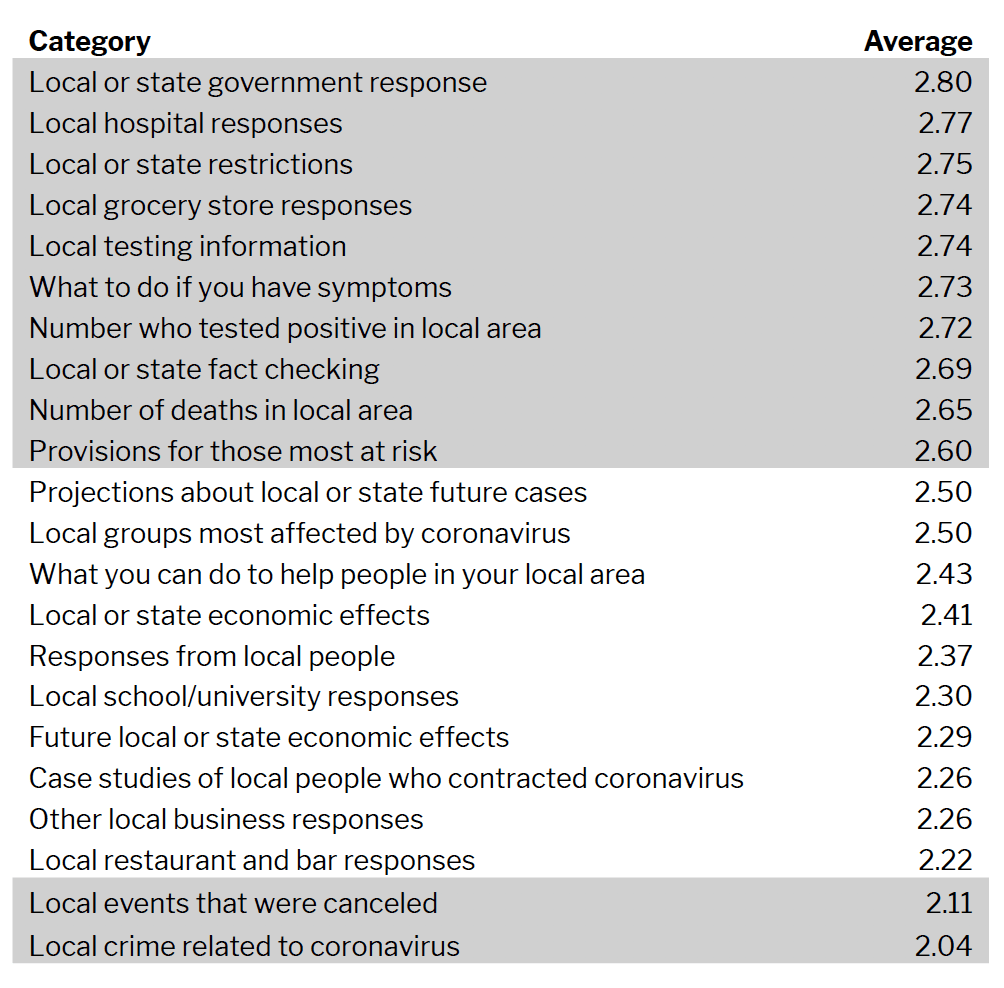
In our survey of 999 people on March 23-24 of 2020, respondents were asked, “As of today, how important is it to you that your local news organizations share coronavirus information about”: and were then given a list of 22 different topics. They were asked to respond from “not very important” (0) to “very important” (3). Average responses for all of the items we asked about varied between “very important” (3) and “somewhat important” (2).1 Three clusters appeared, included in the table below and ranked by importance:
The Coverage Local Newsrooms Provided On Facebook
Unsurprisingly, coronavirus coverage was the most prevalent topic among local news’ Facebook posts and garnered more audience engagement (likes, comments, and shares) than posts about other topics. When looking only at the posts that covered coronavirus, we found that 65% focused on local information. Given that survey-takers valued local information highly, newsrooms might want to consider focusing even more on local angles that will not be covered by national news outlets.
When we compared the most-covered local coronavirus topics to the categories people rated as most important, we found that:
-
Two of the most frequent types of Facebook posts made by news organizations – how local and state government was responding to the coronavirus and the number of people who tested positive – were also rated as highly important by survey respondents. In this respect, it is clear that local media are helping to meet community information needs.
-
Two other frequent types of Facebook posts made by news organizations – how local businesses were affected by or responding to the virus and the economic effects of the virus – were rated as less important by audiences compared to several other categories. Based on the survey results, audiences crave greater emphasis on local health and how people can function in their day-to-day lives.
In terms of Facebook likes, comments, and shares, we found that posts about health information earned the most audience engagement. Stories about what to do if someone displayed symptoms got the most likes and shares. Local and state government response to the virus and information about local deaths, local testing, local hospitals, and local grocery stores also did well.
Government and Business Coverage Was The Most Common
-
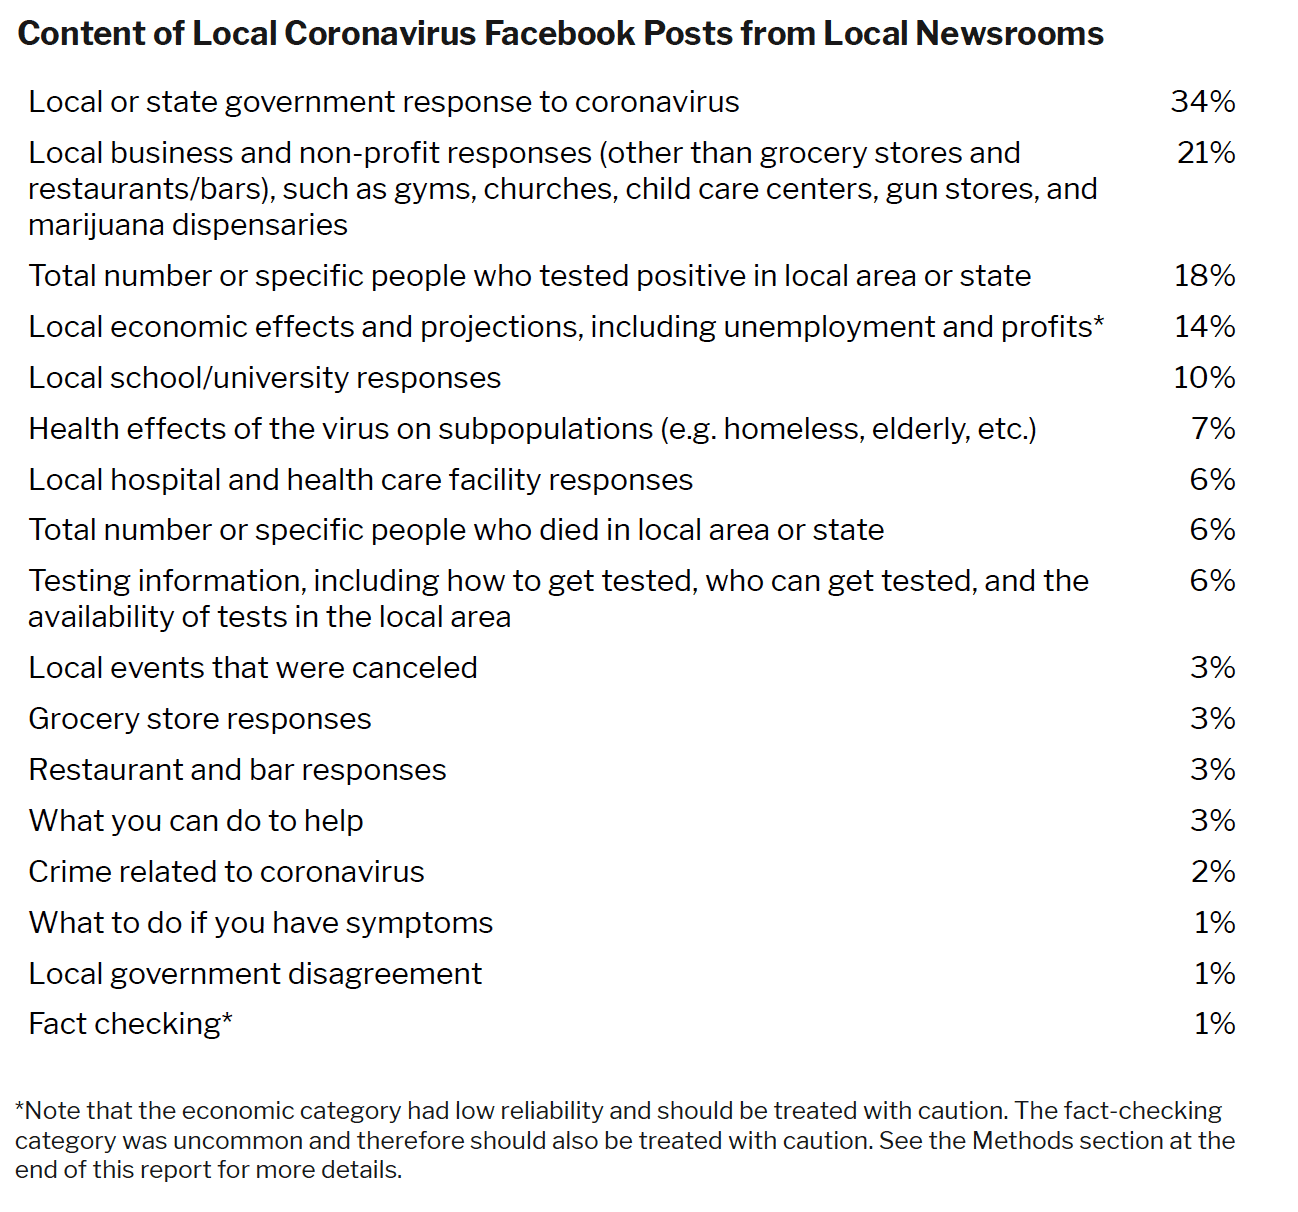
How local and state governments were responding to the coronavirus dominated local coronavirus Facebook posts; 34% of all posts included this information, many of them referencing restrictions and stay-at-home orders.
-
Responses from and information about local businesses were prevalent among local news Facebook posts; 25% of posts covered this topic, which included information about local grocery stores (3%), local restaurants and bars (3%), or other local businesses or non-profits, such as gun stores and churches (21%).
-
New cases of coronavirus, including posts about people who tested positive and the total number of people who tested positive in the local or state area, was the next most prevalent topic, making up 18% of local news Facebook posts.
-
There were few differences between broadcast and newspaper posts. Broadcast news was more likely to post about what you can do to help in your area (4%) than newspapers (2%).2
-
There also were few differences in the posts for states with a high number of cases compared to those with fewer cases. States with more cases (California, New York, and Washington) posted more about the number of deaths in the state or local area (11%) than states with fewer cases (6%).3
Health Information Garnered Strong Facebook Engagement
We examined the number of likes, comments, and shares for each of the local coronavirus news Facebook post categories. Overall, health information earned the most engagement.
-
Facebook likes were highest for information about what to do if someone displayed coronavirus symptoms (around 39.5 likes, the median value). Government response to the virus (around 35.5 likes), and information about how local hospitals (around 34 likes) and grocery stores (around 33 likes) were responding also yielded a high number of likes.
-
Comments were highest for information about the number of deaths in a local area or state (around 24.5 comments), followed by information about coronavirus testing (around 18 comments). Government responses also yielded a higher number of comments (around 17 comments).
-
Shares were highest for what to do if someone displayed coronavirus symptoms (around 42.5 shares), followed by information about the number of deaths in a local area or state (around 38 shares). Coronavirus-related crime also had a higher share rate (around 34 shares).
Coronavirus Dominated Local News’ Facebook Posts
-
81% of Facebook posts from local newspaper and television news organizations focused on coronavirus.
-
Of those Facebook posts that were about coronavirus, 65% presented local coverage. The remaining 35% were international coverage, national coverage, or coverage from other states.
-
Television news Facebook posts were about coronavirus (82%) more often than newspaper Facebook posts were (79%), although the difference was slight.4
-
Newspaper coronavirus Facebook posts were more likely to be local (72%) than television news Facebook posts (58%).5
-
Media from states with a higher number of coronavirus cases at the time of the study (California, New York, and Washington) covered coronavirus just as frequently as media from states with fewer coronavirus cases.6 Coronavirus posts were also equally likely to be local whether they originated from newsrooms in states with a higher number, or lower number, of cases.7
Coronavirus Facebook Posts Garnered More Engagement
-
Facebook posts about topics other than coronavirus had around 4 likes, 2 comments, and 1 share (median values), compared to posts about coronavirus, which had around 17 likes, 11 comments, and 5 shares.8
-
Local coronavirus posts had around 12.5 comments, compared to 9 comments on non-local posts. There were no differences in the number of likes or shares depending on whether the coronavirus posts were local or not.9
Methodology
This report was made possible thanks to funding from the Democracy Fund, the William and Flora Hewlett Foundation, and The John S. and James L. Knight Foundation. On March 23, 2020, we launched a survey of 999 people through Prolific. Prolific has a pool of roughly 16,000 survey panelists in the U.S. that can opt-in to take any survey and are paid for their participation through Prolific.
Participant Demographics
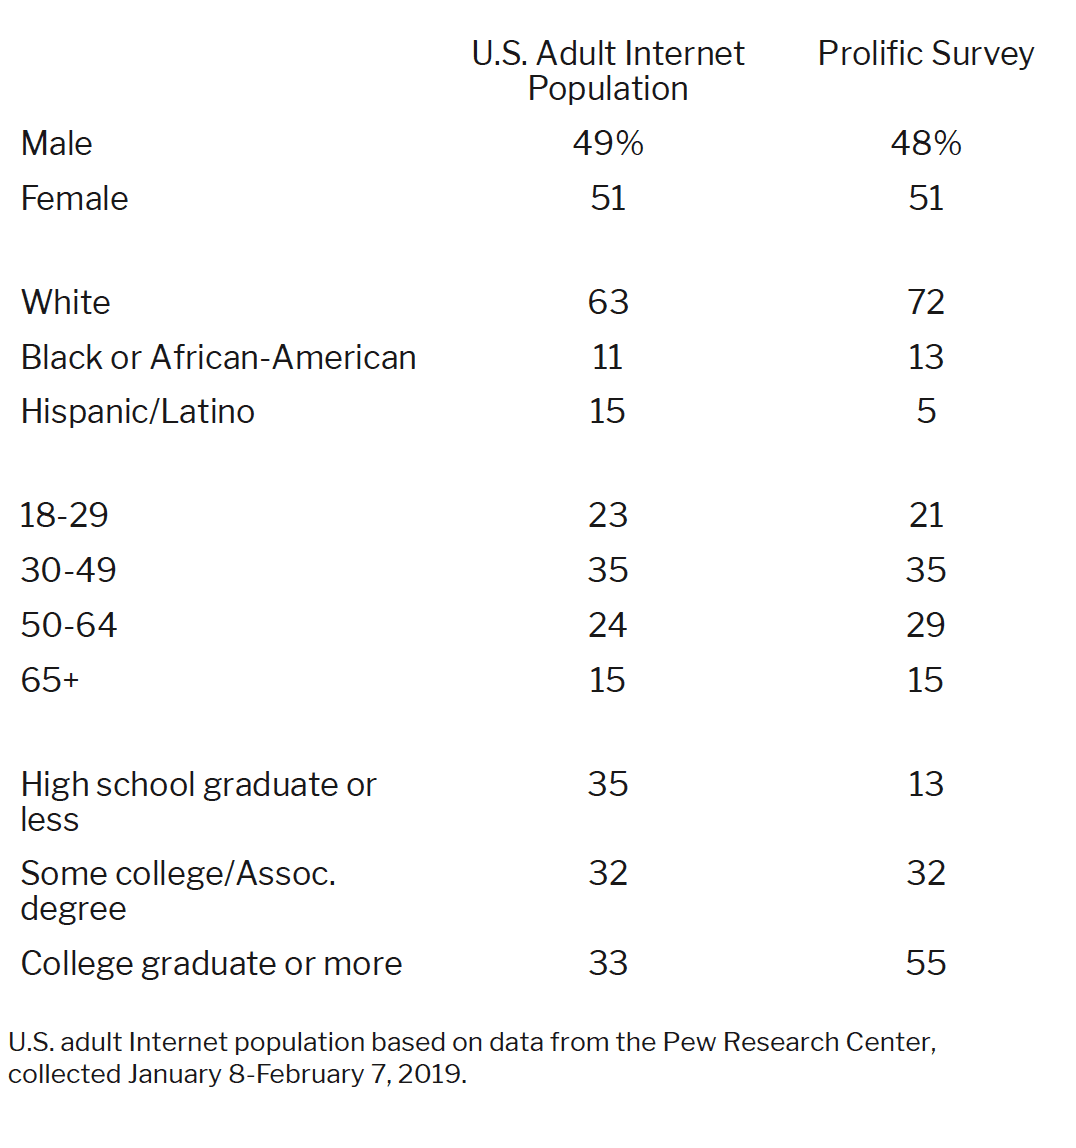
The survey was neither a representative nor a random sample, although quotas were put in place for age, gender, and race. The overall demographics of the sample, compared to Pew Research, are included in the table below. As can be seen from the table, our sample is significantly more educated and more white than the U.S. adult Internet population. Because our sample is not representative, we include covariates when computing our mean values and then report means adjusted for demographics. The demographic controls did not change our substantive conclusions.
Question Wording
With response options of very important, somewhat important, not too important, and not at all important, survey respondents were asked the following questions.
As of today, how important is it to you that your local news organizations share coronavirus information about:
- The number of people in your local area testing positive for coronavirus
- The number of deaths from coronavirus in your local area
- What to do if you have coronavirus symptoms
- Coronavirus testing, such as how to get tested, who can get tested, and the availability of tests in your local area
- Case studies of local people who contracted coronavirus
- Projections about future cases of coronavirus in your local area or state
- What local schools and universities are doing in response to coronavirus
- What local hospitals are doing in response
- What local people are doing in response
- What local grocery stores are doing in response
- What local restaurants and bars are doing in response
- What other types of local businesses are doing in response
- Events in your local area that are canceled
- What local provisions are available for people without means or most at risk (e.g. homeless, laid off, elderly)
- What local groups are most affected by coronavirus (e.g. elderly, etc.)
- What you can do to help people in your local area affected by coronavirus
- What local or state government is doing in response
- Local crime related to coronavirus (e.g. stolen toilet paper or price gouging)
- Fact-checking misinformation circulating in your local area or state
- A list of restrictions in your local area or state
- Local or statewide economic effects (e.g. unemployment)
- Projections about the economic future of your local area or state
Next, we used Facebook’s CrowdTangle platform to gather Facebook posts from newspapers in the state capitals10 and from a randomly selected sample of one television station (ABC, CBS, NBC, or FOX) in each of Nielsen’s 210 Designated Market Areas (DMAs). This returned 1,264 posts from newspapers and 7,515 posts from television news stations.
We randomly sampled 500 posts (250 from newspapers and 250 from television) and conducted a reliability analysis on whether the posts (1) were related to coronavirus and, if so, (2) were local stories. After obtaining reliability, we examined an additional 1,551 randomly sampled posts for a total of 2,051 posts analyzed for whether they were about coronavirus and, if so, if they were local.
For posts that were both about coronavirus and local, we randomly sampled 200 posts (100 from newspapers and 100 from television) and conducted a reliability analysis. After obtaining reliability, we examined an additional 802 randomly sampled posts, split between newspaper and television, for a total of 1,002 posts analyzed for what topics were covered in the local coronavirus posts.
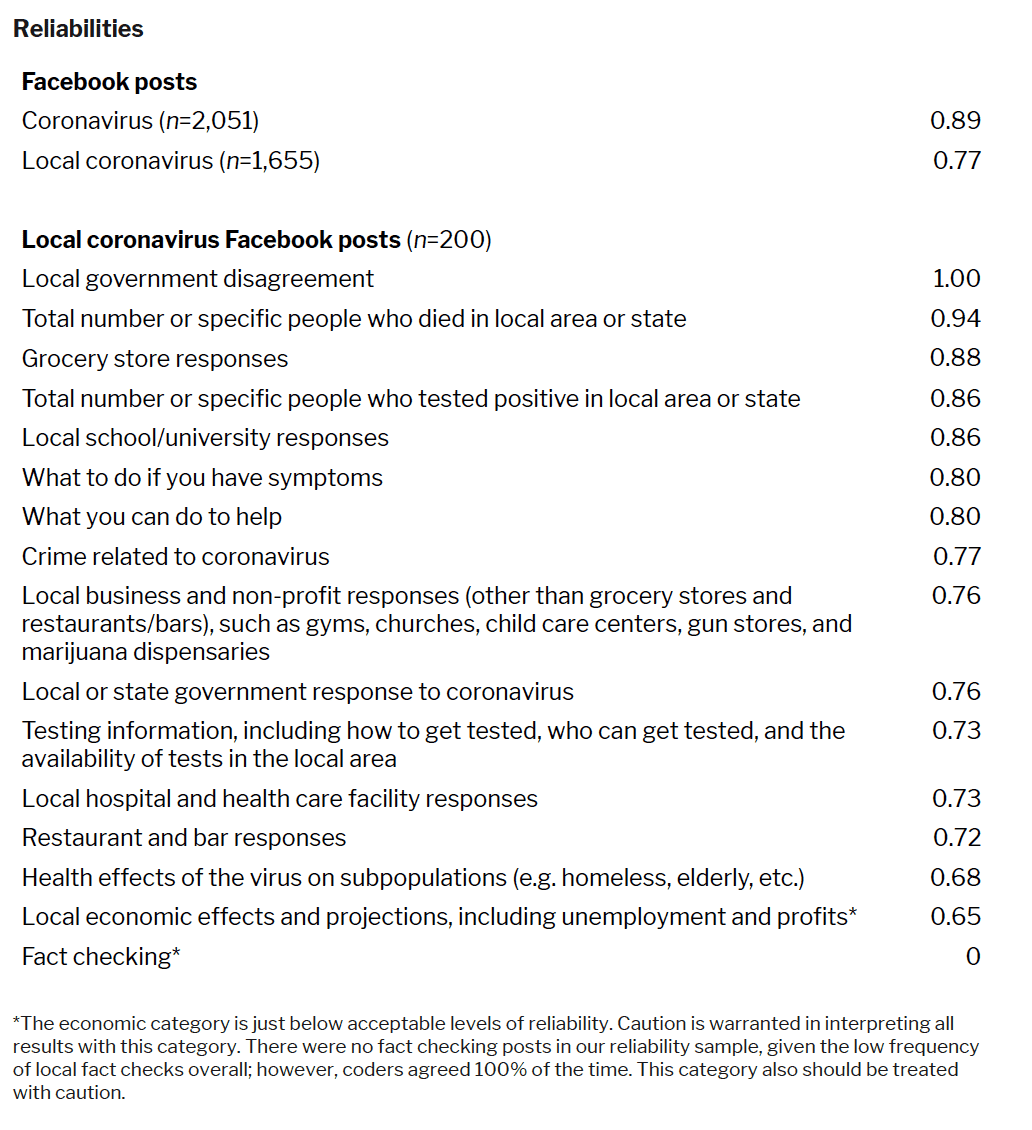
Reliabilities were computed using Krippendorff’s alpha. The metric runs from 0, indicating a lack of reliability and extensive disagreement among people examining the same content, to 1, indicating perfect agreement among people examining the content. Scores greater than 0.80 indicate strong reliability and those greater than 0.67 indicate acceptable levels of reliability.
Suggested Citation:
Gina M. Masullo, Jessica Collier, Ashley Muddiman, Caroline Murray, Gabrielle Chavez, Katalina Deaven, Natalie Deller, Jacob Gursky, Jay Jennings, Katie Joseff, Ellery Wadman-Goetsch, Tamar Wilner, and Natalie Jomini Stroud. (2020, March). Covering coronavirus: A snapshot of the information people want and what newsrooms are reporting. Center for Media Engagement. https://mediaengagement.org/research/ coronavirus-reporting-snapshot
- We adjusted the results by age, gender, education, and race, and then held these values constant at their mean and modal values. None of the control variables was significant in the model. [↩]
- X2(1, 1005) = 5.14, Phi = .07, p = .02. Newspapers also were more likely to post about the economic implications (18%) compared to television (11%), although we note that we did not attain high reliability on this metric so caution is warranted, X2(1, 1005) = 11.02, Phi = .10, p <.01. [↩]
- New Jersey also had a high number of cases; however, no New Jersey outlets were included in our sample, so we do not mention the state here. X2(1, 1005) = 3.99, Phi = .06, p = .05 [↩]
- X2(1, 2050) = 4.28, Phi = .05, p = .04 [↩]
- X2(1, 1654) = 32.01, Phi = .14, p < .001 [↩]
- The difference between states with more cases and those with fewer was not statistically significant, X2(1, 2051) = 2.61, Phi = .04, p = .11 [↩]
- X2(1, 1655) = 2.11, Phi = .04, p = .15 [↩]
- Mann-Whitney Z = 10.25, p < .01 for likes; 11.75, p < .01 for comments; and 7.58, p < .01 for shares comparing coronavirus to non-coronavirus posts. [↩]
- Mann-Whitney Z = 2.57, p = .01 for comments comparing local coronavirus to non-local coronavirus posts. [↩]
- Note that the Times of Trenton did not appear to have a Facebook page and was not included. [↩]