

SUMMARY
While people may feel overwhelmed by coronavirus news, they still want – and need – information about the crisis.1 Solutions journalism may be a way to provide relevant information while minimizing the potentially negative consequences of news consumption.2 In this study, the Center for Media Engagement tested the effects of exposure to coronavirus news headlines and images on Facebook.
We found that reading headlines that were positive or were focused on solutions to problems relating to coronavirus, rather than negative developments about the pandemic, made participants less anxious and more willing to “like” the news posts on Facebook. Similarly, when the images that accompanied the headlines were graphic – showed a coronavirus patient covered in protective gear or a body bag – people felt more anxious than when they viewed images that were not graphic.3 Participants who viewed posts with images without a body bag or patient were also less inclined to blame Chinese immigrants for the spread of the coronavirus in the U.S. than those who viewed posts with graphic images.
THE PROBLEM
The coronavirus pandemic has intensified an already troubling trend: News coverage tends to focus on the negative. This negativity can overwhelm and exhaust news consumers. According to a 2019 report from Reuters Institute, about a third of people (across 38 countries) deliberately avoid the news.4 One of the most common reasons for this is that the news negatively affects their moods. The coronavirus crisis has amplified this issue. The U.S. Centers for Disease Control and Prevention (CDC) even recommends that people take breaks from coronavirus news coverage to protect their mental health.5 What’s more, the coronavirus emerged in the Hubei province of China – and when the virus spread to the U.S., it led to a wave of racism directed at Asian Americans.6
We wanted to find out how newsrooms can help the public stay informed without making them feel overly anxious. One possible method is to use solutions journalism. Previous research from the Center for Media Engagement shows that solutions journalism can increase readers’ self-efficacy, perceived knowledge, and desire to engage with the issue being covered.7 Our research has also shown that it can increase readers’ positivity and intentions to engage and improve perceptions of article quality.8
This study, funded by the John S. and James L. Knight Foundation and Democracy Fund, tested the effects of exposure to coronavirus news headlines and images on Facebook. Participants were shown one of the following types of headlines:
- Negative: mentioning a negative development relating to the pandemic
- Positive: mentioning a positive development relating to the pandemic
- Solutions-oriented: mentioning a possible development relating to the pandemic and a specific solution that contributed to it
Each image was either graphic (depicted a coronavirus patient covered in protective gear or a body bag) or not graphic.
KEY FINDINGS
Compared to negative headlines, solutions headlines, and positive headlines on Facebook posts:
- Made participants feel less anxious
- Made participants more likely to say they would “like” the post on Facebook
Compared to graphic images, non-graphic images on Facebook posts:
- Made participants feel less anxious
- Made participants perceive the risks of coronavirus to be lower
- Made participants less inclined to blame Chinese immigrants for the spread of the coronavirus in the U.S.
None of the types of headlines or images influenced the participants’ trust in the news, intentions to read the full articles, or desire to take breaks from the news.
IMPLICATIONS FOR THE NEWSROOM
Newsrooms may at times be tempted to trend toward stories that emphasize potential danger or conflict, believing that these stories are more likely to make people pay attention.
Our study shows that this may backfire, leading to negative effects for the news audience. In this experiment, seeing a positive or solutions headline on a Facebook post about a coronavirus news story made readers feel less anxious and more willing to “like” the Facebook posts. Similarly, viewing an accompanying photo that did not show a coronavirus patient or a body bag led to less anxiety.
There was no difference between the effects of a solutions headline and a positive headline. In this study, positive headlines described a positive development related to the coronavirus crisis (for example, “Coronavirus Infection Rate Plummets in Ecuador, Here’s the Latest”).
Solutions headlines conveyed the same information but also mentioned a specific solution (for example, “Coronavirus Infection Rate Plummets in Ecuador, Thanks to Face Masks”). It might be that briefly mentioning a solution in a headline – the only type of text included in this experiment – is not enough to affect readers. If participants had viewed the entire article, the results may have been different. Even though solutions headlines had the same effects as positive headlines, the solutions headlines included additional information that might help better inform readers.
While our findings support using non-graphic images to lessen anxiety, the implications related to participants’ risk perception are less clear. We found that participants who viewed graphic images perceived the risks of coronavirus to be higher than those who viewed non-graphic images. However, it’s not clear exactly how high the risks should be perceived. While the risks should be taken seriously, newsrooms may not want to add undue stress to readers. An important take-away from this finding is that subtle choices made by newsrooms – such as using a graphic photo with a body bag or using one without – can directly influence news consumers’ perceptions of risks related to coronavirus.
THE EXPERIMENT
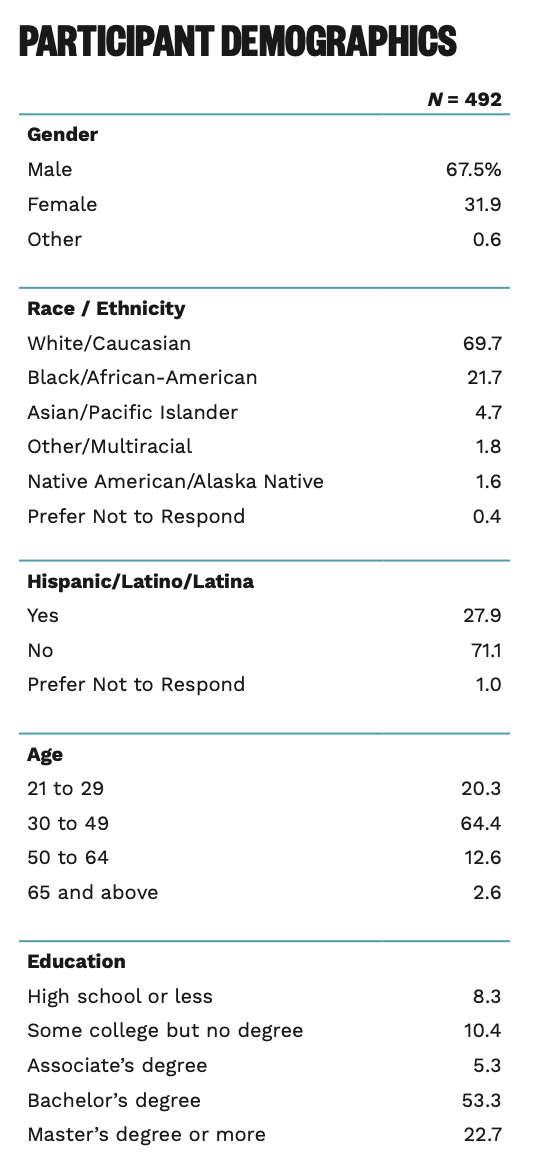
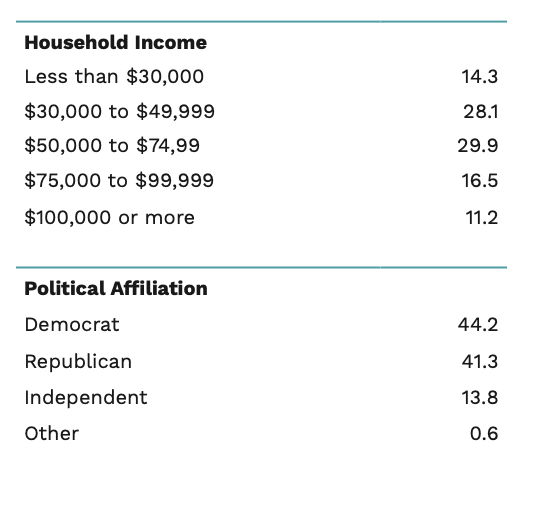
A total of 492 participants9 were shown a series of four Facebook posts about coronavirus news. They were randomly assigned to see posts that featured headlines that were negative, positive, or solutions-oriented. The posts they saw had photos that were classified as either graphic (showing a body bag or a coronavirus patient) or non-graphic (not showing a body bag or patient). After viewing the posts, participants answered questions about how the posts affected them.
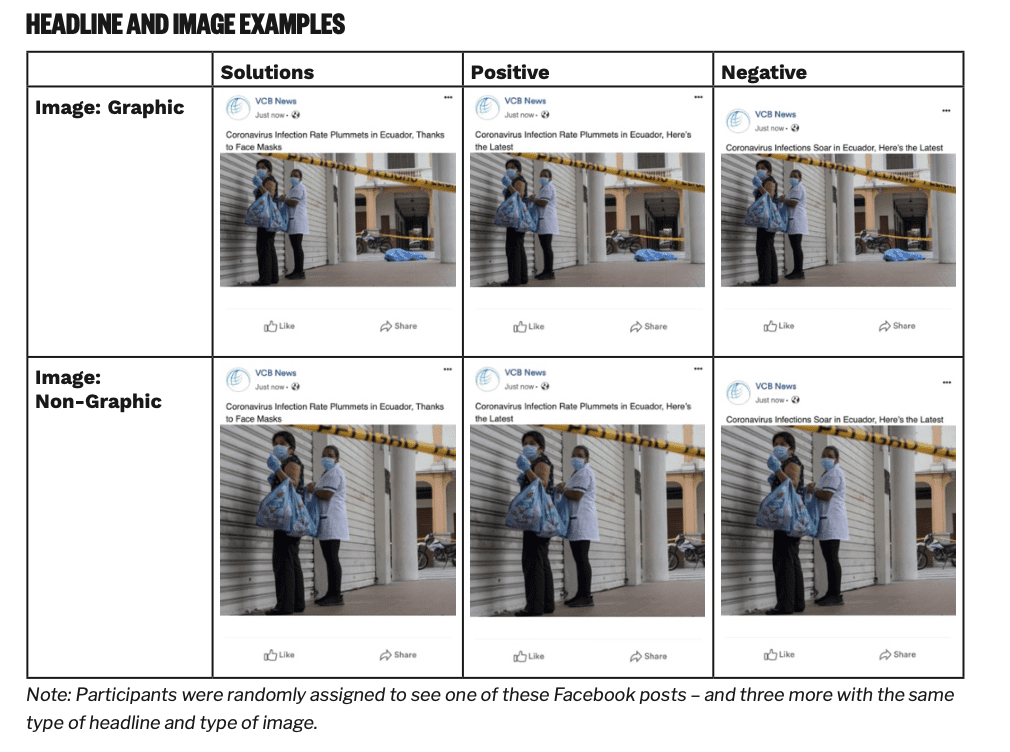
The differences between the positive and negative headlines were subtle. In the example shown above, the positive headline focused on the infection rate in Ecuador (which was falling at the time), while the negative headline focused on the total number of infections (which was rising). Both headlines were true at the time.
The solutions headlines mentioned the same positive development as the positive headlines but also mentioned a specific solution that had contributed to it (face masks, in the example above). The headlines of the three remaining posts described coronavirus developments in Italy, the U.S., and the world more broadly – and they differed in the same ways as in the example above.10 The images used in the three remaining posts all showed healthcare workers at work. In all cases, the graphic versions included a body bag or a coronavirus patient in the picture, while the non-graphic versions did not.
THE EFFECTS OF SOLUTIONS AND POSITIVE HEADLINES
Overall, the solutions and positive headlines had the same effect on perceptions of anxiety and willingness to “like” the posts, compared with the negative headlines.
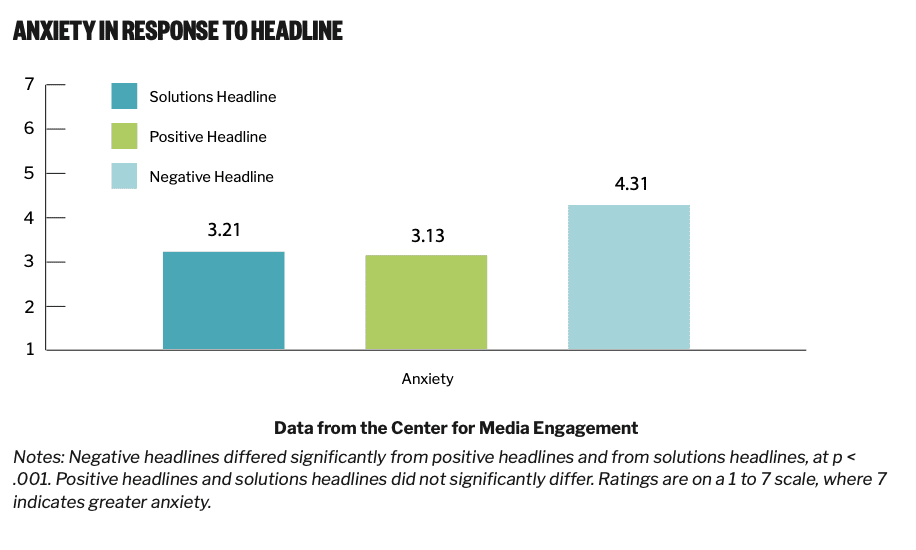
Reduced anxiety
Participants who viewed solutions headlines or positive headlines felt less anxious than those who viewed negative headlines in posts.11
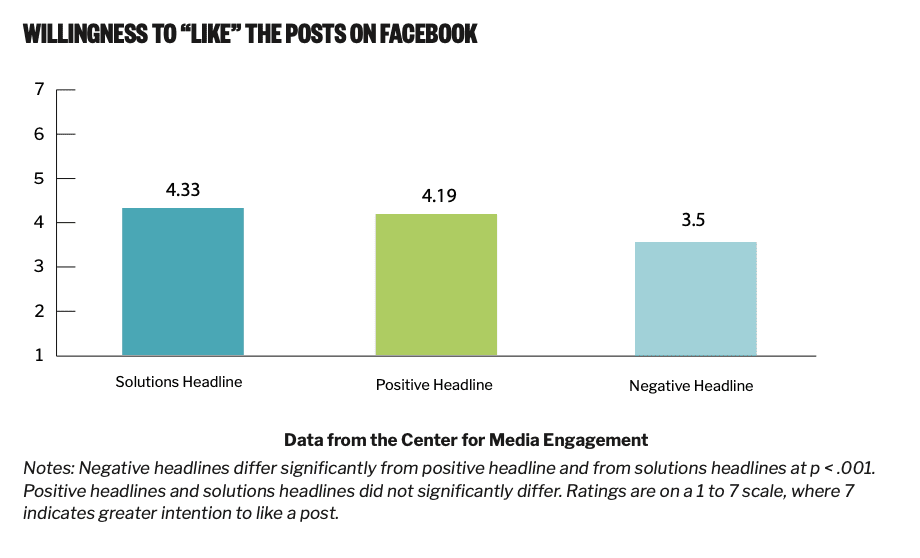
Increased willingness to “like” the posts
Participants who were shown solutions headlines or positive headlines said that they were more likely to “like” these posts than those who saw negative headlines.12
THE EFFECTS OF GRAPHIC IMAGES
We also found that images that included a body bag or a coronavirus patient in protective gear – which we considered graphic images – influenced people differently than those without.
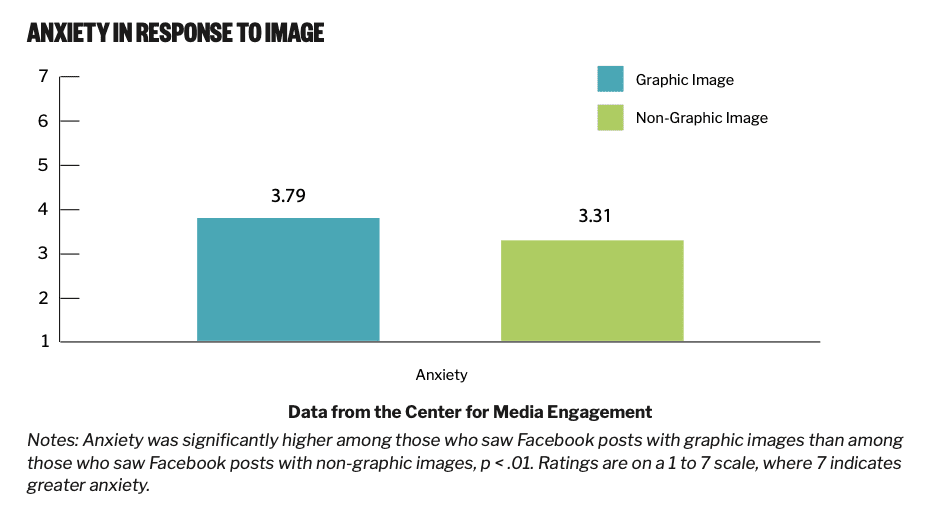
Graphic images increased anxiety
Those who saw Facebook posts with graphic images felt more anxious after viewing the post, compared to those who saw similar posts with non-graphic images.13
Graphic images increased the perceived risk of coronavirus
Two types of risk were assessed: the risk of becoming infected with coronavirus and the risk of dying from a coronavirus infection.14 Participants who saw posts with graphic images perceived both types of risk to be greater than those who saw posts with non-graphic images.15

Graphic images increased inclination to blame Chinese immigrants for the spread of the virus
Research in social psychology has found that people tend to become more prejudiced when they feel angry or under threat.16 We tested the implications of this in the context of the coronavirus crisis by asking participants how much they agreed with three statements regarding blaming Chinese immigrants for the spread of coronavirus in the U.S. Findings show that participants who viewed graphic images were more inclined to blame Chinese immigrants for the spread of the virus than those who viewed non-graphic images.17

METHODOLOGY
Participants were recruited through CloudResearch, a platform that provides access to participants through Amazon Mechanical Turk and aims to ensure higher-quality responses.18 Each participant saw Facebook posts from a fictitious news organization sharing an article. We tested three different types of headlines (negative, positive, solutions) and two different types of photos (graphic, non-graphic). There were a total of six conditions:
- Negative headline/graphic image
- Negative headline/non-graphic image
- Positive headline/graphic image
- Positive headline/non-graphic image
- Solutions headline/graphic image
- Solutions headline/non-graphic image
Participants were randomly assigned to one of these conditions and saw a total of four Facebook posts that fit their assigned condition. After each post, they were asked how likely they would be to “like” the post if they saw it on Facebook and how likely they would be to click on it to access the full article. After seeing all four stories, participants were asked about their level of anxiety, inclination to blame Chinese immigrants for the spread of coronavirus in the U.S., and their perceived risk of becoming sick or dying of the virus.
SUGGESTED CITATION:
Overgaard, Christian Staal Bruun and Stroud, Natalie Jomini. (2020, August). Coronavirus coverage: The effects of headlines and images on Facebook. Center for Media Engagement. https://mediaengagement.org/research/coronavirus-headlines-and-images
- Masullo, Gina M., Jay Jennings, Jessica R. Collier, Ashley Muddiman, Caroline Murray, Gabrielle Chavez, Katalina Deaven, Natalie Deller, Jacob Gursky, Katie Joseff, Ellery Wadman-Goetsch, Tamar Wilner, & Natalie Jomini Stroud. (2020, May). Covering coronavirus: How audience needs are changing and how newsroom coverage compares. Center for Media Engagement. https://mediaengagement.org/research/ coronavirus-coveragechanges [↩]
- Murray, Caroline and Stroud, Natalie Jomini. (2019, August). The keys to powerful solutions journalism. Center for Media Engagement. https://mediaengagement.org/research/powerfulsolutions-journalism [↩]
- There were a total of four “graphic” photos. Three of them depicted a body bag; one of them depicted a coronavirus patient covered by protective equipment. [↩]
- Newman, N., Fletcher, R., Kalogeropoulos, A., Nielsen, R. K. (2019). Reuters Institute digital news report 2019. http://www.digitalnewsreport.org/survey/2019/overview-key-findings-2019/ [↩]
- CDC. (2020, April 30). Coronavirus Disease 2019 (COVID-19). Centers for Disease Control and Prevention. https://www.cdc.gov/coronavirus/2019-ncov/daily-life-coping/managing-stress-anxiety.html [↩]
- Kim, C. (2020, March 25). “They just see that you’re Asian and you are horrible”: How the pandemic is triggering racist attacks. https://www.vox.com/identities/2020/3/25/21190655/trump-coronavirus-racist-asianamericans [↩]
- Curry, Alex and Hammonds, Keith H. (2014, June). Solutions journalism. Center for Media Engagement. https:// mediaengagement.org/research/solutions-journalism/ [↩]
- Murray, Caroline and Stroud, Natalie Jomini. (2019, August). The keys to powerful solutions journalism. Center for Media Engagement. https://mediaengagement.org/research/powerfulsolutions-journalism [↩]
- A total of 500 people completed the survey experiment, but data from eight were removed from the analysis because they did not pay adequate attention to questions. [↩]
- Headlines used in the remaining posts were: Posts about Italy (solution: “Coronavirus: Italy’s daily death toll falls due to travel restrictions”; positive: “Coronavirus: Italy’s daily death toll falls, Here’s the latest”; negative: “Coronavirus: Italy’s death toll surges, Here’s the latest”). Posts about the U.S. (solution: “COVID-19: Because of Social Distancing, The Spread is Slowing Down in These States”; positive: “COVID-19: The Spread is Slowing Down in These States”; negative: “COVID-19: The Spread is Accelerating in These States”). Posts about the world more broadly (solution: “In a matter of weeks, tens of thousands have recovered from COVID-19. New drug could save many more”; positive: “In a matter of weeks, tens of thousands have recovered from COVID-19. Here’s today’s coronavirus update”; negative: “In a matter of weeks, tens of thousands have died from COVID-19. Here’s today’s coronavirus update”). [↩]
- For anxiety, participants rated how “anxious,” “uneasy,” and “afraid” they felt on a 1 (not at all) to 7 (very much) scale. Responses were averaged together (M = 3.54, SD = 1.89, Cronbach’s alpha = 0.92). We tested differences in anxiety using an ANOVA, which showed a significant effect of headline type, F(2, 491) = 21.84, p < .001. Sidak post hoc tests were used. This scale comes from MacKuen, M., Wolak, J., Keele, L., & Marcus, G. E. (2010). Civic Engagements: Resolute Partisanship or Reflective Deliberation. American Journal of Political Science, 54(2), 440–458. https://doi.org/10.1111/j.1540-5907.2010.00440.x [↩]
- An ANOVA showed headline type had a significant effect on intentions to like posts, F(2, 322.62) = 7.46, p < .001. As Levene’s test was significant, we used Games-Howell post-hoc tests. [↩]
- An ANOVA showed that participants who saw posts with graphic images felt significantly higher levels of anxiety than those who saw posts with non-graphic images, F(1, 491) = 8.99, n² = 0.02, p < .01. [↩]
- For perceived risk of getting infected, participants rated how likely the following were on a 1 (very unlikely) to 7 (very likely) scale: “You will become infected with coronavirus (COVID19) in the next month,” “Someone in your family will become infected with coronavirus (COVID19) in the next month,” and “One of your friends will become infected with coronavirus (COVID19) in the next month.” Responses were averaged together, M = 3.76, SD = 1.77, Cronbach’s alpha = 0.94. For perceived risk of dying, participants rated their level of dis/agreement on a 1 (strongly disagree) to 7 (strongly agree) scale to the following: “If I become infected with coronavirus (COVID19), it is likely that I will die,” “If my family members become infected with coronavirus (COVID19), it is likely that they will die,” “If my friends become infected with coronavirus (COVID19), it is likely that they will die,” and “In general, if people become infected with coronavirus (COVID19), it is likely that they will die.” Responses were averaged together, M = 3.55, SD = 1.83, Cronbach’s alpha = 0.94. Both of these scales were taken from Gerhold, L. (2020). COVID-19: Risk perception and coping strategies. (Unpublished manuscript). Institute of Computer Science, Freie Universität Berlin. https://psyarxiv.com/xmpk4 [↩]
- An ANOVA showed that participants who saw posts with graphic images perceived the risk of getting infected with COVID-19 to be higher than those who saw posts with non-graphic images, F (1, 491) = 3.98, p < .05. Similarly, Participants who saw posts with graphic images perceived the risk of dying from COVID-19 infection to be higher than those who saw posts with non-graphic images, F (1, 491) = 4.46, p < .05. [↩]
- See for example: Coryn, C. L., Beale, J. M., & Myers, K. M. (2004). Response to September 11: Anxiety, patriotism, and prejudice in the aftermath of terror. Current Research in Social Psychology, 9(12), 165–183; DeSteno, D., Dasgupta, N., Bartlett, M. Y., & Cajdric, A. (2004). Prejudice from thin air: The effect of emotion on automatic intergroup attitudes. Psychological Science, 15(5), 319–324. https://doi.org/10.1111/j.09567976.2004.00676.x [↩]
- The three statements were: “Chinese immigrants have damaged public health in the U.S. by spreading coronavirus (COVID19),” “Chinese immigrants are responsible for the spread of coronavirus (COVID19) in the U.S.,” and “Chinese immigrants should not be blamed for the spread of coronavirus (COVID19) in the U.S.” The third item was reverse-scored, and all three statements were averaged into an index, M = 3.28, SD = 1.69, Cronbach’s alpha = 0.78. This scale was adapted from Xu, C., & Liu, M. Y. (2020). Social cost with no political gain: The “Chinese virus” effect. https://doi.org/10.31234/osf.io/j4t2r. An ANOVA showed that participants who saw posts with graphic images where more inclined to blame Chinese immigrants for the spread of COVID-19 than those who saw posts with non-graphic images, F (1, 485.318) = 6.02, p < .05. [↩]
- CloudResearch specializes in recruiting research participants from Amazon Mechanical Turk and ensuring high-quality responses by screening-out respondents who answer demographic questions inconsistently or who have suspicious geo-locations; see CloudResearch. (2020). Transform MTurk into a complete online survey platform. CloudResearch. https://www.cloudresearch.com/products/turkprime-mturk-toolkit/ [↩]