


SUMMARY
The U.S. is experiencing heightened political and social division. On social media, this often makes it difficult for people to talk with others who do not align with their beliefs.
Our new research explores the use of “connective language” as a way to help people better connect with each other and enjoy their online experience. The findings suggest that people can improve their online discussions by using this type of language in their posts. It also suggests social media platforms should optimize algorithms to surface these posts more often.
THE PROBLEM
The United States is more divided today than at any point in recent memory.1 This divisiveness plays out on social media, making it challenging for people to talk to those who are not ideologically aligned with them. Divisiveness poses a problem for society because it can limit people’s ability to work together and discuss problems in a thoughtful manner,2 and, ultimately, can undermine our democracy.
Center for Media Engagement research offers a solution to this problem—encouraging the use of “connective language” online.3 Connective language expresses an openness to other perspectives and a humble approach to presenting one’s viewpoints.4 Examples of connective language include phrases such as “correct me if I’m wrong” or “this is just my opinion.”
This study experimentally tests whether using connective language (versus non-connective language) in social media posts will lead to better outcomes, such as greater enjoyment of the experience and more connection between people. This research is part of our connective democracy initiative, funded by the John S. and James L. Knight Foundation. Connective democracy seeks to find practical solutions to the problem of divisiveness.
KEY FINDINGS
- People spent more time on the page with a connective Facebook post about politics, compared to a non-connective post about politics. But people were not more likely to engage with (e.g., reply to or “like,” etc.) a connective post.
- People found reading a connective post about politics more enjoyable than reading a non-connective post about politics, especially if the content aligned with their beliefs.
- Reading a connective post led to fewer emotions, whether positive or negative, compared to a non-connective post.
- People felt less manipulated by a connective post and were less likely to argue against the message.
- Compared to reading a non-connective post, reading a connective post had no effect on how politically polarized people perceived like-minded or opposing partisans to be. It also had no effect on how people felt toward those who share their political beliefs or those who have different beliefs.
IMPLICATIONS
- Social media platforms should optimize their algorithms so that connective posts surface more often.
- The public can improve online discussions by incorporating connective phrasing into their social media posts.
FULL FINDINGS
Participants were shown a single Facebook post that conveyed the same opinion but was written in either a connective or non-connective manner. A third of participants saw a post that aligned with their ideological beliefs, a third saw a post that did not align with their beliefs, and a third saw a neutral post.
Engagement
Participants spent more time on the page when viewing a connective post, compared to a non-connective post.5 But people were not more likely to engage with (e.g., reply to or “like,” etc.) a connective post.6 Overall, 106 participants added reactions (e.g., “like” or “haha”) in response to the post they viewed, and 17 participants posted replies.
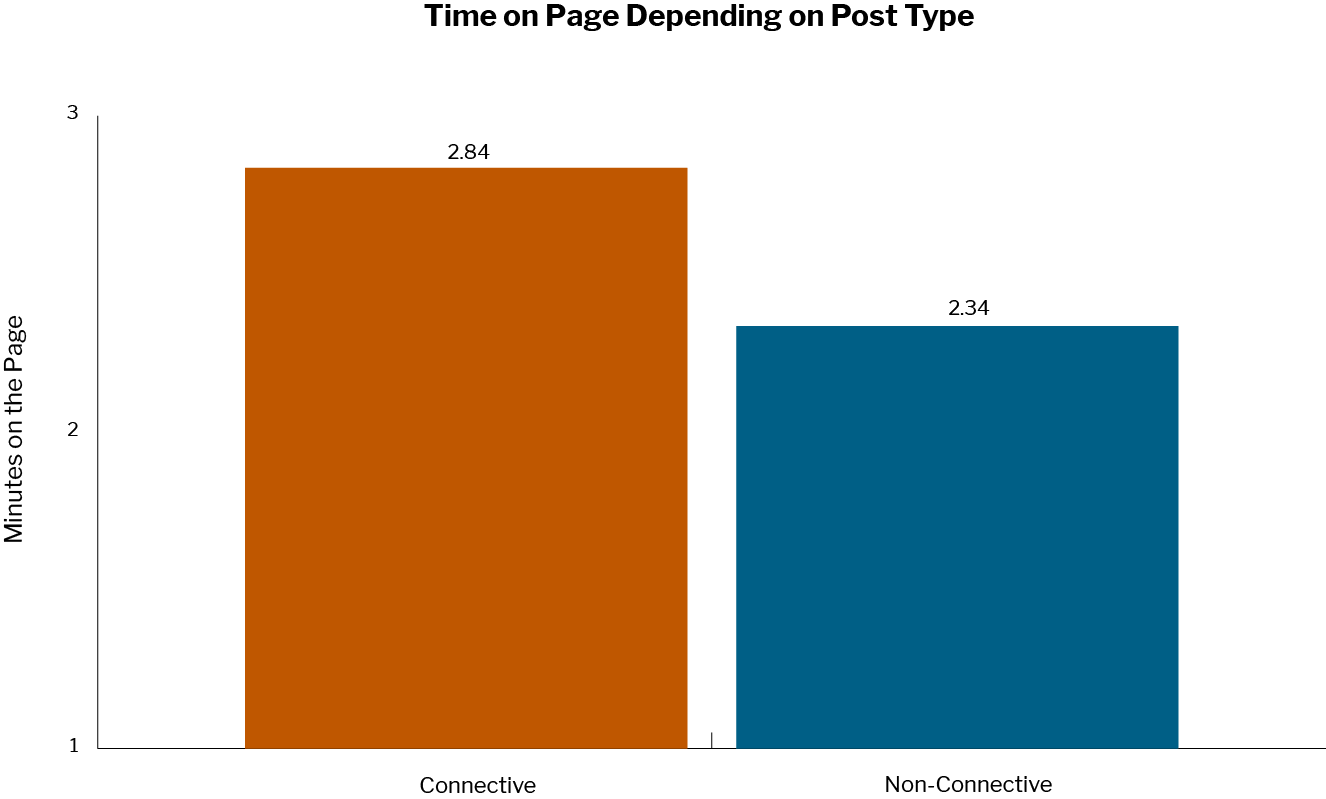
Notes: Scores are significantly different at p < .001.
Enjoyment
Results showed that participants enjoyed reading a connective post significantly more than a non-connective post,7 especially if the post aligned with their beliefs.8
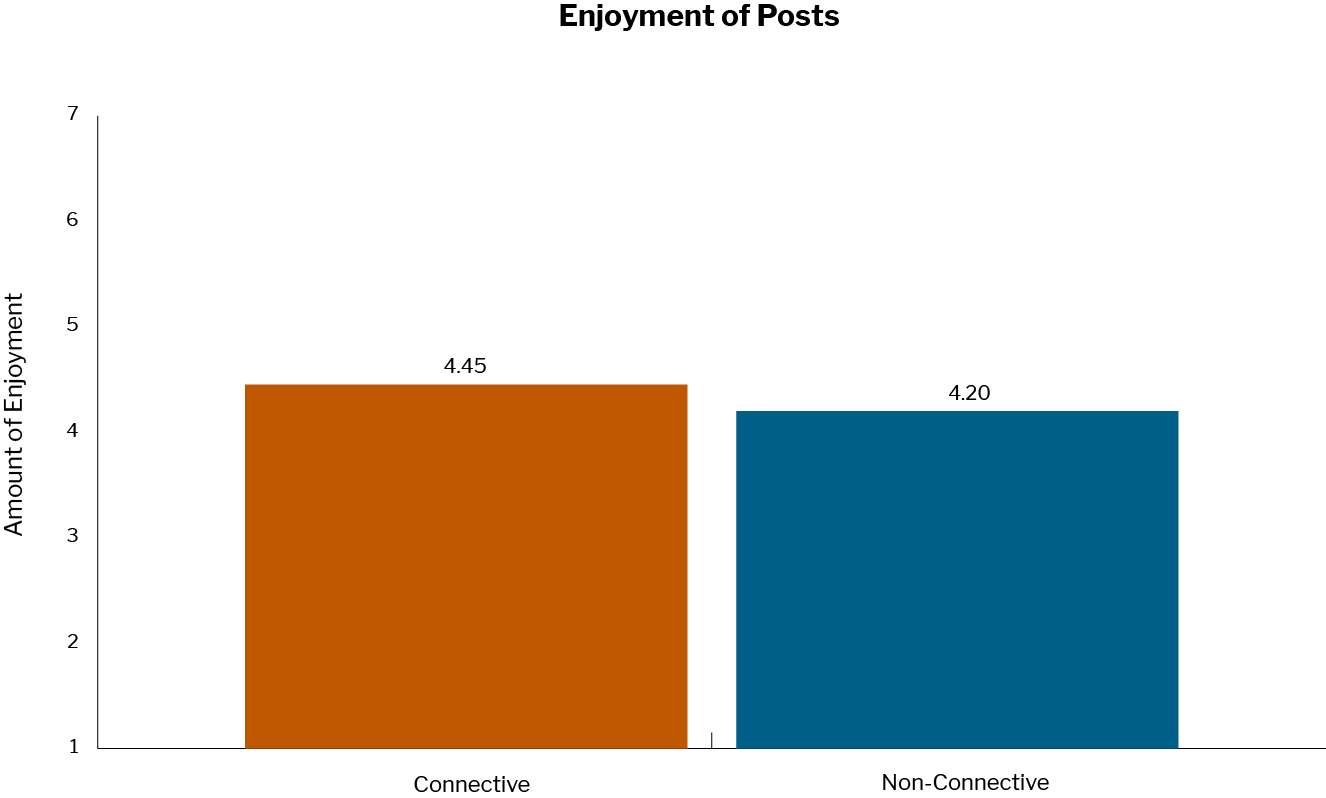
Notes: Participants rated from 1 (strongly disagree) to 7 (strongly agree) their agreement or disagreement with seven statements about their enjoyment of the post, and their responses were averaged together. The average scores differ significantly at p < .001.
Emotions
Results demonstrated that viewing a connective post led to significantly fewer emotions, both negative and positive, compared to viewing a non-connective post.9
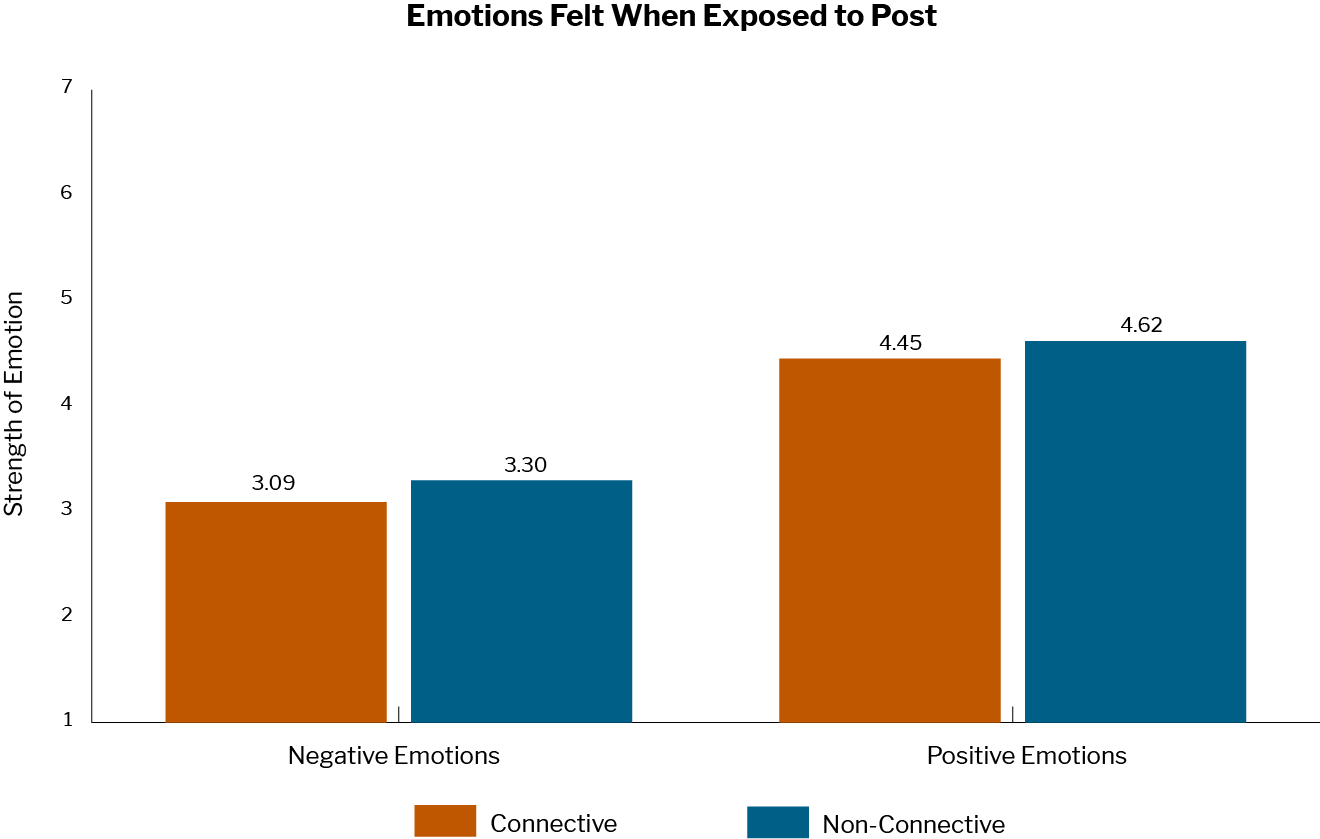
Notes: Participants rated from 1 (strongly disagree) to 7 (strongly agree) to indicate how much they felt 11 emotions “when reading the post.” Responses were averaged together. Emotional states differed at p < .001 between connective and non-connective posts for both positive and negative emotions.
Feelings of Manipulation and Counter-Arguing
Our findings showed that people felt less manipulated or controlled10 by a connective post and were less likely to argue against the message11 than when viewing a non-connective post.
We also wanted to understand what people thought about when they were reading a connective post versus a non-connective post. We asked participants to list up to 10 statements that described their thoughts while reading the Facebook post.12 Analysis of participants’ statements showed that those who read a connective post were less likely to list statements that expressed disagreement.13
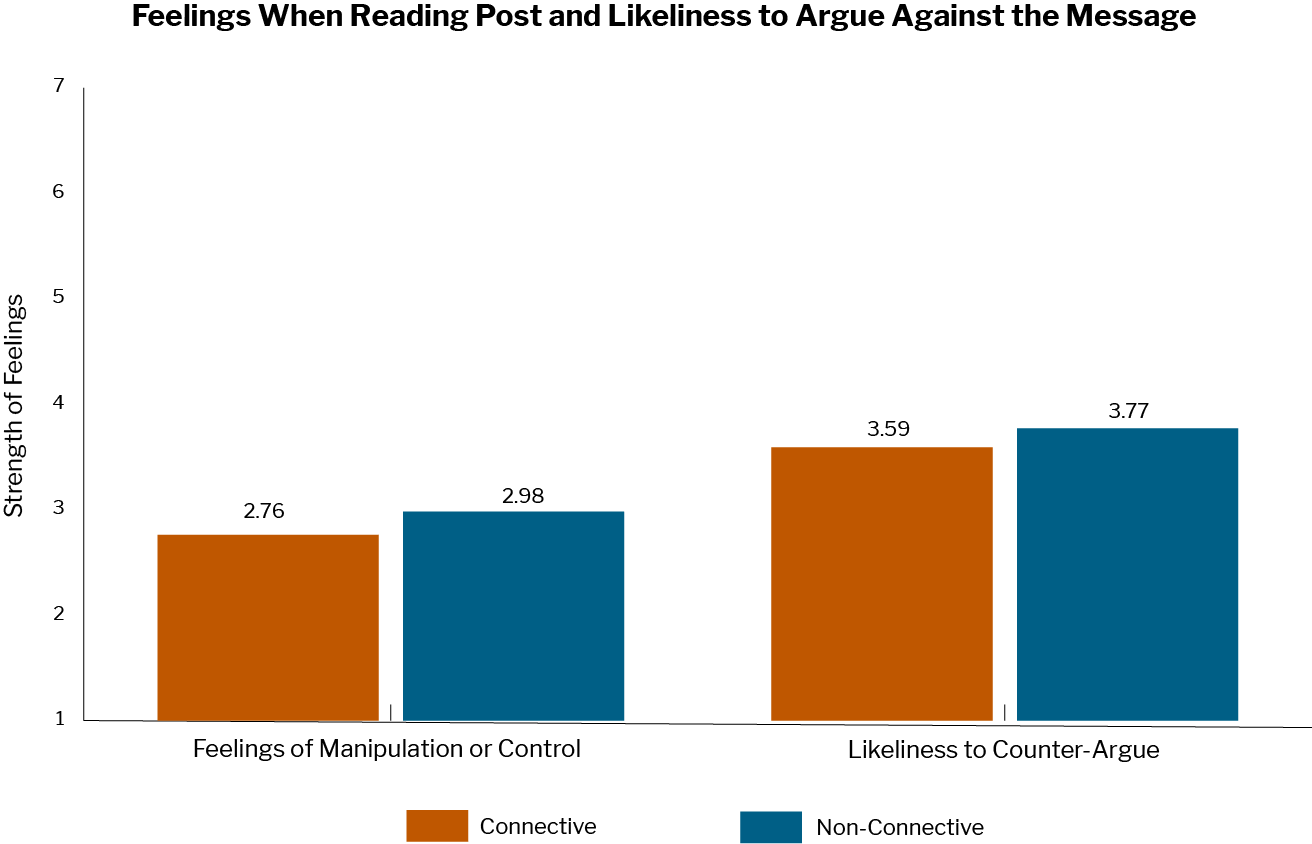
Notes: Participants rated on a scale from 1 (strongly disagree) to 7 (strongly agree) on separate questions about counter-arguments and feelings of being manipulated or of losing control. Average scores are shown, which differ at p < .001 for both feelings of manipulation or control and likeliness to counter-argue.
Perception of Polarization
Our findings showed that exposure to a connective post had no effect on how polarized people perceived like-minded or opposing partisans to be, compared to exposure to a non-connective post.14 Results also showed that exposure to a connective post had no effect on how people felt toward those who share their political beliefs or those who have different beliefs.15
METHODOLOGY
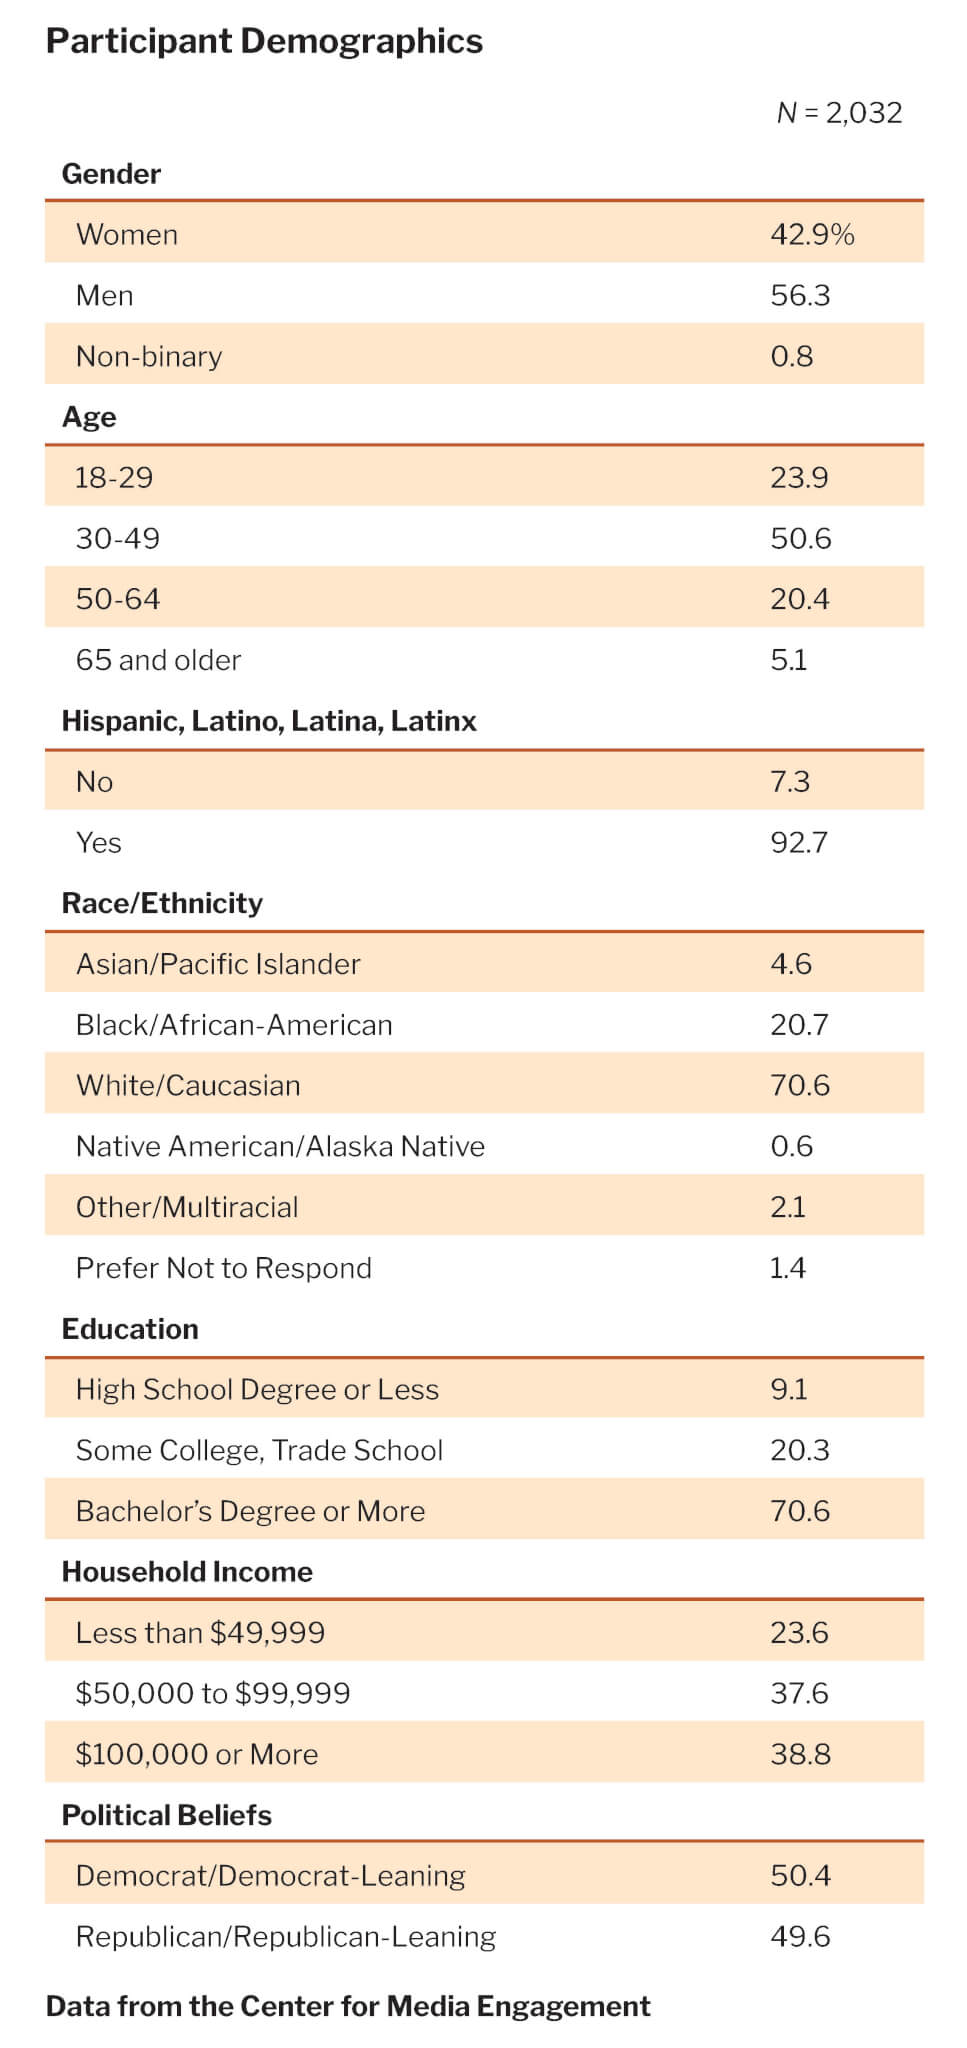
Participants were recruited through Prolific, an online platform designed to aid scholars in recruiting research participants. Prolific provides access to more than 200,000 global active users, including 16,000 in the United States. Participants opt into studies and are paid through Prolific. Our participants had to be U.S. residents who are 18 or older. We set up quotas for political beliefs and recruited roughly half participants who are Democrats and half who are Republicans. This is not a random or representative sample.
After consenting,16 participants (N = 2,032)17 were randomly assigned to see one of 12 Facebook posts about politics. Half the posts were written in a connective manner, and half were not. A third of participants were shown a post that aligned with their ideological beliefs, a third saw a post not aligned with their beliefs, and a third saw a neutral post.
The post appeared to participants on a fully interactive replica of a Facebook page created by our research team. People could “like” or reply to posts, just like on Facebook. Content for the posts was scraped from social media to enhance realism, although a few words were changed for clarity.
Participants were paid $3 each for completing the study, which took about 13.45 minutes on average to finish. Data were collected from June 25 to July 8, 2025. To help ensure that participants read the stimuli, we asked people if they could see the stimuli and had read it and excluded data for those who answered no. We also put a timer on the stimuli survey page that required that participants spend at least 20 seconds on the page before advancing.
Suggested Citation
Yao, S., Masullo, G.M., Stroud, N.J., Lukito, J., Rajadesingan, A., and Lin, Z. (August, 2025). Connective posts: A new approach to political conversations on social media. Center for Media Engagement. https://mediaengagement.org/research/connective-posts-social-media
- Pew Research Center. (2024, April 9). Changing partisan coalitions in a politically divided nation. Pew Research. https://www.pewresearch.org/politics/2024/04/09/changing-partisan-coalitions-in-a-politically-divided-nation/[↩]
- Mutz, D.C. (2006). Hearing the other side: Deliberative versus participatory democracy. Cambridge University Press; Jacobs, L.R., Cook, F.L., & Delli Carpini, M.X. (2009). Talking together: Public deliberation and political participation in America. University of Chicago Press; Herbst, S. (2010). Rude democracy: Civility and incivility in American politics. Temple University Press.[↩]
- Lukito, J., Chen, B., Masullo, G.M., & Stroud, N.J. (2024). Comparing a BERT classifier and a GPT classifier for detecting connective language across multiple social media. Proceedings of the Empirical Methods in Natural Language Processing Conference; Overgaard, C.S.B., Masullo, G.M., Duchovnay, M., & Moore, C. (2022). Theorizing connective democracy: A new way to bridge political divides. Mass Communication and Society, 25(6), 861-885. https://doi.org/10.1080/15205436.2022.2119870[↩]
- Lukito et al. (2024).[↩]
- This was tested with an analysis of variance (ANOVA) with post type (connective vs. non-connective) and post alignment (like-minded, counter-attitudinal, or neutral) as independent variables. The overall model was significant, F (1, 2022) = 26.93, p < .001, partial η2 = 0.04.[↩]
- Replies and reactions (e.g., “likes,” “haha,” etc.) were tabulated by the platform we used. Reactions were summed and analyzed together. Two logistic regression models with post type (connective vs. non-connective) and post alignment as independent variables showed that exposure to connective posts had no effect on either replies (B = 0.56, p = .25) or engagement (B = 1.12, p = .58).[↩]
- The seven enjoyment measures are adapted from Deci, E.L., & Ryan, R.M. (1985). Intrinsic motivation and self-determination in human behavior. Springer. These were: “I enjoyed reading this post very much,” “This post was fun to read,” “I thought this post was a boring post,” “This post did not hold my attention at all,” “I would describe this post as very interesting,” “I thought this post was quite enjoyable,” and “I was thinking about how much I enjoyed it.” Posts were reverse-scored (when necessary) to be in the same direction and averaged together with high reliability, M = 4.28, SD = 1.47; ɑ = 0.91. This measure was the dependent variable in an ANOVA with post type (connective vs. non-connective) and post alignment (like-minded, counter-attitudinal, or neutral) as independent variables. The overall model was significant, F (1, 2022) = 29.31, p < .001, partial η2 = 0.02. Participants rated a connective post as 4.45 (SE = 0.04) on average on a 1 to 7 scale, which is significantly higher than the average rating for a non-connective post (4.2, SE = 0.04) at p < .001.[↩]
- This was tested by adding an interaction between post type and post align into the equation explained in endnote 5. The significant interaction, F(2, 2022) = 11.20, p < .001, partial η2 = 0.05, showed that people particularly enjoyed a post that was both connective and aligned with their viewpoints.[↩]
- We assessed emotions using a series of adjectives from Watson, D., Clark, L.E., and Tellegen, A. (1998). Development and validation of brief measures of positive and negative affect: The PANAS scales. Journal of Personality and Social Psychology, 54(6), 1063–1070. https://doi.org/10.1037/0022-3514.54.6.1063 and Dillard, J. P., & Peck, E. (2000). Affect and persuasion: Emotional responses to public service announcements. Communication Research, 27(4), 461-495. https://doi.org/10.1177/009365000027004003. Initially, we had 23 adjectives, which we subjected to a principal component analysis with a scree plot test and promax rotation, which is used when variables correlate. This showed the adjectives loaded onto four factors, but we used only two of those factors, negative emotions (“Irritated,” “annoyed,” “aggravated,” “angry,” “upset,” and “hostile”) and positive emotions (“proud,” “strong,” “enthusiastic,” “excited,” and “inspired”). We did not use a factor with words about “fear” because it is unrelated to the study topic, and items did not load on the fourth factor cleanly enough to use. Responses for the negative emotions were averaged together, M = 4.51, SD = .48; ɑ = 0.89, as were responses for positive emotions, M = 2.42, SD = 1.22; ɑ = 0.88. To test the effect of connective posts on emotions, we conducted one multi-factorial multivariate analysis of variance (MANOVA) with post type (connective vs. non-connective) and post alignment (like-minded, counter-attitudinal, or neutral) as independent variables, and negative emotions and positive emotions as dependent variables. Results showed a main effect for negative emotions F (1, 2022) = 9.82, p = .002, partial η2 = 0.01, and for positive emotions, F (1, 2022) = 6.67, p = .01, partial η2 = 0.003.[↩]
- This concept was measured based on the perceived threat to freedom scale from Dillard, J.P., & Shen, L. (2015). On the nature of reactance and its role in persuasive health communication. Communication Monographs, 72(2), 144-168. https://doi.org/10.1080/03637750500111815. Participants rated from 1 (strongly disagree) to 7 (strongly agree), their level of agreement or disagreement with: “The message threatened my freedom to choose,” “The message tried to make a decision for me,” “The message tried to manipulate me,” and “The message tried to pressure me.” Responses were averaged together with high reliability, M = 2.88, SD = 1.45; ɑ = 0.89. A MANOVA with post type (connective vs. non-connective) and post alignment (like-minded, counter-attitudinal, or neutral) as independent variables, and the perceived threat to freedom scale and the counter arguments scale explained in endnote 11 as the dependent variables. When perceived threat to freedom was the dependent variable, connective posts produced a significant main effect, F (1, 2015) = 11.01, p < .001, partial η2 = 0.01.[↩]
- Counter arguments were measured in line with Nabi, R.L., Nabi, R. L., Moyer-Gusé, E., & Byrne, S. (2007). All joking aside: A serious investigation into the persuasive effect of funny social issue messages. Communication Monographs, 74(1), 29–54. https://doi.org/10.1080/03637750701196896. Participants rate from 1 (strongly disagree) to 7 (strongly agree) their level of disagreement or agreement with four statements: “I found myself actively agreeing with the author’s points,” “I found myself actively disagreeing with the author,” “I was looking for flaws in the author’s arguments,” and “It was easy to agree with the arguments made in the message.” Posts were reverse-scored (when necessary) to be in the same direction and averaged together with high reliability, M = 3.68, SD = 1.45; ɑ = 0.78. Counter-arguing was tested in the MANOVA explained in endnote 10, and connective posts produced a significant main effect, F (2, 2022) = 8.14, p = .004, partial η2 = 0.004.[↩]
- Dillard & Shen (2015).[↩]
- We coded participants’ thoughts based on two dimensions: relevance (0 = relevant, 1 = irrelevant) and disagreement (0 = agreement, 1 = disagreement). Disagreement was coded only if the thought was relevant; irrelevant thoughts were not evaluated for disagreement. Therefore, a code of 1 for disagreement indicates that the thought was both relevant and expressed disagreement with the post. Two logistic regression models with post type (connective vs. non-connective) and post alignment as independent variables showed that exposure to a connective post had a significant negative effect on whether people’s thoughts while reading the post expressed disagreement (B = –0.27, p = .004).[↩]
- To measure perceived polarization, we adapted a measure from Lelkes, Y., & Westwood, S.J. (2017). The limits of partisan prejudice. The Journal of Politics, 79(2), 485-501. Participants rated on a 0 to 100 scale “what do you think the typical Republican voter feels about Democrats?” and “what do you think the typical Democratic voter feels about Republicans?” The scale was labeled with 0 = “Cold feelings toward Democrats/Republicans”; 50 = “Neither warm nor cold feelings toward Democrats/Republicans”; 100 = “Warm feelings toward Democrats/Republicans.” Participants rated how Republicans feel about Democrats (M = 30.21 and SD = 26.72) and how Democrats feel about Republicans (M = 29.33 and SD = 26.78). Both measures were used as dependent variables in a MANOVA with post type (connective vs. non-connective) and post alignment (like-minded, counter-attitudinal, or neutral) as independent variables. Results showed no significant main effect for Republicans’ perception of Democrats, F (1,2019) = 2.04, p = .15, partial η2 = 0.001, or for Democrats’ perception of Republicans, F (1,2020) = 3.27, p = .07, partial η2 = 0.002.[↩]
- We adapted a measure from Lelkes and Westwood (2017) to operationalize affective polarization. Democrats rated on a 0 to 100 scale how they felt about their inparty “a typical Democratic voter” (M = 75.57, SD = 18.94) and their outparty “a typical Republican voter” (M = 26.17, SD = 23.61), where 0 = “You feel cold toward the typical Republican voter”; 50 = “You feel neither warm nor cold toward the typical Republican voter”; 100 = “You feel warm toward the typical Republican voter.” Republicans used the same scale to rate their outparty “a typical Democratic voter” (M = 41.61, SD = 25.34) and their inparty “a typical Republican voter” (M = 77.65, SD = 19.02). We conducted one ANOVA, each with post type (connective vs. non-connective) and post alignment (like-minded, counter-attitudinal, or neutral) as independent variables, for each dependent variable. Results showed no significant main effect for how Republicans felt toward Democrats, F (1, 997) = 0.15, p = .70, partial η2 = 0.000, nor for how Democrats felt toward Republicans, F (1,1009) = 0.12, p = .73, partial η2 = 0.000. Similarly, exposure to connective posts had no significant main effect for how Democrats felt toward their inparty, F (1, 1015) = 0.50, p = .58, partial η2 = 0.000, nor for how Republicans felt toward their inparty, F (1, 998) = 0.18, p = .67, partial η2 = 0.002.[↩]
- The Institutional Review Board at The University of Texas at Austin approved this project on April 24, 2025.[↩]
- Initially, 2,376 people started our experiment, but data were not analyzed for those who may have taken the survey more than once as shown by duplicate IP addresses (n = 143), were younger than 18 or did not answer a question about age (n = 5), failed more than one of the three attention checks (n = 5), could not see the post (n = 22), did not read the post (n = 17), took too much time to finish the survey (3 SD above the mean of 13.66 minutes; n = 1), or finished the survey more quickly than feasible (less than 3 minutes; n = 151). This resulted in N = 2,032.[↩]