SUMMARY
As journalists are increasingly tasked with correcting people’s misperceptions, questions arise about the best way to approach a fact-checking story. The Center for Media Engagement set out to test two approaches in broadcast news: a more traditional just-the-facts style that lays out the corrections and a more empathetic style that walks viewers through the discovery of why the misperception is wrong.
The results show that both story approaches work equally well to correct misperceptions, but that political beliefs influence how people perceive the news, regardless of how the fact-checking stories are approached.
PROBLEM
Correcting misperceptions — beliefs in false information1 — has become a central task for journalists2 as misinformation has become a widespread problem.3 How journalists go about correcting misinformation is important because people can cling to mistaken beliefs even when confronted with contradictory evidence.4
In this study, the Center for Media Engagement tested two types of broadcast news fact-checking stories about COVID-19. One uses a traditional “just-the-facts” style that focuses on factual evidence and explains why the misperception is wrong. The other tries to take a more empathetic approach by walking the viewer through the process of discovering why the misperception is wrong.
KEY FINDINGS
- Both fact-checking story approaches worked equally well to correct misperceptions about the safety of COVID-19 vaccines.
- There were no differences between the two types of fact-checking approaches in influencing perceptions that the story was credible.
- There were no differences between the two types of fact-checking approaches in influencing perceptions of people who do not believe the fact check.
- Democrats and those who vaccinated their child (or children) against COVID-19 perceived either fact-checking story approach as more credible compared to Republicans and people who did not vaccinate their child (or children) against COVID-19.
IMPLICATIONS
- These findings support the use of fact checks for correcting misperceptions. Both the empathetic and the traditional just-the-facts approaches are equally effective.
- These findings illustrate that political beliefs influence how people perceive the news, regardless of the type of fact-checking story approach to which they were exposed.
FULL FINDINGS
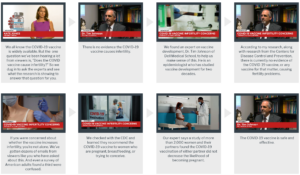
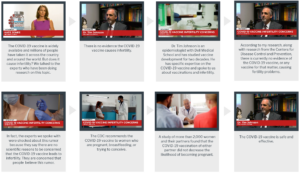
Participants were randomly assigned to view one short broadcast news story. They saw either a fact-checking story about the safety of COVID-19 vaccines for children 5 and older, a fact-checking story about the safety of COVID-19 vaccines for people who are pregnant or trying to conceive, or a weather story, which served as a control condition. People who viewed a fact-checking story were randomly assigned to view either a traditional “just-the-facts” story that focused on factual evidence that explains why the misperception is wrong or what we call an “empathetic” style of story where the newscaster walks the viewer through the process of finding the truth.
Our rationale for the empathetic approach is that it might help people feel like they are not foolish for believing the misperception, and, as a result, they would be more responsive to the fact check.
Support for this study was provided by the William and Flora Hewlett Foundation and the John S. and James L. Knight Foundation.
Belief Correction
First, we tested whether both fact-checking approaches — just-the-facts and empathetic — would be more effective than the weather story (the control) in correcting misperceptions. We did this by asking people their beliefs about the safety of COVID-19 vaccines at two points, first in a survey fielded several weeks before participants viewed a broadcast news story and then a second time after they were exposed to the story.5
We found that the fact-checking stories about the safety of COVID-19 vaccines for people who are pregnant or trying to conceive were more effective at correcting misperceptions than the weather story (control),6 but that was not the case for the fact-checking stories about the safety of COVID-19 vaccines for children 5 and older.7
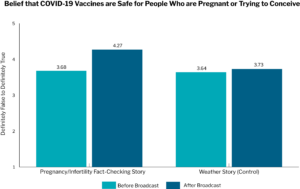
Notes: Both fact-checking approaches led to significantly more belief correction about COVID-19 after people viewed the broadcast story, compared to before they viewed the broadcast story at p < .001. In addition, people exposed to either fact-checking approach had significantly greater belief correction compared to those exposed to the weather story at p < .001. People were asked about the safety of the COVID-19 vaccines from 1 (definitely false) to 5 (definitely true).
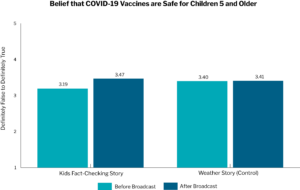
Notes: Both fact-checking approaches led to significantly more belief correction about COVID-19 after people viewed the broadcast, compared to before they viewed the broadcast at p < .001. However, belief correction was statistically indistinguishable regardless of whether people were exposed to the fact checks or the weather story at p = .59. People were asked about the safety of the COVID-19 vaccines from 1 (definitely false) to 5 (definitely true).
Next, we tested whether the empathetic fact-checking approach was more effective than the traditional just-the-facts approach in correcting misperceptions. Results showed that the two fact-checking approaches were equally effective at belief correction.8
News Credibility
We then examined whether the empathetic fact-checking approach would have different effects on people’s perceptions of the credibility of the news story, compared to the traditional fact-checking approach or the weather story. Results showed that neither fact check increased perceptions that the news story was credible; those exposed to the weather story had significantly higher ratings for news story credibility than those exposed to either fact check.9
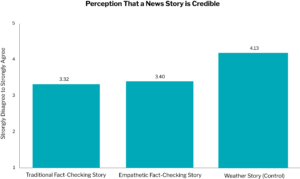
Notes: Both fact-checking approaches had no effect on increasing perceptions that the news story was credible, although those exposed to the weather story had significantly higher ratings for news story credibility, compared to those exposed to either fact check at p < .001. People were asked to rate the credibility of the news story by rating how “accurate,” “authentic,” “believable,” and “trustworthy” it was from 1 (strongly disagree) to 5 (strongly agree).
However, Democrats10 and those who vaccinated their children against COVID-1911 rated both fact-checking stories as more credible than Republicans and those who did not vaccinate their children.
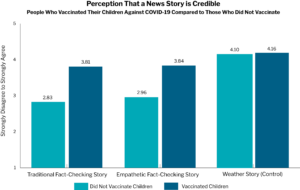
Notes: People who vaccinated their children against COVID-19 rated either fact-checking story as significantly more credible compared to those who did not vaccinate at p < .001, although ratings for the credibility of the weather story did not differ (p = .65). People were asked to rate the credibility of the news story by rating how “accurate,” “authentic,” “believable,” and “trustworthy” it was from 1 (strongly disagree) to 5 (strongly agree).
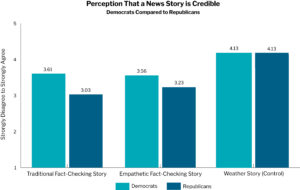
Notes: Democrats rated either fact-checking story as significantly more credible compared to Republicans at p < .001 for the traditional fact-checking story and p = .05 for the empathetic fact-checking story, although ratings for the credibility of the weather story did not differ (p = .99). People were asked to rate the credibility of the news story by rating how “accurate,” “authentic,” “believable,” and “trustworthy” it was from 1 (strongly disagree) to 5 (strongly agree).
METHODOLOGY
Our 1,119 participants were recruited through CloudResearch, which uses participants from Amazon Mechanical Turk. Participants had to be age 25 to 54 — the most coveted demographic for TV news12 — and live in the United States. To ensure we would recruit roughly half participants who are Democrats and half participants who are Republicans, we set up quotas. This was neither a representative nor a random sample.
Participants completed an initial survey13 that asked about their attitudes toward COVID-19 vaccines and their demographics. Because the fact-checking videos were about COVID-19 vaccines in relation to children and to people who are pregnant or trying to conceive, participants were also asked if they had minor children, if they had their child or children vaccinated for COVID-19, or if they or a partner is pregnant or trying to conceive. These same participants were invited to participate in a second survey experiment14 conducted several weeks later so that questions in the first survey would not prime them on the intent of the experiment.
In the second survey, participants were randomly assigned to watch one of three broadcast news stories. One was a fact-checking story about the safety of COVID-19 vaccines for children older than 5, one was a fact-checking story about the safety of COVID-19 vaccines for people who are pregnant or want to conceive, and one was a weather story that served as a control condition. Participants who viewed a fact-checking story were randomly assigned to view either a story that was designed to be a typical broadcast news story that just stated the facts (vaccines and children version or vaccines and infertility version) or a fact-checking story that was designed to explain the facts in a more empathetic manner (vaccines and children version or vaccines and infertility version).15
The fact-checking news stories and the weather story were written by a former broadcast journalist. Two fact-checking topics were used to examine the robustness of results across topics, not because differences were expected.
We kept details in the fact-checking stories as consistent as possible, manipulating content only to reflect the two treatment conditions (just-the-facts style or empathetic style). The length of the videos was similar, lasting 1 minute and 39 seconds on average.16
News Video Storyboards
COVID-19 Vaccines and Infertility: Empathetic Fact Check
COVID-19 Vaccines and Infertility: Just-the-Facts Fact Check
All the videos were recorded at The University of Texas’ broadcast studio, used volunteer actors, and were professionally edited. To help ensure people were able to watch and hear the videos in the experimental survey, a test video was inserted into the beginning of the second survey, and data from participants were not used if they could not hear the audio or see the video of the test video. Also, participants’ data were excluded if they did not correctly report a word (“dog”) spoken at the end of the test video. Additionally, the survey was set up so that people had to stay on the video page for the length of the video, and their data were excluded if they indicated they couldn’t or didn’t watch the video or hear the audio.
After viewing the video, participants answered the same questions they answered in the first survey about their attitudes toward COVID-19 vaccines. The questions were designed to examine whether exposure to the videos changed their attitudes about the safety of the vaccines and to test which fact-checking video style (the just-the-facts version or the empathetic version) was most effective at dispelling misinformation about COVID-19, compared to those who viewed the weather story (the control). Those in the control condition answered questions about the safety of COVID-19 vaccines for children and those who are pregnant or trying to conceive. All participants also answered questions about their perceptions of the credibility of the news story, and those in fact-checking conditions (but not in the control), rated their attitudes toward people who did not believe the fact check they viewed.
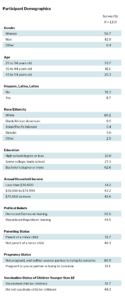
Note: *This question was only asked of people with children 18 or younger (n = 527).
SUGGESTED CITATION:
Masullo, G.M., West, K., Stroud, N.J., Fazio, L.K. (December, 2023) Fact-checking approaches in broadcast news. Center for Media Engagement. https://mediaengagement.org/research/fact-checking-approaches-in-broadcast-news
- Tandoc, E.C. Jr., Zheng, W.L., & Ling, R. (2018). Defining “fake news.” Digital Journalism, 6(2), 137-153.[↩]
- Graves, L. (2016). Deciding what’s true: The rise of political fact-checking American journalism. Columbia University Press.[↩]
- Allcott, H., Gentzkow, M., & Yu, C. (2019). Trends in the diffusion of misinformation on social media. Research and Politics, 6(2), 1-9.[↩]
- Ecker, U.K.H., Lewandowsky, S., Cook, J., Schmid, P., Fazio, L.K., Brashier, N., Kendeou, P., Vraga, E.K., & Amazeen, M.A. (2022). The psychological drivers of misinformation belief and its resistance to correction. Nature Reviews Psychology, 1, 13-29.[↩]
- This was tested by asking people about their beliefs about the COVID-19 vaccine twice, once in the initial survey and again after viewing the news story in a separate survey experiment fielded several weeks following the first survey. From 1 (definitely false) to 5 (definitely true), participants rated the following statements: “COVID-19 vaccines were developed at an unsafe speed” and “COVID-19 vaccines are safe for children over 5” to measure attitudes about the vaccine for children and “COVID-19 vaccines are safe for people who can get pregnant” and “COVID-19 vaccines cause infertility or miscarriage” to measure attitudes about the vaccine for people who are pregnant or trying to conceive. Answers were reverse-scored as needed, so a higher number would always mean greater belief correction. Then indices were created by averaging the two statements about the safety of the vaccines for kids in survey 1 (M = 3.32, SD = 1.33, Ϸ = 0.88) and survey 2 (M = 3.43, SD = 1.25, Ϸ = 0.84) and the safety of the vaccine for those who are pregnant or trying to conceive in survey 1 (M = 3.61, SD = 1.17, Ϸ = 0.88) and survey 2 (M = 3.90, SD = 1.14, Ϸ = 0.90).[↩]
- This was tested using an analysis of variance (ANOVA) with belief correction about the safety of the COVID-19 vaccine for people who are pregnant or trying to conceive as the dependent variable, and responses from survey 1 and survey 2 were subjected to a repeated-measures analysis. Both treatment conditions (empathetic and traditional) were collapsed into one condition and compared to the control. Findings showed a significant interaction between the two surveys and the experimental conditions (treatment vs. control), F (1, 780) = 86.49, partial η2 = 0.10, p < .001.[↩]
- This was tested using an analysis of variance (ANOVA) with belief correction about the safety of the COVID-19 vaccine for children as the dependent variable, and responses from survey 1 and survey 2 were subjected to a repeated-measures analysis. Both treatment conditions (empathetic and traditional) were collapsed into one condition and compared to the control. Findings showed a significant interaction between the two surveys and the experimental conditions (treatment vs. control), F (1, 774) = 25.91, partial η2 = 0.03, p < .001. This analysis showed a significant difference in belief correction from survey 1 to survey 2, but there were no significant differences between the means for belief correction for those who saw the fact-checking stories (M = 3.47, SE = 0.08) and those who saw the weather story (M = 3.41, SE = 0.08, p = .58.[↩]
- This was tested with two ANOVAs, one with belief correction about the safety of the COVID-19 vaccine for people who are pregnant or trying to conceive and one with belief correction about the safety of the vaccine for children age 5 and older. In both cases, responses from survey 1 and survey 2 were subjected to repeated-measures analysis, and comparisons were made between the empathetic fact check, traditional fact check, and weather story conditions. When the dependent variable was belief correction about the safety of the COVID-19 vaccine for people who are pregnant or trying to conceive, results showed a significant main effect of the experimental treatment on belief correction, F (2, 779) = 6.46, partial η2 = 0.02, p = .002. However, Sidak post hoc tests showed that the only significant differences were between the weather story (M = 3.68, SE = 0.05) and the empathetic fact checks (M = 3.98, SE = 0.10, p = .02) and between the weather story and the traditional fact checks (M = 3.98, SE = .09, p = .02). Means for the empathetic and traditional fact checks were not different (p = 1.0). When the dependent variable was belief correction about the safety of the COVID-19 vaccine for children age 5 and older, results showed no significant main effect, F (2, 773) = 1.69, partial η2 = 0.004, p = .19. Belief correction about the COVID-19 vaccine for children was statistically indistinguishable for the empathetic fact checks (M = 3.21, SE = 0.11), the traditional fact checks (M = 3.46, SE = 0.12), and the weather story (M = 3.41, SE = 0.05).[↩]
- Credibility of the news story was measured by having people rate from 1 (strongly disagree) to 5 (strongly agree) how “accurate,” “authentic,” “believable,” and “trustworthy” the story was, using a measure adapted from Appelman, A., & Sundar, S. S. (2016). Measuring message credibility: Construction and validation of an exclusive scale. Journalism & Mass Communication Quarterly, 93(1), 59–79. These items were averaged into an index with high reliability (α = 0.94, M = 3.79, SE = 0.93). Then we conducted a multi-factorial ANOVA, which showed neither experimental condition had an effect on news story credibility perceptions, F (1, 454) = 0.50, partial η2 = 0.001, p = .48. However, a Sidak post hoc correction showed the average news story credibility rating for the weather story (M = 4.13, SE = 0.06) was significantly higher at p < .001 than either the average news story credibility rating for either the empathetic fact check (M = 3.40, SE = 0.08) or the traditional fact check (M = 3.32, SE = 0.08). We conducted similar analyses with credibility perceptions of the newscaster and news station as the dependent variables and achieved results that showed the same trend.[↩]
- This was shown by a significant interaction between political beliefs and experimental conditions, F (2, 454) = M 4.03, partial η2 = 0.02, p = .02.[↩]
- This was shown by a significant interaction between whether parents vaccinated their children against COVID-19 and experimental conditions, F (2, 454) = 13.01, partial η2 = 0.05, p < .001.[↩]
- Sutton, K. (2022, May 26). The upfronts nearly forgot about TV’s biggest, oldest audience. Marketing Brew. https://www.marketingbrew.com/stories/2022/05/26/the-upfronts-nearly-forgot-about-tv-s-biggest-oldest-audience.[↩]
- Initially, 2,868 people started the first survey, but data were not used for those who had a duplicate IP address (n = 325), were older than 54 years old (n = 291), were younger than 25 years old (n = 89), had an invalid MTurk ID (n = 25), failed an attention check (n = 12), were not U.S. residents (n = 2), or did not complete the survey (n = 2), resulting in N = 2,122. The survey was open March 5 through May 6, 2023.[↩]
- All 2,122 people whose data were used from survey 1 were invited to participate in survey 2, but only 1,688 did so. Of those, data were not used for those who may have taken the survey more than once (n = 341), failed an audio attention check (n = 173), were not U.S. residents (n = 27), could not hear the audio on the stimuli video (n = 17), declined to allow their data to be used once they were told the intent of the experiment (n = 6), could not see the stimuli video (n = 3), could not view a test video (n = 1), and could not hear a test video (n = 1), resulting in N = 1,119. The survey was open May 17 through June 19, 2023, and participants were invited repeatedly through MTurk’s messaging system.[↩]
- A series of chi-square tests of independence with Bonferroni corrections showed that random assignment was successful.[↩]
- The kids COVID-19 treatment video was 2:03 minutes, the kids COVID-19 control video was 1:56 minutes; the pregnancy/infertility COVID-19 treatment video was 1:18 minutes; the pregnancy/infertility COVID-19 control video was 1:15 minutes; and the overall weather control video was 1:02 minutes.[↩]


