


Facebook generates a significant share of news organizations’ traffic. An average of 25 to 40 percent of external referrals came from the social media platform in the last year, according to an analysis of over 2,500 online media sites in Parse.ly’s network.1
Given the importance of social media for news organizations, it is not surprising that efforts to maximize social media traffic are widespread. It is easy to find tips on how to write headlines that will go viral on social media. These suggestions range from using numbers in headlines2 to using language that will spark an emotional response3 to using specific words like “you” and “your.”4
In the realm of politics, our focus in this report, it is unclear what works to generate more Facebook engagement. We investigate two aspects of political coverage to understand whether they make any difference: the positivity or negativity of news headlines and images, and the focus of news headlines on issues or campaign strategy.
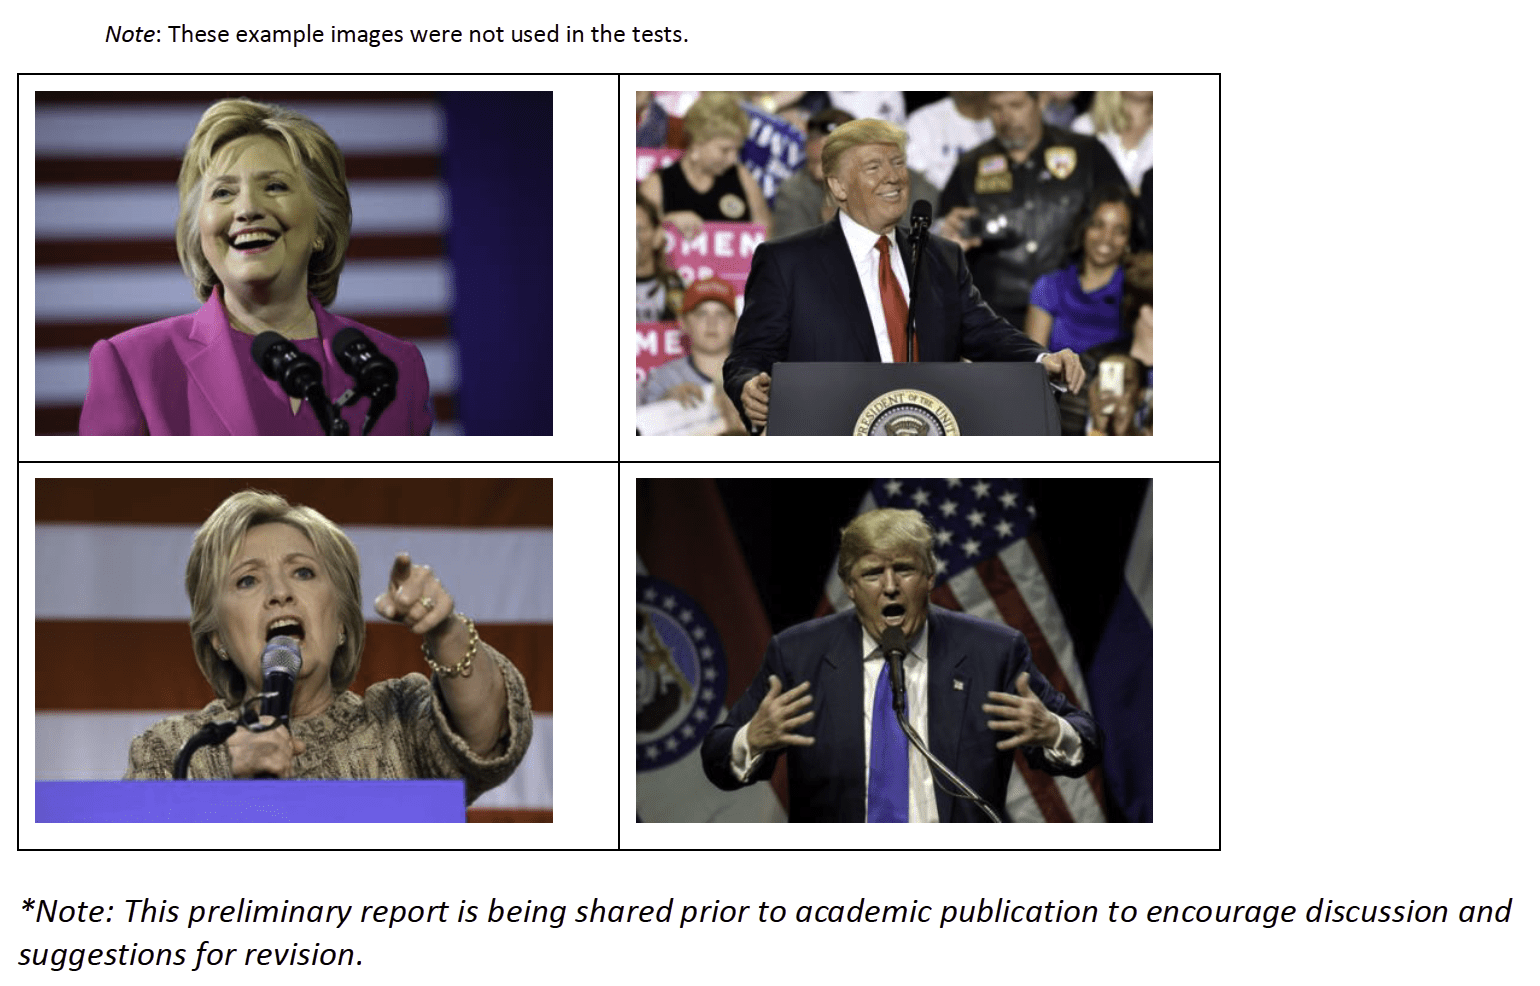
Images can be more positive or negative. Consider the following:
Headlines can be more positive or negative as well. Consider the following:
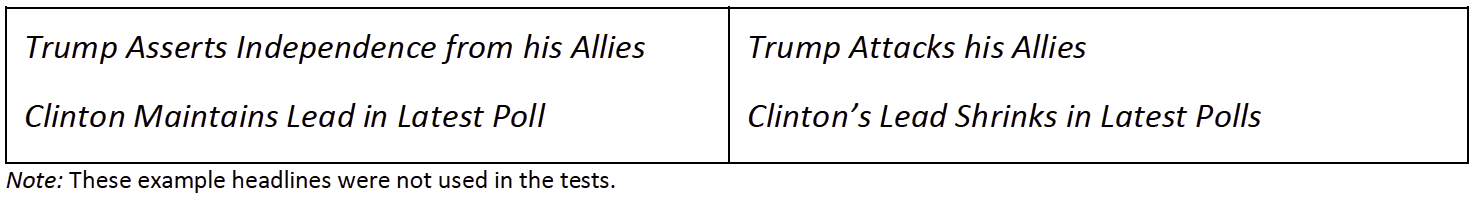
Headlines can emphasize campaign strategy (e.g. who is ahead and behind and how the candidates are maneuvering to gain an electoral advantage) or issues (e.g. the political topics and policies discussed by candidates and the public). The following headlines illustrate the difference:

How do these factors affect Facebook engagement? The Center for Media Engagement partnered with a national news organization and the social media testing platform Naytev to find out. We analyzed what predicts clicks, comments, and reactions (e.g., like, love, haha, wow, sad, and angry). We looked at all three outcomes because Facebook’s proprietary algorithm prioritizes posts that generate more clicks, comments, and reactions in the News Feed.5
We conducted 118 tests on Facebook that garnered 2,670,886 impressions during the 2016 primary and general election. The news organization created posts using Facebook’s sponsored ads system and the Naytev platform, which randomized the displayed headline and image.
In some tests, people saw one of two different images and one of three versions of a headline. In other tests, people saw one of three different images and one of two versions of a headline. For each test, we analyzed whether the headline or image that was the most negative/positive, or the headline that was most strategic/issue-focused generated a different level of engagement than the other headline(s) or image(s). All images and headlines were accurate reflections of the news content contained in the article.
In 69 tests conducted between April 12 and October 19, 2016, the newsroom varied the positivity and negativity of the image and headline.
In 49 tests conducted between October 17 and November 9, 2016, the newsroom varied the positivity/negativity of the image and the issue/strategy focus of the headline.
The Study
Negative Images Increase Clicks, Positive Images Increase Reactions
Many academics and journalists have argued that negativity attracts news users. It may violate our expectations,6 physiologically arouse us7 and draw our attention to deviance.8 There is some evidence outside of a social media setting that news negativity draws clicks.9
Yet social media might be different. When online, people may not always engage with the most negative news.10 Sharing positive information can help people bond socially.11 Further, individuals in social spaces tend to manage the impression they make on other people.12 They want to be perceived in a positive light – and commenting on or reacting to negative news may present an undesirable impression.
So, what wins out on social media? Positive or negative news?
- Our analysis shows that negative images yield more clicks. The most negative image in a test garnered 12% more clicks than the other images.13
- Positive images yield more reactions. The most positive image in a test resulted in 27% more reactions than other images.14
- Commenting was unaffected by positive/negative images. The number of comments did not vary depending on whether a positive or negative image was used.
- The positivity or negativity of the headline made no difference in clicking, commenting, or reacting.
We also analyzed whether these patterns varied depending on whether the headline or image included a prominent Democrat (e.g. Clinton or Obama) or a prominent Republican (e.g. Trump). There were no differences.
Issue-Focused Headlines Reduce Clicks, Increase Reactions and Comments
In political campaign season, news coverage often focuses on the campaign strategy and horserace at the expense of issue coverage, perhaps because, as some academic research suggests, “the horserace sells.”15 Strategy coverage more generally includes news mentioning political motives, metaphors of sports or wars, potential campaign outcomes, candidate or party strategy for winning, or other content that focused more on the “how” of a campaign rather than political issues.16 Yet news coverage that educates about issues is essential during campaigns so that voters can learn where political candidates stand before making a vote choice. We analyzed how voters responded to issue and horserace coverage.17
- Our results show that issue-focused headlines reduced clicks. The most issue-focused headline in a test yielded 30% fewer clicks to the news article than the other headlines.18
- Issue-focused headlines increased reactions and comments. The most issue-focused headline in a test increased reactions the news post by 27%19 and increased comments on the news post by 31%.20
We also analyzed whether these patterns varied depending on the issue emphasized. The results held across various issues like immigration, healthcare, and the economy.
Important Considerations
We find that negative images increase clicks, but decrease reactions. Issue-focused headlines decrease clicks, but increase reactions and comments. As a result of this analysis, it may be tempting to increase the use of negative images and strategy-focused headlines as a way to boost clicks. There are additional considerations:
- Decades of scholarly studies suggest that strategy and negative political coverage can have detrimental effects on news audiences, ranging from political cynicism to decreased trust in the media and political institutions.21
- Facebook’s algorithm prioritizes commenting and reacting in addition to clicks, meaning that focusing solely on clicks misses the full potential of the platform.
- If a newsroom’s goal is to generate a more engaged social media audience, then positive images and issue content may be the way to go.
As with any study, there are limitations. The research was conducted during one election cycle and with one newsroom, so it isn’t possible to know whether the same findings would hold in different circumstances. The findings related to what articles people choose to click on, however, do echo what others using different methods and not looking at social media have found, increasing our confidence that these are persistent patterns.
The analysis here shows that what prompts clicks doesn’t always increase other forms of engagement, like commenting and reacting. Our hope is that this white paper can expose some of the trade-offs facing newsrooms as they determine their social strategy.
Methodology
The Center for Media Engagement at The University of Texas at Austin, with the help of a national newsroom, conducted 118 experiments on Facebook between April 12 and November 9, 2016. The tests were conducted using Naytev, a platform that allows newsrooms to test the success of different headlines, images, and status updates on Facebook.
In nearly all tests, a journalist input a news article along with either three headlines and two images or two headlines and three images into Naytev’s platform.22 Naytev automatically created six different experimental conditions – pairing each headline and each image one time – to post to Facebook’s sponsored ad system. Facebook then sent the ads to the News Feeds of a “look-alike audience,” meaning an audience of Facebook users who are similar to the newsroom’s Facebook page followers who do not already follow that Facebook page.
Each test ran for approximately 48 hours and received between 2,798 and 55,613 unique impressions, for a total of 2,670,886 impressions over all tests. We collected the aggregate number of impressions – that is, the number of people who received each headline/image combination on their news feed – as well as the aggregate number of clicks on the article, reactions (like, angry, sad, etc.) to the post, and comments on the post. We collected no personal data on Facebook users.
Given that positivity and negativity could be subjective, we went through an extensive process to determine which image or headline was most positive and most negative. We utilized amazon.com’s Mechanical Turk crowdsourcing platform. mTurk workers were given two images from each test and asked to indicate which one was more unfavorable. When the test involved three different images, we averaged the percentage of workers indicating that each image was more unfavorable across the pairs.
Before doing this work, we fielded a qualification task where workers were asked to evaluate three pairs of images to identify which image was more unfavorable. The pairs contained images where one was clearly more negative than the other. The workers also evaluated three pairs of headlines for which was more unfavorable. We originally fielded the qualification task among all workers and then specifically targeted conservatives to ensure that we had a balanced political profile among those completing the coding task.
Of the 1,746 workers who completed the qualification survey, 825 answered all six of the test questions correctly and were invited to complete the actual task. Those successfully completing the qualification were then invited to code the images. Each mTurker was permitted to code at most 50 image pairs and each image pair was coded by 50 mTurk workers. In total, 241 mTurkers evaluated an average of 44 image pairs (SD = 13, Range = 1 to 50). Workers were told, “Putting aside your opinion of who or what is shown in each image, pick which image is more unfavorable.” When comparing two images, on average 50 percent rated each image as more unfavorable (SD = 0.29, Range = 0.04 to 0.96).
We used a similar procedure to evaluate the relative favorability for headlines, with one major difference. Whereas the subject of the images was clear, the headlines sometimes evoked multiple people. This made it difficult to determine which headline was more unfavorable. For example, a headline saying that “Candidate A is ahead of Candidate B in the polls” is good news for Candidate A, but not for Candidate B. For this reason, we catalogued each person or entity that was identified in a way that allowed us to determine favorability within each headline. We then asked the mTurk workers to code pairs of headlines for which was more favorable for each subject identified in any of the headlines within an experiment. We then used data for the referent that yielded the highest unfavorable percentage in the analyses described below.
In total, 318 mTurk workers completed 13,700 headline comparisons. On average, each mTurk worker completed 43 comparisons (SD = 14, Range = 1 to 52). When comparing two headlines, on average 50 percent rated each image as more unfavorable (SD = 0.29, Range = 0.04 to 0.96).
We then weighted the ratings by the mTurk workers to match the partisanship of the U.S. population based on data from the 2016 ANES. This allowed us to control for the possible influence of partisanship when computing the results. The general conclusions, however, are the same regardless of whether we do this step.
All statistical analyses were conducted using meta-analytic techniques. Statistical details are included in the footnotes of this report.
SUGGESTED CITATION:
Stroud, Natalie Jomini and Muddiman, Ashley. (2018, June). Political coverage on Facebook. Center for Media Engagement. https://mediaengagement.org/research/political-coverage-on-facebook
- https://www.parse.ly/resources/data-studies/referrer-dashboard/ [↩]
- https://www.outbrain.com/help/advertisers/viral-blog-headlines/ [↩]
- https://www.wired.com/2015/12/psychology-of-clickbait/ [↩]
- https://blog.bufferapp.com/the-most-popular-words-in-most-viral-headlines [↩]
- https://newsroom.fb.com/news/2018/01/news-feed-fyi-bringing-people-closer-together/ [↩]
- Soroka, S., & McAdams, S. (2015). News, politics, and negativity. Political Communication, 32(1), 1–22. http://doi.org/10.1080/10584609.2014.881942 [↩]
- Baumeister, R. F., Bratslavsky, E., Finkenauer, C., & Vohs, K. D. (2001). Bad is stronger than good. Review of General Psychology, 5(4), 323–370. http://doi.org/10.1037//1089-2680.5.4.323 [↩]
- Shoemaker, P. (1996). Hardwired for news: Using biological and cultural evolution to explain the surveillance function. Journal of Communication, 46(3), 32–47. http://doi.org/10.1111/j.1460-2466.1996.tb01487.x [↩]
- Jang, S. M., & Oh, Y. W. (2016). Getting attention online in election coverage: Audience selectivity in the 2012 US presidential election. New Media & Society, 18, 2271–2286. http://doi.org/10.1177/1461444815583491; Meffert, M.F., Chung, S., Joiner, A. J., Waks, L., & Garst, J. (2006). The effects of negativity and motivated information processing during a political campaign. Journal of Communication, 56(1), 27–51. http://doi.org/10.1111/j.1460- 2466.2006.00003.x [↩]
- Berger, J., & Milkman, K. L. (2012). What makes online content viral? Journal of Marketing Research, 49(2), 192–205; http://doi.org/10.1509/jmr.10.0353; Muddiman, A., Pond-Cobb, J., & Matson, J. E. (forthcoming). Negativity bias or backlash: Interaction with civil and uncivil online political news content. Communication Research, 9365021668562. http://doi.org/10.1177/0093650216685625; [↩]
- Rime, B. (2009) Emotion elicits the social sharing of emotion: Theory and empirical review. Emotion Review 1(1), 60-85. [↩]
- Ellison, N., Heino, R., & Gibbs, J. (2006). Managing impressions online: Self-presentation processes in the online dating environment. Journal of Computer-Mediated Communication, 11, 415–441. http://doi.org/10.1111/j.1083- 6101.2006.00020.x [↩]
- The estimated risk ratio was significant [log RR = 0.11, RR = 1.12, SE = .04, 95% CI (0.03, 0.19)]. Note that this analysis is using data weighted by the partisanship of those rating the images as positive or negative. [↩]
- The estimated risk ratio was significant [log RR = 0.24, RR = 1.27, SE = .07, 95% CI (0.11, 0.37)]. Note that this analysis is using data weighted by the partisanship of those rating the images as positive or negative. [↩]
- Iyengar, S., Norpoth, H., & Hahn, K. S. (2004). Consumer demand for election news: The horserace sells. Journal of Politics, 66(1), 157–175. http://doi.org/10.1046/j.1468-2508.2004.00146.x [↩]
- Aalberg, T., Strömbäck, J., & de Vreese, C. (2012). The framing of politics as strategy and game: A review of concepts, operationalizations and key findings. Journalism, 13(2), 162-178. doi: 10.1177/1464884911427799 [↩]
- The two authors coded the headlines for issue and strategy content. We coded each headline individually as mentioning one or more of the following issues: foreign policy, healthcare, economy, immigration, corruption, and any other mentions of other issues or policy generally. To capture strategy content, we coded each headline for any one or more of the following: mentioning polling/public opinion, metaphors of sports or wars, a potential outcome of the campaign, candidate or party strategy for winning, political motives, campaign style/performance, or the media’s role in the campaign (see also Aalberg et al., 2012). The inter-coder reliabilities ranged from Krippendorff’s alpha = .68 to .91. From this coding, each author made a decision about which headline within a specific test was the most issue-focused headline (most issue within test = 1 and not most issue = 0) and which was the most strategy-focused headline (most strategy within test = 1 and not most strategy = 0; Krippendorff’s alpha = .76 for most issue and .82 for most strategy). We used the “most issue/not most issue” variable in the meta- analyses presented here. [↩]
- The estimated risk ratio was significant (log RR = -0.36, RR = 0.70, SE = 0.10, 95% CI (-0.5506, -0.1624)). [↩]
- The estimated risk ratio was significant (log RR = 0.24, RR = 1.27, SE = 0.10, 95% CI (0.0387 0.4453)). [↩]
- The estimated risk ratio was significant (log RR = 0.27, RR = 1.31, SE = 0.10, 95% CI (0.0662 0.4721)). [↩]
- Cappella, J. N., & Jamieson, K. H. (1997). Spiral of cynicism. New York: Oxford University Press.; Hopmann, D. N., Shehata, A., & Strömbäck, J. (2015). Contagious media effects: How media use and exposure to game-framed news influence media trust. Mass Communication & Society, 18(6), 776-798, doi: 10.1080/15205436.2015.1022190; Shehata, A. (2014). Game frames, issue frames, and mobilization: Disentangling the effects of frame exposure and motivated news attention on political cynicism and engagement. International Journal of Public Opinion Research, 26(2), 157-177. doi: 10.1093/ijpor/edt034 [↩]
- In one test, the news organization included three images and only one headline and in three tests, the news organization included three images and three headlines. [↩]