

SUMMARY
The Center for Media Engagement teamed up with the Annette Strauss Institute for Civic Life to examine how news organizations can best communicate information about how to register to vote.
The findings offer guidance to news organizations seeking to help the public be more civically engaged. Our results suggest that news organizations:
- Can be effective at communicating voter registration information to the public.
- Should keep voter registration information simple and to the point.
- Should pair voter registration information with a news story about voting.
- Be cautious about creating involved graphics that may be less effective than a simple text box for communicating voter registration information.
THE PROBLEM
Voter turnout in the United States has lagged for decades,1 particularly in comparison to other democratic countries.2 This undermines the public’s ability to participate in the most essential aspect of the democratic process – voting. The problem has been particularly pronounced in Texas, which had been ranked 44th worst for voter registration and 47th worst for voter turnout,3 although the state has recently broken records for voter registration.4
News organizations can be part of the solution to this problem. The Center for Media Engagement teamed up with the Annette Strauss Institute for Civic Life to examine how news organizations can best communicate information about how to register to vote. We conducted an experiment where we compared different types of messages about how to register to vote – a text box, a colorful graphic, or an interactive tool – to see which was most effective at helping people “feel informed about registering to vote,” “feel qualified to vote,” “feel like voting makes a difference,” “feel knowledgeable about registering to vote in Texas,” and “feel likely to vote.”5 The Democracy Fund funded this project.
KEY FINDINGS
- Across the three types of graphics we tested, a simple text box with information about voting was most effective at making people “feel informed about registering to vote.”
- The text box was also more effective than a story alone in making people “feel qualified to vote.”
- Pairing a news story about voting with a graphic that explained how to register to vote – a text box, a colorful graphic, or an interactive tool – was more effective at making people “feel informed about registering to vote” than any element presented alone.
- None of the elements made people “feel likely to vote,” “feel knowledgeable about registering to vote in Texas,” or “feel like voting makes a difference.”
IMPLICATIONS
The findings of this study offer guidance to news organizations seeking to help the public be more civically engaged. Our results suggest that news organizations:
- Can be effective at communicating voter registration information to the public.
- Should keep voter registration information simple and to the point.
- Should pair voter registration information with a story about voting.
- Be cautious about creating involved graphics that may be less effective than a simple text box for communicating voter registration information.
FULL FINDINGS
This project sought to answer two questions:
- What type of graphic – a text box, a colorful graphic, or an interactive tool – is most effective at communicating how to register to vote?
- Is the graphic more effective when paired with a news story about voting or when shown by itself?
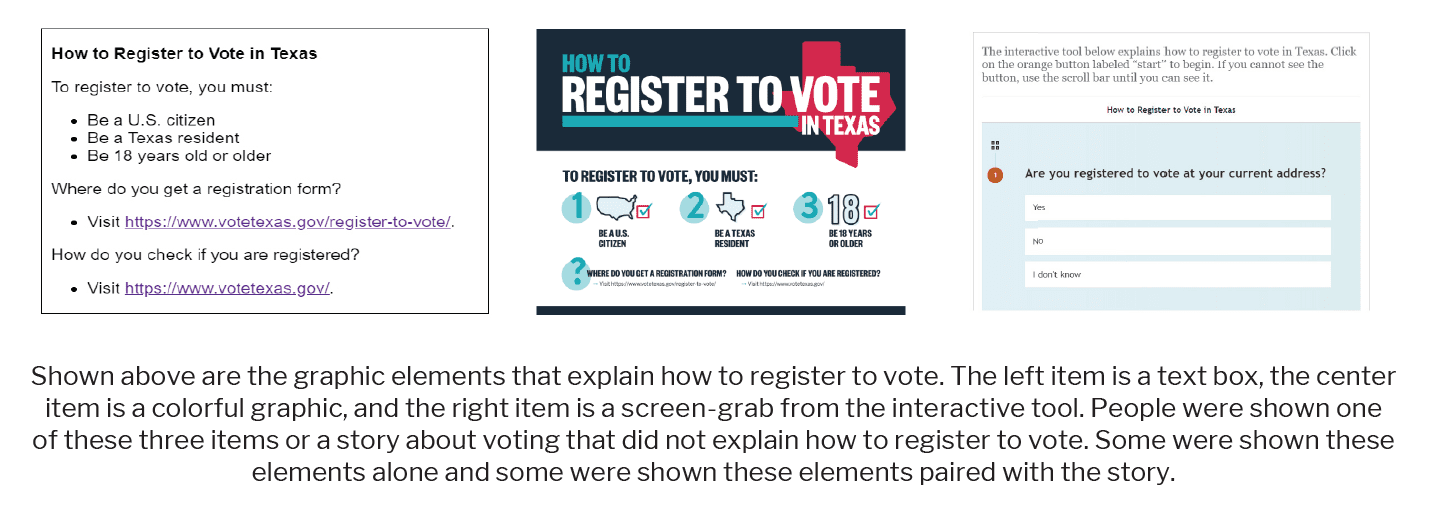
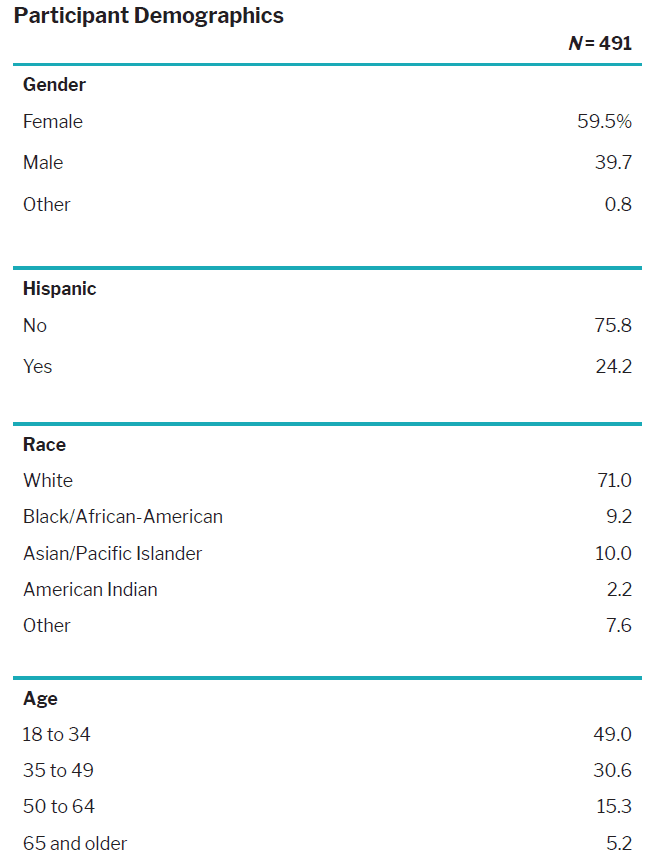
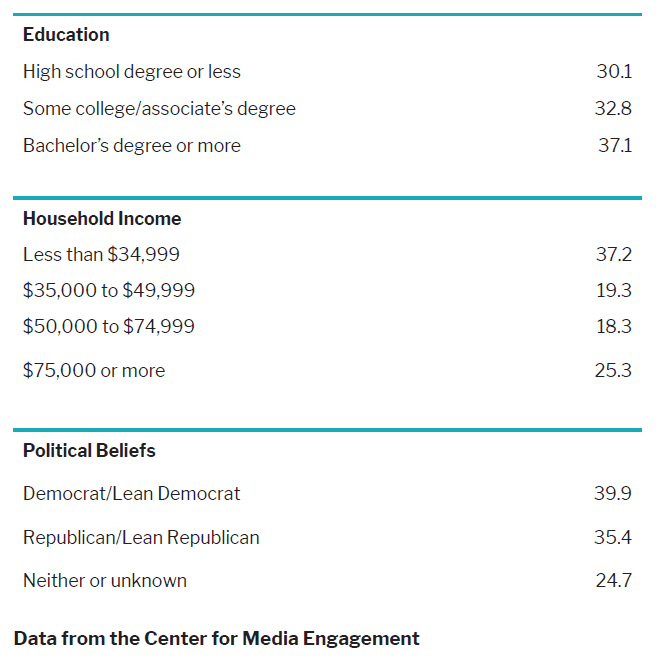
To answer these questions, 491 Texans were randomly assigned to view information about how to register to vote in a text box, a colorful graphic, or an interactive tool, or to view a control condition that just showed a story about voting and did not explain how to register to vote. Those who were assigned to view information with a graphic were also randomly assigned to view the information about how to register to vote either with a news story about voting or as a standalone item. In all cases, the story was about young voters. All items were posted on The Gazette-Star, a mock news site designed to resemble a real new site. Here is an overview of what people were shown:
- A text box that presented information about voting and provided links to more information.
- A graphic that provided the same information but with a colorful design and illustrations.
- An interactive tool that allowed people to find out how to register to vote by answering a series of questions that walked them through the process in a virtual flow chart.
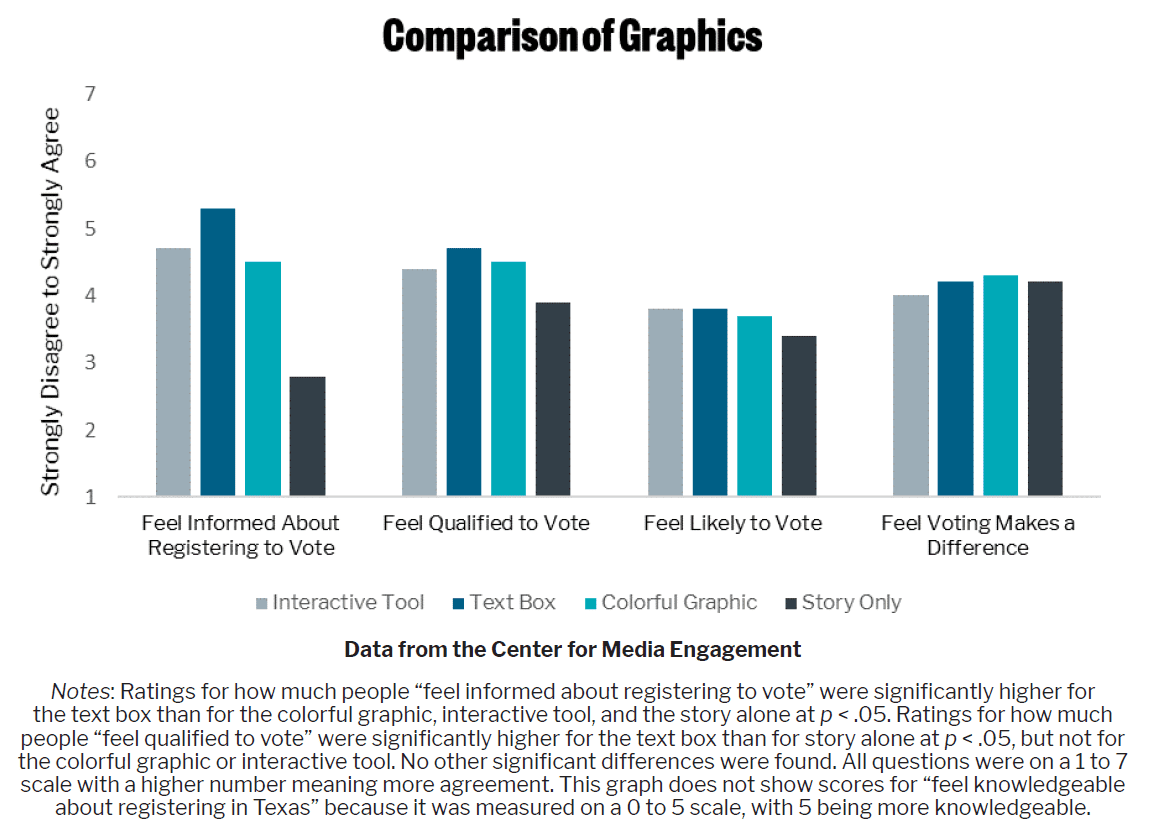
When considering which type of message was most effective, several findings stand out:
- Providing voter registration information in a simple text box was more effective for making people “feel informed about registering to vote” than the colorful graphic, the interactive tool, or the story by itself (the control condition).6
- Similarly, the simple text box was more effective at making people “feel qualified to vote” than the news story by itself, but not significantly more effective than the colorful graphic or the interactive tool.7
- None of the elements made people “feel likely to vote,” “feel knowledgeable about registering to vote in Texas,” or “feel like voting makes a difference.”8
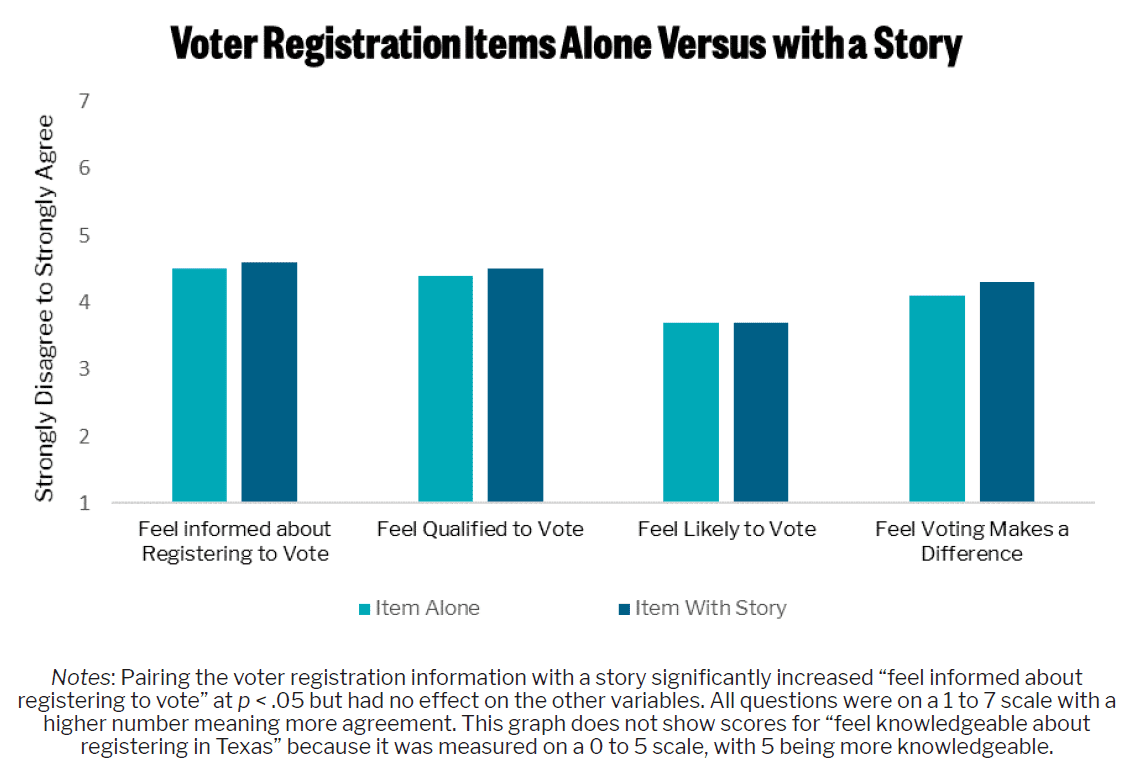
When considering whether or not to pair the information about voter registration with a story, the following results stand out:
- All of the graphic elements were more effective at making people “feel informed about how to register to vote” when paired with the news story about voting than when presented alone.9
- Pairing the graphic with a story had no influence on “feeling qualified to vote,” “feel knowledgeable about registering in Texas,” “likelihood to vote,” or “feel like voting makes a difference.”10
METHODOLOGY
The experiment was conducted from September 2 to 28, 2020.11 Participants had to be U.S. citizens, reside in Texas, be at least 18 or older, and not be registered to vote at their current address. These restrictions were in place because our project sought to test which messages about registering to vote were most effective for people who still could act on those messages.12 A total of 491 Texans met the study eligibility criteria and completed the questionnaire.13
Participants accessed the survey through a computer link. They first viewed the voter registration information and answered a series of questions about their attitudes about and knowledge regarding the process of registering to vote, then answered demographic questions.
- Delli Carpini, M.X., & Keeter, S. (1996). What Americans know about politics and why it matters. Yale University Press; Bailik, C. (2016, November 15). No, voter turnout wasn’t way down from 2012, FiveThirtyEight.com, https://fivethirtyeight.com/features/novoter-turnout-wasnt-way-down-from-2012/ [↩]
- Desilver, D. (2016, August 6). U.S. Voter Turnout Trails Most Developed Countries. Pew Research Center. https://www.pewresearch.
org/fact-tank/2018/05/21/u-s-voter-turnout-trails-most-developed-countries/ [↩] - Jennings, J., & Bhandari, E.E. (2018). Lawrence, R., Wise, D., & Einsohn, E. (2013). 2018 Texas civic health index. Annette Strauss Institute. https://moody.utexas.edu/sites/default/files/2018-Texas_Civic_Health_Index.pdf [↩]
- Wallace, J. (2020, September, 22). Texas shatters voter registration records as Trump-Biden election draws close. Houston Chronicle. https://www.houstonchronicle.com/politics/texas/article/Texas-voter-registration-surges-trump-biden-record-15586286.php[↩]
- Initially, we conducted a principal component analysis (PCA) with promax rotation of all potential dependent variable measures, which suggested the measures loaded on four factors, which became our four dependent variables. “Feel likely to vote” did not load on any of these four factors, so it is treated as a single-item measure. All these variables were measured by asking people to rate their agreement or disagreement on a 1(strongly disagree) to 7 (strongly agree) scale, except “feel knowledgeable about registering in Texas” and “feel likely to vote.” “Feel informed about registering to vote” was measured with three statements: “The information I have just viewed has told me all I need to know about how to register to vote,” “The information I have just viewed has told me all I need to know about voter eligibility in Texas,” and “The information I have just viewed has told me all I need to know about how to get a voter registration form” (M = 4.54, SD = 1.70, Cronbach’s α = 0.90). “Feel qualified to vote” was measured with four statements that were averaged together: “I consider myself well qualified to vote,” “I think I am better informed about voting than most people,” “I feel that I have a pretty good understanding of voter eligibility requirements in Texas,” and “If a friend asked me about how to register to vote, I feel I would have enough information to help my friend” (M = 4.44, SD = 1.28, Cronbach’s α = 0.81). “Feel voting makes a difference” was measured with four statements that were averaged together: “Voting gives people an effective way to influence what the government does,” “I can make a difference if I participate in the election process,” “My vote makes a difference,” and “I have a real say in what the government does” (M = 4.15, SD = 1.65, Cronbach’s α = 0.93). “Feel likely to vote” was measured by asking “How likely are you to vote in the upcoming 2020 presidential election,” on a 1(very unlikely) to 7(very likely) scale (M = 3.71, SD = 2.34). “Feel knowledgeable about registering in Texas” was measured by asking participants five questions about voting that they should have learned from the voter registration information. Participants earned 1 point for each correct answer, for a possible score of 0 to 5 (M = 2.72, SD = 0.11) [↩]
- This was tested with a multi-factorial ANOVA, F (3, 484) = 45.03, p < .001, η² = 0.21. Post hoc comparisons using a Sidak correction showed significant differences between the text box and the colorful graphic, the interactive tool, and a story alone at p< .01. [↩]
- This was tested with a multi-factorial ANOVA, F (3, 483) = 6.35, p < .001, η² = 0.04. Post hoc comparisons using a Sidak correction showed significant differences between the text box and the story alone at p < .05, but not with the colorful graphic or the interactive tool. [↩]
- These were all tested using a series of multi-factorial ANOVAs, and no significant differences were found. [↩]
- This was tested using the same multi-factorial ANOVAs described above. Results showed that voter registration information paired with a news story significantly increase how much people “feel informed about registering to vote,” F (1, 484) = 9.74, p =.002, η² = 0.02. [↩]
- This was tested using the same multi-factorial ANOVAs described above, but no significant differences were found. [↩]
- The Institutional Review Board at The University of Texas at Austin granted approval of the project on April 16, 2020. To get enough participants who fit the eligibility requirements, the survey experiment was distributed in various ways. We recruited participants through Dynata, a professional research company (n = 331); Cloud Research, which culls the higher- ranking participants from Amazon Mechanical Turk (n= 141); and by awarding extra credit to undergraduates at The University of Texas at Austin (n = 19). Initial analyses showed effects did not vary based on recruitment strategy. Dynata participants were compensated with incentives, such as gift cards, through that research firm. Cloud Research participants were paid $1.20 each, and the undergraduates received extra credit from their professors. [↩]
- Participants were asked a series of screening questions about residency, ZIP code, and age to assess this eligibility. For voter registration status, they were asked: “Are you registered to vote in Texas, or not?” Participants who answered “yes, at my current address,” were not able to advance with the survey. Those who answered, “Yes, registered at a different address,” “No, not registered,” or “Don’t know or don’t recall” could advance. [↩]
- Initially, 1,367 people attempted to take the survey, but data were excluded for those who appeared to complete it more than once (n = 89), were not Texas residents (n = 78), did not report a Texas ZIP code (n = 4), were not 18 or older (n = 37), were already registered to vote at their current address (n = 482), couldn’t see the stimuli (n = 95), attempted to participate on Internet Explorer even though they were told that the survey was not optimized for that browser (n = 40), and who failed two attention checks (n = 51). This resulted in N = 491. [↩]