

Online quizzes are increasingly popular. News organizations from The New York Times 1 to Buzzfeed2 have used quizzes to attract audiences and enhance how people use their news sites. It’s part of an overall trend among news sites to gamify the news by making it fun, interactive, or immersive.3 Early evidence suggests these quizzes have the potential to engage audiences and increase their knowledge.4 This project sought to understand whether online quizzes about politics could spark people’s interest in news and politics and increase their intentions to get engaged politically.
To do this, we conducted an online experiment. The participants, 585 U.S. adults, took either one of two quizzes about politics or one of two quizzes about celebrities.5,6
Key Findings
Compared to those who took a celebrity quiz, those who took a political quiz reported:
- Feeling more knowledgeable about politics,7
- Having more interest in political news.
Implications for Newsrooms
Our results suggest news organizations should consider using quizzes about politics on their sites. Findings showed that using political quizzes could increase interest in political news and make people feel more politically knowledgeable. This is positive news, as news organization seek to expand and retain their audiences. An added bonus is that open-access quizzes like the ones we used are free and not difficult to put together.
In addition, this study demonstrated that interactivity on news websites could encourage people to engage with content in ways that perhaps static content cannot. The interactivity inherent in quizzes may create a game-like experience for people that may increase their interest in political news and make them feel more politically knowledgeable, giving them more incentive to engage.
The Study
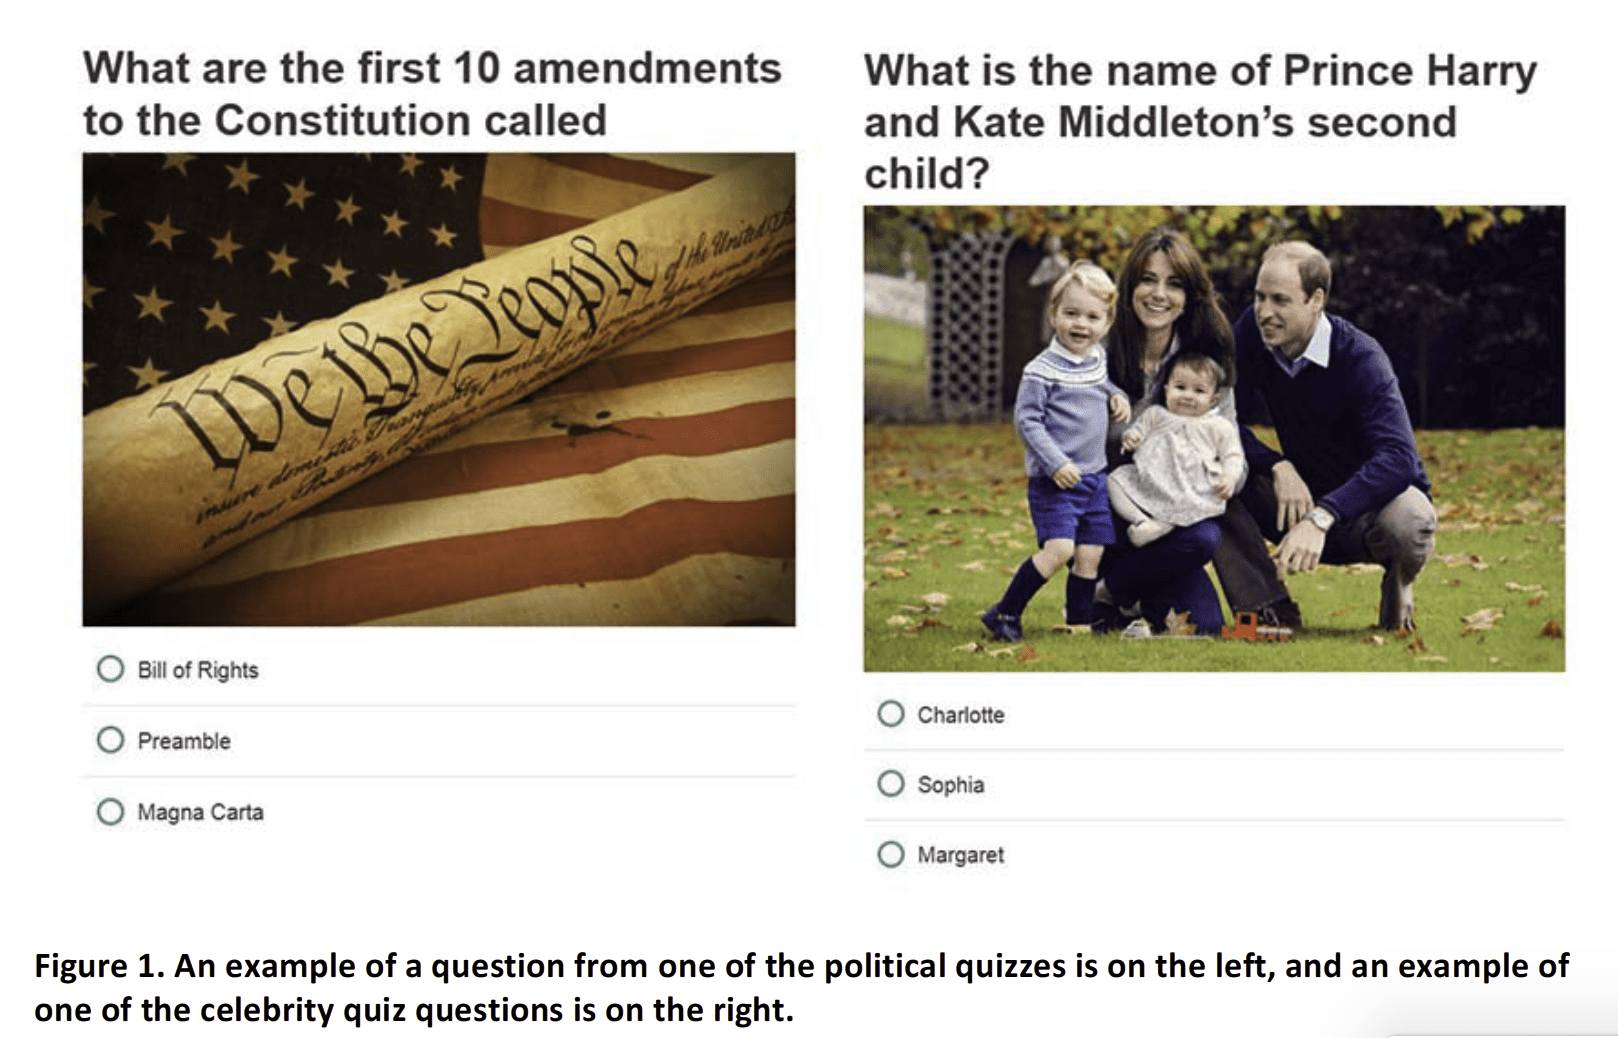
For our experiment, we created four quizzes using the free open-access quiz tool offered by the Center for Media Engagement, and people were randomly assigned to take one of the quizzes. For the two political quizzes, the questions were nonpartisan political knowledge questions, such as “What are the first 10 amendments to the Constitution called?”8 The questions about celebrities had pop culture references, such as “What is the name of Prince Harry and Kate Middleton’s second child?”9 Each quiz contained eight multiple-choice questions with three options for each question. Each quiz took about 30 seconds to complete. Figure 1 shows examples of political and celebrity quiz questions.
After completing the quiz, participants answered questions about how politically knowledgeable they felt,10 their interest in politics,11 their interest in political news and likelihood to read political news,12 and their intention to participate politically both online and offline by doing such things as attending a rally or following a politician on social media.13 We also controlled for people’s pre-existing attitudes toward political engagement,14 as well as their political beliefs15 (liberal or conservative), whether they felt social pressure to engage politically,16 and whether they believed that government officials value what they think.17
What We Found
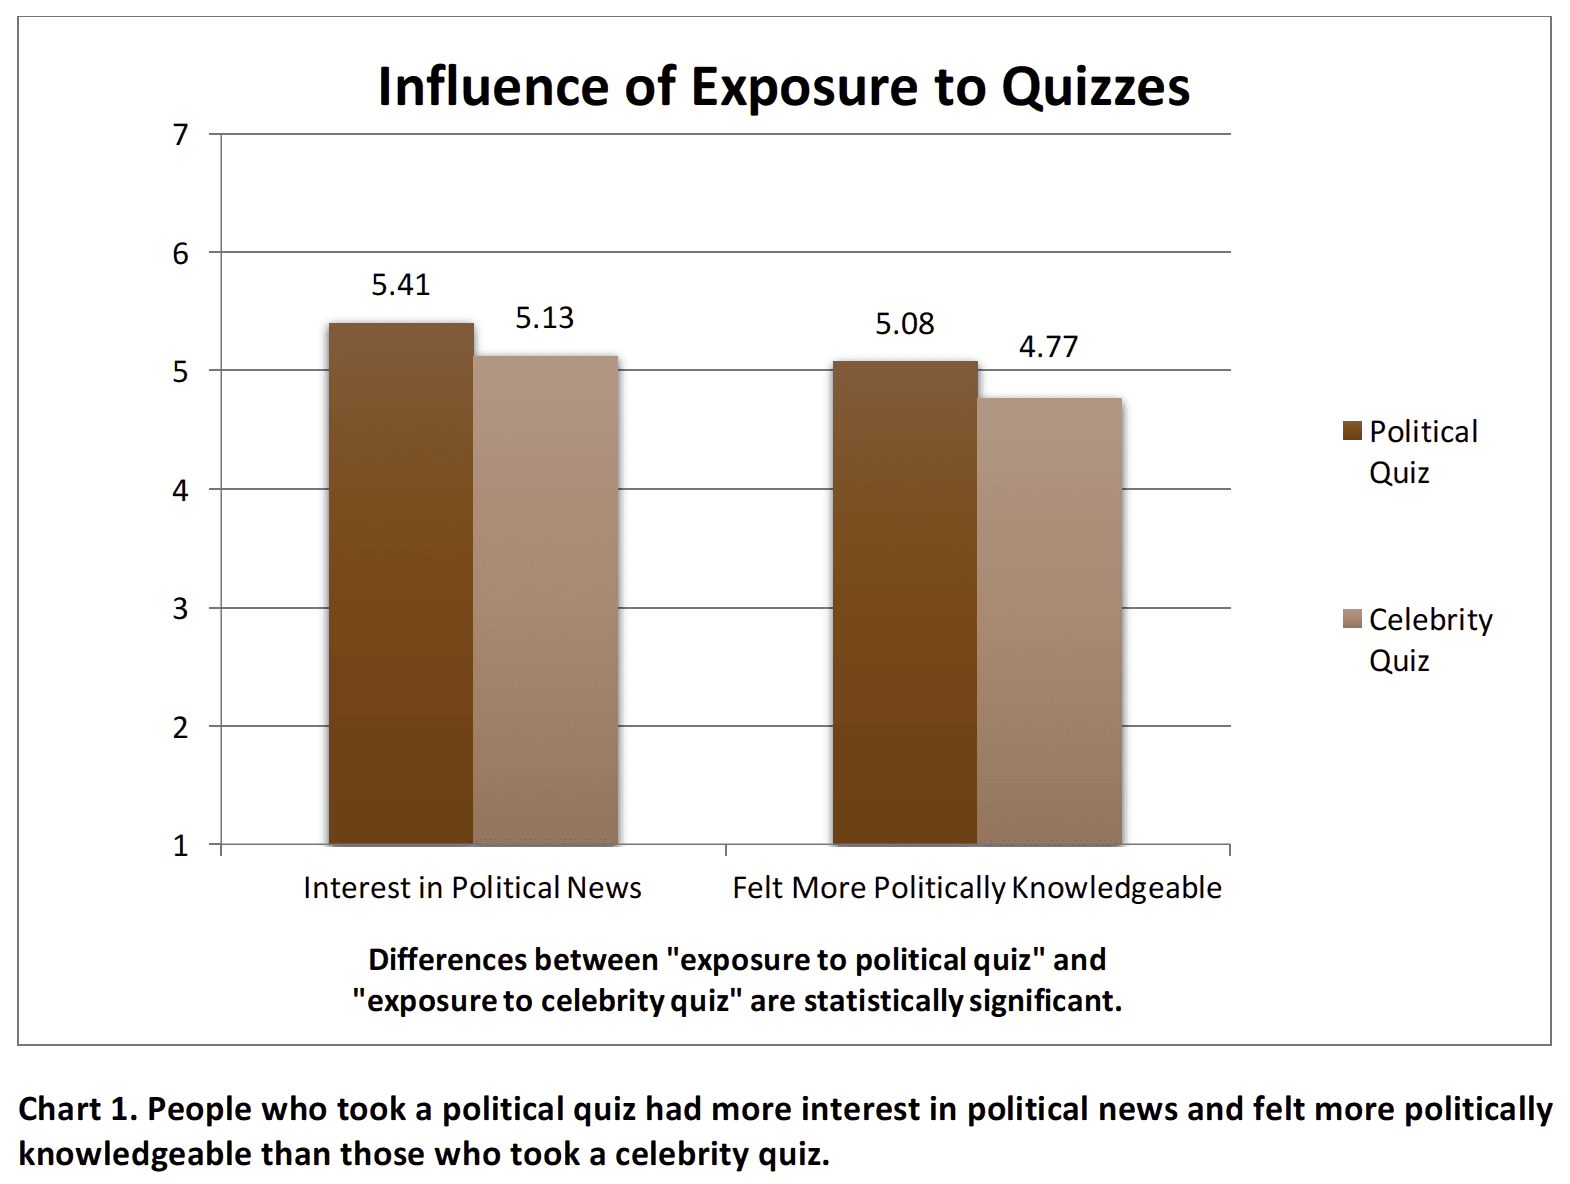
First, we tested whether participants exposed to one of the two political quizzes would be more likely to see themselves as politically knowledgeable, report an intention to participate politically, be interested in political news and politics, and be more likely to read political news.
Our findings showed that people who took a political quiz felt more politically knowledgeable, compared to those who took a celebrity quiz.18 People who took a political quiz also showed more interest in political news,19 compared to those who took a celebrity quiz. Chart 1 shows these results. However, people who took a political quiz were not more likely to read political news, have more interest in politics, or want to participate more in politics by doing such things as, attending a rally or following a politician’s social media account.
Methodology
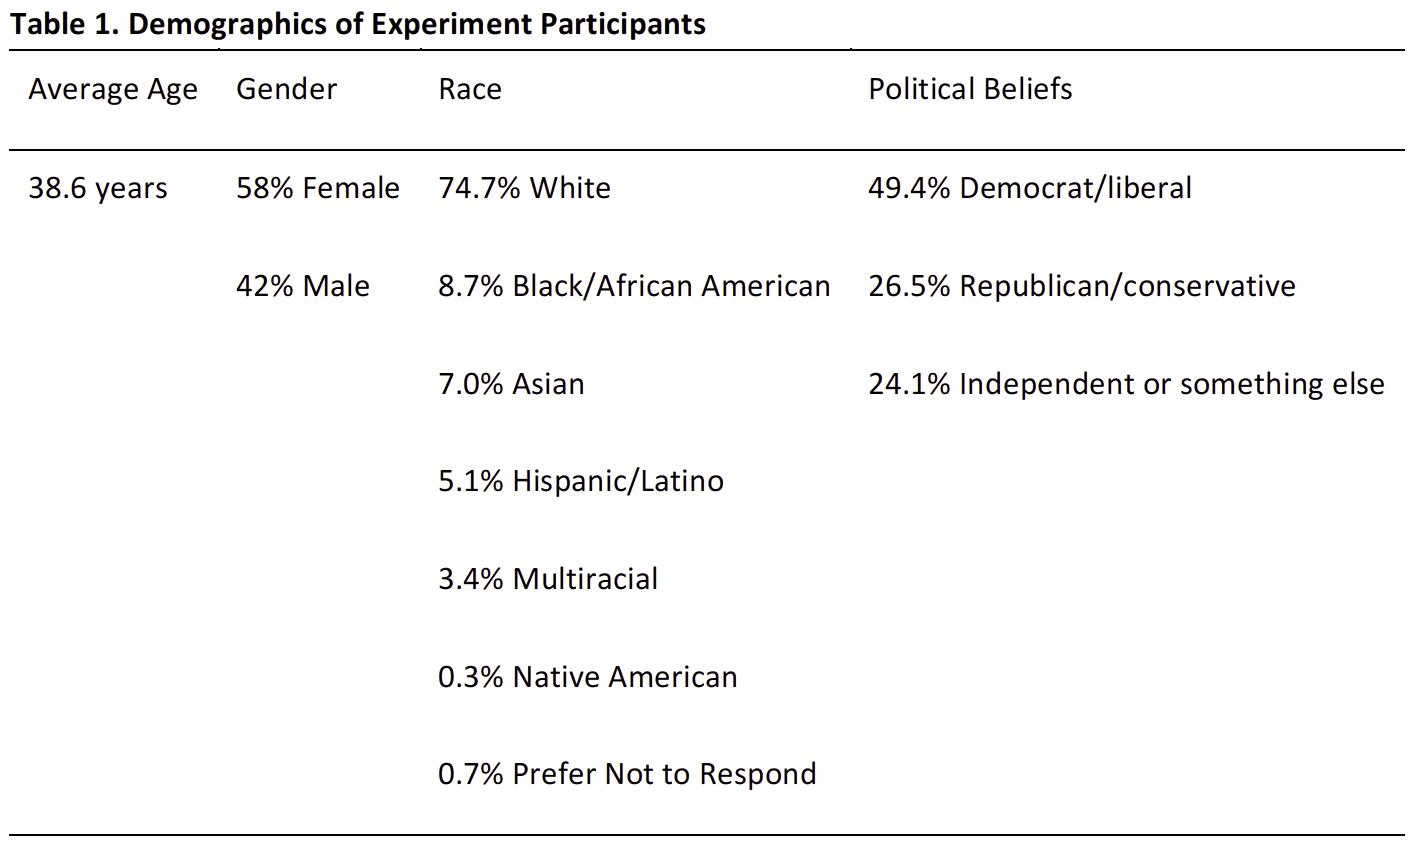
We recruited participants for the experiment using Amazon Mechanical Turk. They were paid 50 cents each to take one quiz and answer questions about it. The experiment was conducted in the fall of 2016. Table 2 shows the demographics of the participants.
The experiment was embedded in an online questionnaire, and participants took the survey on their own computers. They answered demographic questions, and then they were randomly assigned to one of the four quizzes created with the open-access quiz tool. Two quizzes were about politics, and two were about celebrities. Four quizzes were used so we could test whether it was quizzes about politics more generally – not one specific quiz – that produced results. To increase the likelihood that participants completed the quiz, the survey was set up so they could not leave the quiz page until they had spent at least 30 seconds on the page because that is approximately how long the quizzes take to answer. Then they answered questions about how politically knowledgeable they felt, their interest in news and politics, their likelihood to read political news, and whether they wanted to participate politically. To ensure participants had noticed whether the quiz they took was about politics or not, they answered an additional question about the content of the quiz.20 This was done to ensure that participants had actually taken the quiz.
SUGGESTED CITATION:
Chen, Gina Masullo, Ng, Margaret, Chen, Victoria S., and Riedl, Martin J. (2018, April). Online quizzes and interest in political news. Center for Media Engagement. https://mediaengagement.org/research/political-quizzes
- Katz, J., Andrews, W. & Buth, E., “How Y’all, Youse and You Guys Talk,” New York Times, December 21, 2013. [↩]
- Corcoran, L. (2014, February 20). The rise of interactive quizzes. The Whip.com. [↩]
- Batsell, J. (2015). Engaged journalism: Connecting with digitally empowered news audiences. New York: Columbia University Press. [↩]
- Scacco, J. M., Muddiman, A., & Stroud, N. J. (2016). The influence of online quizzes on the acquisition of public affairs knowledge. Journal of Information Technology & Politics, 13(4), 311-325. [↩]
- A total of 599 people completed the experiment, but data from 14 participants were removed because they failed two of three attention checks embedded within the questionnaire to test whether participants were reading the questions carefully. [↩]
- Participants were randomly assigned to either one of two versions of the celebrity quizzes or one of two versions of the political quizzes. This was done so we could test whether quizzes about politics influenced people differently than quizzes about celebrities and to show that results were not limited to one specific quiz. No significant differences between the two political quizzes or the two celebrities quizzes were found for any variable, so these conditions were collapsed in the final analyses. [↩]
- We didn’t ask study participants about their actual knowledge because taking the quiz and receiving feedback about their correct and incorrect responses may have boosted their knowledge compared to those not participating in a political quiz. [↩]
- Questions for the political quizzes were drawn from two quizzes by Pew Research Center: Political Typology Quiz. Accessed at: http://www.people-press.org/quiz/political-typology/; and News IQ Quiz. Accessed at: http://www.pewresearch.org/quiz/the-news-iq-quiz/. Additional questions were taken from political knowledge quizzes from Delli Carpini, M.X., & Keeter, S. (1993). Measuring political knowledge: Putting first things first. American Journal of Political Science, 37(4), 1179-1206, and Jacobs, L.R., Cook, F.L., & Delli Carpini, M.X. (2009). Talking together: Public deliberation and political participation in America. Chicago, IL: The University of Chicago Press. [↩]
- Questions for the celebrity quizzes were drawn from these three quizzes: https://www.buzzfeed.com/sheridanwatson/the-ultimate-celebrity-trivia-quiz?utm_term=.mvvo7mg0A#.ow6X63qRn; http://www.businessballs.com/quizballs/quizballs18_free_trivia_quiz_questions_answers.htm; and http://www.zimbio.com/trivia/zDTiPuJXMp6/Ultimate+2015+Pop+Culture+Trivia [↩]
- Feeling politically knowledgeable was measured using a scale from Mendez, J. M., & Osborn, T. (2010). Gender and the perception of knowledge in political discussion. Political Research Quarterly, 63(2), 269–279. Participants rated on a 1 (much less) to 7 (much more) scale for the following statements: “Generally speaking, how much do you think you know about politics compared to the average Americans?”; “Generally speaking, how much do you think you know about politics compared to the average person your age?”; and “Generally speaking, how much do you think you know about politics compared to other people of your gender?” Responses were averaged into an index with high reliability, M = 4.81, SD = 1.26, Cronbach’s α = .93. [↩]
- Interest in politics was measured was measured using questions from Jacobs et al., 2009. Participants rated on a 1 (not at all) to 7 (very much) scale how interested their were in politics and how much attention they paid to it. Responses were averaged together into an index with high reliability, M = 5.10, SD = 1.44, Cronbach’s α = .92. [↩]
- Interest in political news was measured two ways. First, we used the cognitive engagement scale from Zukin, C., Keeter, S., Andolina, M., Jenkins, K., & Delli Carpini, M.X. (2006). A new engagement? Political participant, civic life, and the changing American citizen. New York: Oxford University Press. Participants rated on a 1 (not likely) to 7 (very likely) scale, subjects rated their likelihood to follow “what’s going on in politics, government, or public affairs,” talk “with family and friends about politics (either online or in person),” and pay attention to “news about politics, government, or public affairs.” Responses were average into an index with acceptable reliability, M = 5.26, SD = 1.31, Cronbach’s α = .86. The second way we measured interest in political news was to show participants three tweets that pre-test participants had previously rated as being about politics. Those in the experiment then rated on a 1 (extremely unlikely) to 7 (extremely likely) scale how much they would want to read the political story mentioned in the tweet. These responses were averaged together into an index with acceptable reliability, M = 4.42, SD = 1.59, Cronbach’s α = .79. [↩]
- Intention to participate politically was measured using scales from Gil de Zúñiga, H., Jung, N., & Valenzuela, S. (2012). Social media use for news and individuals’ social capital, civic engagement, and political participation. Journal of Computer-Mediated Communication, 17(3), 319-336. Participants rated their intention to participate politically online regarding 11 actions, such as forwarding an email or joining Facebook group. For intention to participate politically offline, they rated 10 actions, including writing a letter to the editor or participating in a rally. All ratings were on a 1 (very likely) to 7 (very likely) scale. Online intentions were averaged together into an index with high reliability, M = 3.36, SD = 1.63, Cronbach’s α = .94. Offline intentions were averaged together into an index with acceptable reliability, M = 3.37, SD = 1.28, Cronbach’s α = .88. [↩]
- Attitude toward political engagement was measured using an adaption of a scale from Fishbein, M., & Ajzen, I. (2010). Predicting and changing behavior: The reasoned action approach. New York: Psychology Press. On a 7-item semantic differentiail scale, participants rated whether their views on political engagement were: bad-good, unpleasant-pleasant, harmful-beneficial, or boring-interesting. Responses were averaged into an index with high reliability, M = 5.21, SD = 1.28, Cronbach’s α = .90. [↩]
- Participants rated their political beliefs on two scales from Gil de Zúñiga et al., 2012: 1 (Republican) to 7 (Democrat) and 1 (strongly conservative) to 7 (strongly liberal). A Pearson’s r analysis showed these two statements were strongly associated, r = .84, p < .001. Responses were averaged into an index with high reliability, M = 4.55, SD = 1.78, Cronbach’s α = .91 [↩]
- This concept, called normative pressure, was measured using a scale from Fishbein and Ajzen, 2010, and Hennessy, M., Delli Carpini, M.X., Blank, M. B., Winneg, K., & Jamieson, K. H. (2015). Using psychological theory to predict voting intentions. Journal of Community Psychology, 43(4), 466–483. Participants rated their agreement or disagreement with the following on a 1 (strongly disagree) to 7 (strongly agree) scale: “Most people who are important to me think I should be politically engaged,” “Most people whose opinions I value would approve of me being politically engaged,” “Most people I respect and admire would approve of me being politically engaged,” and “Most people who are important to me are politically engaged.” Items were averaged into an index with good reliability, M = 4.16, SD = 1.51, Cronbach’s α = .88. [↩]
- This concept, called external political efficacy, was measured with a scale from Jacobs et al., (2009). Using a 1 (strongly disagree) to 7 (strongly agree) scale, participants rated their agreement or disagreement with two statements: “I don’t think public official care much about what people like me think” and “People like me don’t have any say about what the government does.” A Pearson’s r analysis showed these two statements correlated moderately (r = .66, p < .001). They were averaged into an index with acceptable reliability, M = 4.60, SD = 1.54, Cronbach’s α = .79. [↩]
- This was tested with an analysis of variance (ANOVA) with exposure to political quizzes as the independent variable (factor) and perception of political knowledge as the dependent variable. Results showed that exposure to a political quiz produced a significant main effect on perception of political knowledge, F (1, 583) = 8.54, p = .004, η2= .02. People exposed to either political quiz saw a significant increase in their perception of political knowledge (M = 5.08, SE = .17), compared to those exposed to either celebrity quiz (M = 4.77, SE = .18). [↩]
- This was tested with an ANOVA with exposure to quizzes as the independent variable and cognitive engagement with political news was the dependent variables. Results showed that people exposed to a political quiz saw a boost in their cognitive engagement (M = 5.41, SE = .18), compared to those who took a celebrity quiz (M = 5.13, SE = .19), F (1, 583) = 6.30, p = .01, η2= .01. [↩]
- This was tested using a manipulation check at the end of the survey. Participants rated whether the quiz they took was “mainly about politics” using a 1 (strongly disagree) to 7 (strongly agree) scale. An ANOVA showed the manipulation was effective, F (1, 583) = 1940.99, p < .001, η2= .77. Those who took a political quiz were significantly more likely to rate it as political (M = 6.49, SE = .08) than those exposed to celebrity quizzes (M = 1.57, SE = .08). [↩]