


Solutions journalism is news reporting focused on emerging responses to societal problems. Articles using this technique focus not just on how people struggle with poverty, for example, but also on what individuals, communities, and institutions are doing to help those who are in need. Solutions journalism is in contrast to more traditional stories that tend to focus on problems. In short, a solutions story examines the efforts being made to address important challenges.
This report presents the results of an experiment conducted by the Center for Media Engagement and two field tests that the Center for Media Engagement led in conjunction with the Deseret News. The experiment and field tests were funded by the Solutions Journalism Network (who was funded by the Rita Allen Foundation) and follow-up on our 2014 report, The Power of Solutions Journalism. The findings suggest that although solutions journalism can bring laudable benefits to readers and newsrooms, it is not a panacea for audience engagement.
In the experiment, a sample of 834 U.S. adults saw one of two online news articles, both reporting on the struggles of the working poor. The articles were nearly identical in length and reading level, had the same headline, and contained the same photograph. The only difference between the two was that one version focused on the working poor’s hardships, while the other reported on the hardships and how some organizations were coming to the aid of the working poor. In other words, one version was about a problem, while the other also included information about solutions to the problem.
In the two field tests, visitors to the Deseret News homepage saw one of two versions of an article at random. Articles used in the first field test were the same articles on the struggles of the working poor that we used in the experiment. The second field test involved articles about unemployed U.S. veterans. The purpose of the field tests was to gauge differences in actual reader behavior – including time spent on the article as well as bounce and exit rates – based on whether a reader saw a solutions article or a non-solutions article.
A few caveats about the generalizability of the findings are in order. First, the two field tests were conducted with a single news organization partner, the Deseret News. We don’t yet know whether the same results hold for other newsrooms. Second, all of the results here relate to articles written for the Deseret News’ poverty beat. Other topics may yield different patterns. Finally, there were several technical glitches associated with the field tests, as described in the text and footnotes.1
Key Findings
Although there are limitations, several noteworthy patterns appeared:
- Time on page was higher for readers of solutions articles compared to readers of non-solutions articles.
- Readers of solutions articles left the website more frequently than non-solutions
- Commenting and social sharing patterns were similar for solutions and non-solutions
- Self-efficacy and optimism were greater for those exposed to solutions articles compared to non-solutions
Implications for Newsrooms
In 2014, the Center for Media Engagement and the Solutions Journalism Network released a joint report on the effects of solutions reporting; the results showed that, relative to problem-focused coverage, this form of journalism increases optimism, a sense of self-efficacy, and intentions to get involved in efforts to address the problem. The current report builds on our prior analysis by looking more closely at user behavior, including time on page, commenting, exit/bounce rates, and social sharing. We also tested the methodology of the previous report using a story focusing on a different topic area.
Combining results from an experiment and two field tests, this report indicates that solutions journalism can affect readers and news organizations in important ways. When deciding how to write stories, journalists and newsrooms will need to weigh the potential uptick in time on page against the possibility of higher bounce and exit rates. Why solutions readers linger longer, yet leave more frequently, is unknown and worthy of future investigation. What is clear, however, is that readers of solutions stories leave the news site feeling more optimistic and more likely to believe that there are potential solutions to important social problems.
The Study
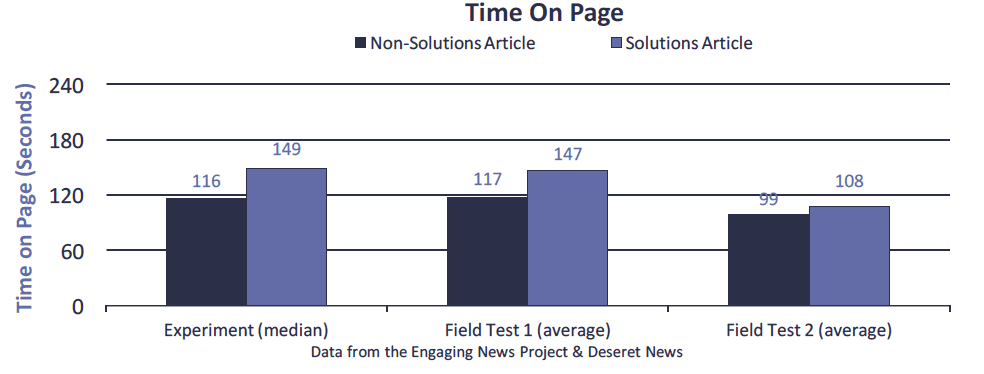
Time on Page Higher for Solutions Stories
In our experiment, readers spent more time on the solutions article than the non-solutions article, a pattern also supported by both field tests.2 In the experiment and in field test 1, readers viewing the solutions version of the working poor article spent roughly 30 seconds longer on the page, or approximately 25% more time, than those viewing the non-solutions article page. In field test 2, where the unemployed veterans article was shorter, readers of the solutions story spent nearly 10 seconds longer (9% more time) on the webpage than those who read the non-solutions version. Note that in field test 1, the solutions version had more unique visitors and in field test 2, the non-solutions version did. Although these differences could be random, it’s also possible that different sorts of people read each version. Despite this, the results are consistent across the three tests.
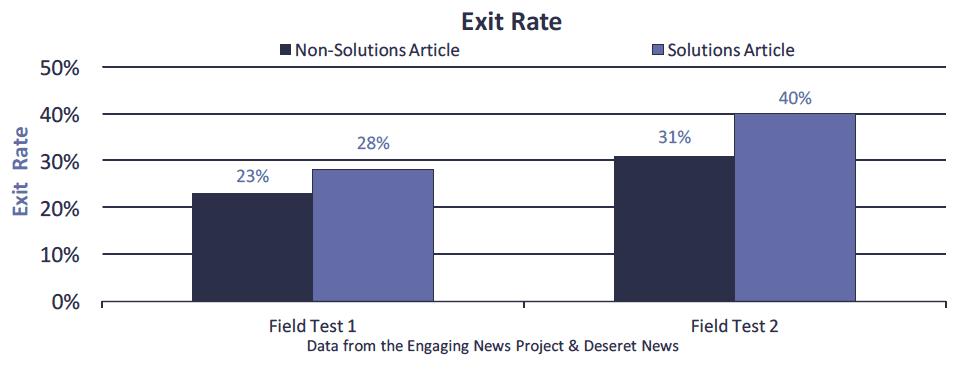
Bounce and Exit Rates Higher for Solutions Stories
Results from our field tests indicate that bounce and exit rates were higher for solutions articles than for non-solutions articles. Bounce and exit rates refer to the propensity of a visitor to leave a website after visiting a page.3 In particular, the bounce rate relates to those who leave a website after visiting only one page on the site. As noted, there were differences in the number of unique visitors to each page. Nonetheless, bounce rates were about 15 percentage points higher for solutions articles in both tests.

The exit rate refers to those who first visited multiple pages on a site and then navigated away from the site after visiting a particular page. Again, the results were similar across the tests. For solutions readers, exit rates were five-to-nine percentage points higher than non-solutions readers.
We do not have data on where site visitors went after visiting the solutions and non-solutions articles, which would provide further insight into these findings. For example, solutions articles may have motivated people to leave the website to look for more information on organizations working to address social problems. Future studies should examine where readers navigate after leaving solutions and non-solutions articles.
No Difference in Commenting or Social Sharing Behavior
The experimental webpages, as well as the field test webpages, allowed people to leave comments and share the articles on Facebook, Twitter, and other social media sites.4 We were able to capture commenting data in the experiment and the first field test, but not in the second field test.5 Data from the first field test also was compromised by the solutions version being inadvertently posted to another section of the website. Nonetheless, comparisons of commenting and sharing numbers for the experiment and first field test show no significant differences between the solutions and non-solutions articles.6
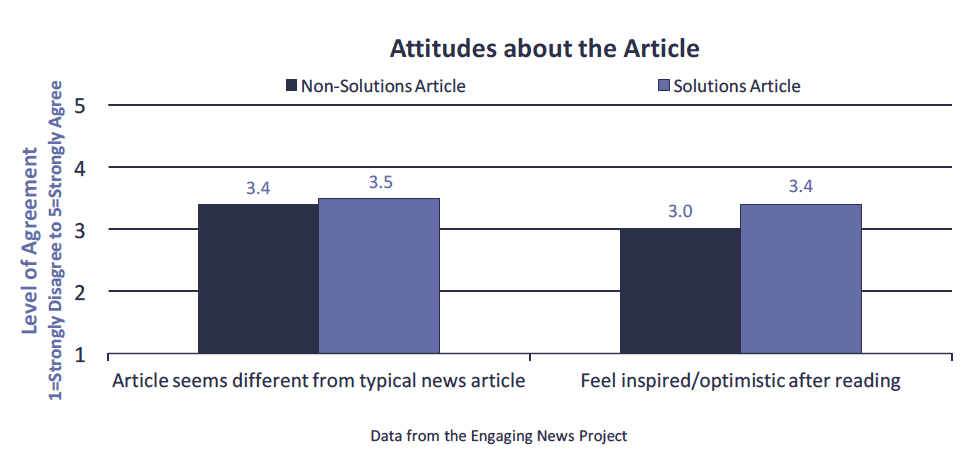
Readers See Solutions Stories as Different, Inspirational
In the experiment, readers were asked a series of questions aimed at gauging their attitudes about the article as well as the issue addressed in the article. Replicating results from our 2014 study, solutions readers indicated that the article “seemed different from typical news articles” and that they felt more “inspired and/or optimistic” after reading the article than non-solutions readers.7 Several other differences detected in our 2014 report remained in the same direction, but were not statistically significant in this analysis.8 The chart below shows statistically significant differences between solutions and non-solutions readers.
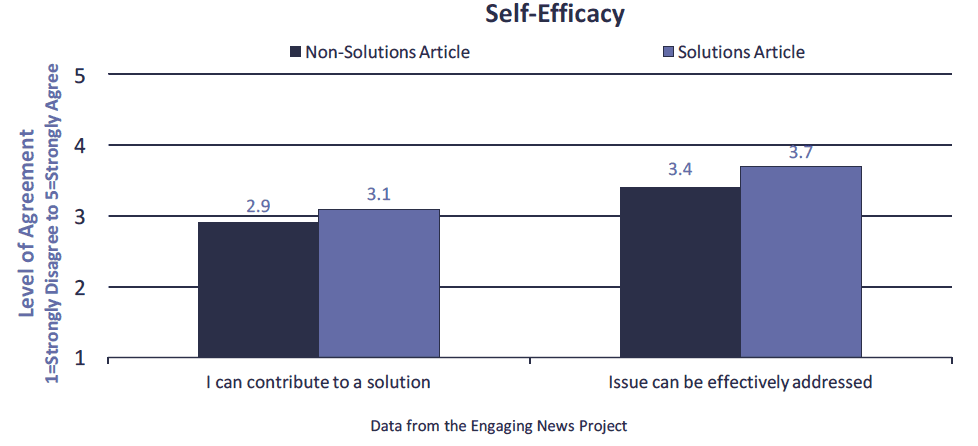
Reader Self-Efficacy Higher for Solutions Stories
Also in our experiment, readers were asked whether they agreed that they could contribute to a solution to the struggles of the working poor and if there were effective ways to address the issue. In both cases, solutions readers expressed greater agreement than non-solutions readers.
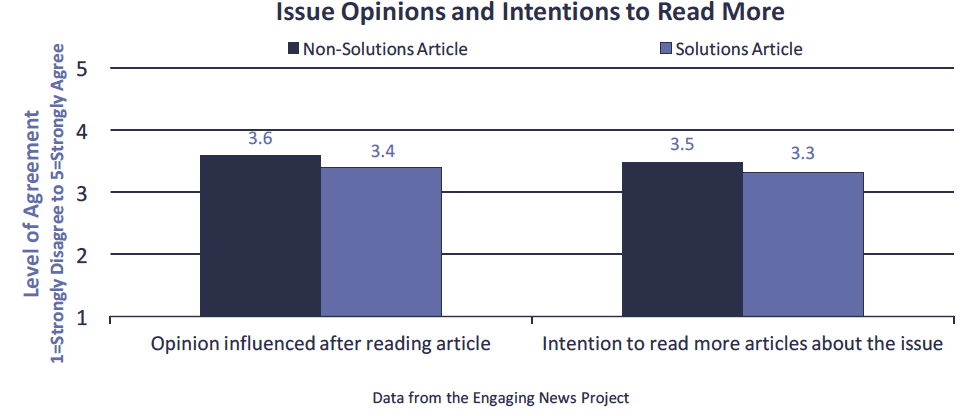
Solutions Stories Seen as Influencing Opinions Less, Yield Lower Intentions to Read More About the Topic
In a few instances, a statistically significant result emerged in the direction opposite our 2014 report; when asked about their intention to read more articles about the issue, non-solutions readers scored significantly higher than solutions readers. Further, non-solutions readers scored higher than solutions readers when asked if they agreed that the article influenced their opinion about the struggles of the working poor.9
Methodology
A survey-based experimental design was employed to test the effects of solutions journalism. Respondents were recruited via Survey Sampling International (SSI), which administered the online survey to a nationwide sample of 1,132 American adults in December of 2015. After removing respondents who did not correctly answer manipulation checks, did not adequately complete the study, or did not qualify for participation, the final sample size analyzed in this report is 834.10 Although the respondents were not randomly selected, they were demographically diverse and representative in the sense that the demographics of the SSI panel members completing this study were selected to match demographic targets from a nationally representative, random sample survey conducted by the Pew Research Center. A comparison of the demographic attributes of participants in the experiment and the Pew study can be found on the next page. Cross-tabulations and ANOVAs revealed no significant differences between conditions on these demographic variables.
In the study, respondents were invited to read, “a recent article that appeared in a U.S. newspaper” (Deseret News was not identified as the source), and told that after reading the article they would be asked several questions. Respondents were encouraged to read the article thoroughly, as they were told that they would not be able to return to the text of the article after they finished reading.
After reading the instructions, respondents saw one of two articles. Both articles dealt with the financial struggles of the working poor. One version of the article consisted of solutions content and the other, non-solutions content. The articles were nearly identical in word count and in reading level (see the sections below for comparisons of the articles), and both versions had the same headline and photograph of a payday lending storefront. In the experiment, the articles appeared on The News Beat, a fictitious news website created for the purposes of our experimental studies. The webpage had working Facebook and Twitter share buttons at the top and bottom of the page, as well as a working comment section, pre-populated with two comments. The pre-populated comments were identical in both conditions.11 In addition, the page employed a responsive design, ensuring that respondents would have an optimal user experience whether viewing the article page on a desktop/laptop, tablet, or smartphone.
After reading the article, all respondents were asked to respond to an identical series of survey items. Most of the survey items consisted of 5-point Likert-type scales, where respondents were given a statement and asked to indicate their level of agreement with the statement (1 = strongly disagree to 5 = strongly agree).
The first two questions after reading the article constituted a manipulation check, used to determine whether respondents carefully attended to the article. The first question asked respondents to identify the topic of the article. Following initial data cleaning, the sample of respondents was 998 (see footnote 10), of which 76 did not correctly identify the article topic. The 922 who correctly identified the topic were asked a second question about whether the article they read focused on solutions to poverty, problems related to poverty, or a mix of the two. Eighty-two respondents either said that the article focused on solutions when they were in the problem condition or that the article focused on problems when they were in the solution condition. Eliminating these participants, as well as six participants who did not complete the manipulation check, left a final sample of 834.

The experiment replicated some of the measures from our 2014 report. Note that there were important differences between the studies. In this study, we focused on a single article comparison, while our 2014 report focused on three different article topics (trauma, homelessness, and clothing). We also employed a different manipulation check in this study.
In the studies, participants were asked to agree or disagree with a series of statements, as shown in the table below. For each, we compared the solutions version to the non-solutions version.
The Center for Media Engagement partnered with the Deseret News to test the effects of solutions articles in a real-world setting. For both field tests, visitors to the Deseret News homepage saw one of two versions of an article at random. In field test 1, a Deseret News reporter wrote two articles about the struggles of the working poor, with one version focused on solutions and the other version focused on problems. The Center for Media Engagement revised the articles to ensure that they were as comparable as possible using the metrics below. We also aimed to have similar numbers of quotations and studies referenced in the article texts. The articles each contained two in-text hyperlinks.12 The structure and readability of the two articles were very similar.
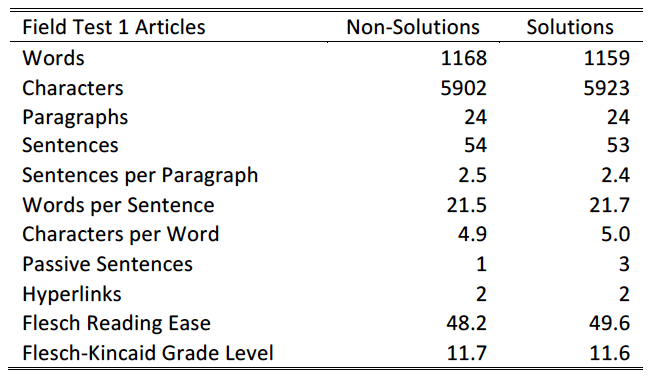
The article was displayed prominently on the Deseret News homepage on June 17, 2015, and both versions of the article had the same headline and photograph. During the first field test, the Deseret News inadvertently posted the solutions version to both the homepage and to another section of their website. The problem version was only posted to the homepage. To take this issue into account, the time on page, bounce rate, and exit rate metrics are only for those who accessed the article from the Deseret News homepage. This does raise some issues with the commenting and social sharing data; however, neither the experiment nor the field test displayed notable differences in these metrics.
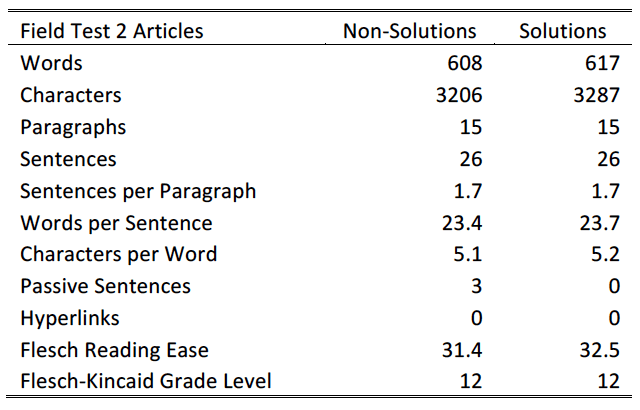
In the second field test, two versions of an article about unemployed U.S. veterans were written by a former journalist and current researcher for the Center for Media Engagement. Visitors to the Deseret News homepage on January 7, 2016 saw one of two versions of the article.13 The article remained on the homepage for one day. In field test 2, the solutions and non-solutions articles had slightly different headlines, reflecting the focus of the article as being about problems or solutions. The photograph accompanying the article differed as well, a decision made by the Deseret News. The solutions version photo showed a well-groomed man in army fatigues sitting at a desk, while the non-solutions version depicted an unkempt man standing outside holding a handmade “homeless vet” sign.14 The articles contained no hyperlinks. The chart below indicates the similarities/differences between the two versions of the article.
In both field tests, the bounce rate, exit rate, and time on page were tracked using Google Analytics. Following the field tests, Deseret News shared the analytics data with the Center for Media Engagement.
SUGGESTED CITATION:
Curry, Alex, Stroud, Natalie Jomini, and McGregor, Shannon. (2016, March). Solutions Journalism & News Engagement. Center for Media Engagement. https://mediaengagement.org/research/solutions-journalism-news-engagement/
- During the first field test, the Deseret News inadvertently posted the solutions version to their homepage as well as to another section of their website, while the non-solutions version only appeared on the homepage. For this reason, all results for field test 1 pertain only to those who accessed the article from the homepage. Despite this constraint, there were inconsistencies in the number of unique visitors who clicked on the solutions version (n = 976) compared to the non-solutions version (n = 563). For the second field test, there also were differences in the number of visitors (solutions n=128; non-solutions n=219). One possible reason for the differences in the second test is the variation in the images and headlines associated with the two article versions, yet we cannot be sure that this accounted for the difference. Because of these features of the studies, we do not discuss unique visitors or page views for the field tests. In addition, following the second field test, a Deseret News staffer accidentally deleted the problem version article from their servers, making it impossible to compare the final number of comments and social shares. Because of these technical errors, caution should be exercised in generalizing the results drawn from the field tests. [↩]
- A Mann-Whitney test was performed to compare time on page for the experimental data. Before computing the test, outliers who spent 20 or more minutes on the webpage (n = 21) were removed. Test results indicate that respondents in the solutions condition (n = 386) spent significantly more time on the page (U = 75703.50, p =.045) than respondents in the non-solutions condition (n = 427). The finding is marginally significant if instead of removing those spending 20 minutes or longer with the article, we replace the time values with 20 minutes. The finding also is marginally significant if a higher threshold of 30 minutes is used. This significant finding holds for those who passed both manipulation checks, but not when testing those who only passed the first manipulation check, but failed the second. [↩]
- Google has an Analytics help page that provides a detailed explanation of exit rate versus bounce rate. [↩]
- Deseret News was able to report comment and social share numbers for field test 1, but, as already noted, they were not able to accurately report these numbers for field test 2. [↩]
- Following completion of the second field test, Deseret News inadvertently deleted the problem version of the article from their server, and with it, the final commenting data. [↩]
- In the experiment, respondents were asked about their likelihood of sharing the article on social media. Those in the non-solutions condition were significantly more likely to indicate that they would share the article than those in the solutions condition t(826) = 2.02, p = .04. Findings from our 2014 study were in the opposite direction, namely that solutions readers indicated a significantly higher likelihood of sharing the article than non-solutions readers. Although the question in the experiment gauged intentions to share, the field test measured actual sharing behavior, and the measured behavior did not indicate a difference. For these reasons, we focus on the observed behavior in the main text. [↩]
- Statistically significant differences between respondents in the solutions and non-solutions conditions were detected when they were asked if the article seemed different than the typical news article, t(828) = 2.01, p = .045, and if they felt inspired/optimistic after reading the article, t(831) = 5.76, p < 0.001. [↩]
- Some reader measures that were significant in our 2014 study were no longer significant in this 2016 study. The non-significant findings, as well as one significant finding that was opposite of a 2014 finding, are reported here. Readers did not differ significantly when asked if: they gained new knowledge about the issue, t(829) = -1.45, p = .15; the article increased their interest in the issue, t(831) = 1.73, p = .08; they felt better informed about the issue, t(828) = 1.44, p = .15; they wanted to read more articles by the same author, t(823) = 1.53, p = .13; they wanted to read more article from the same news site, t(824) = 1.51, p = .13; they wanted to try to get involved in working toward a solution to this issue, t(825) = 1.26, p = .21; they wanted to donate money to an organization working on this issue, t(827) = .12, p = .90; and they wanted to talk to friends and family about the issue, t(825) = 1.48, p = .14. On one measure, a 2014 outcome that favored solutions articles switched to favoring non-solutions articles: when asked about their intention to read more articles about the issue, non-solutions readers scored significantly higher (3.48 on a five-point scale) than solutions readers (3.32), t(825) = 2.04, p = .04. [↩]
- Statistically significant differences between respondents in the solutions and non-solutions conditions were detected when they were asked if they felt they could contribute to a solution to the problem, t(831) = 2.10, p = .04, if they felt the issue could be effectively addressed, t(828) = 4.33, p < 0.001, and if their opinion about the issue was influenced by the article, t(831) = 2.25, p = .03. [↩]
- Not all of the 1,132 people sampled were used in the final data analysis. As the survey was to be administered to American adults, those not meeting age or residency qualifications were removed (n = 30). Furthermore, some survey items were counter-valenced in order to detect any respondents who might select responses in a single column for all items (for example, someone who chooses “strongly agree” for every item). All those who gave identically-valenced responses for the Likert-type items were removed from the data (n = 30). Also, respondents were asked if they were able to view the article webpage; the 22 respondents who indicated they were unable to view the page were removed. Some respondents (n = 40) were unintentionally sampled twice by SSI, and they were removed from the analysis. Lastly, several open-ended response questions were asked of respondents, 12 of whom responded to these inquiries with random strings of letters (e.g., “owefwiefwoeijf”); they were also removed from the analysis. This left a sample of 998 prior to the manipulation check. We describe the manipulation checks in text. [↩]
- There were two comments, both of which were taken from real comments left on the Deseret News website during the first field test. Both comments were well-written, even-handed opinions related to poverty and the working poor. The names of the original Deseret News commenters were changed. [↩]
- Both versions contained a hyperlink to the same FDIC data on the banking practices of Americans (the link appeared in the eighth paragraph of the non-solutions version and in the ninth paragraph of the solutions version). The additional hyperlink in each article was as follows: The non-solutions version contained a hyperlink to a Pew Charitable Trusts report on household financial security (appearing in the story’s sixth paragraph) and the solutions version contained a hyperlink to a study conducted by Abt Associates related to individuals with low incomes (appearing in the story’s fifth paragraph). [↩]
- Note that the articles were originally posted on January 6, 2016, but were inadvertently posted on multiple places on the site. The articles were taken down and then reposted the next day. All data from the test included in the report are from January 7, 2016. [↩]
- The non-solutions version garnered more unique visitors than the solutions version (solutions, n = 128; non-solutions, n = 219). Because of this difference, it is possible that the characteristics of those viewing the solutions version may differ from those viewing the problem version. It is noteworthy, however, that the first field test did not vary the headline or image associated with the story yet the results for both field tests were similar for time on page, bounce rate, and exit rate. This is at least suggestive that differences in the visitors do not explain the findings. [↩]